 Arctic SDI catalogue
Sciences de l'environnement
Type of resources
Categories
Available actions
Keywords
Contact for the resource
Provided by
Years
Formats
Representation types
Update frequencies
status
Service types
-
The Magpie River ramping rate study (2000–2017) investigated the ecological effects of hydroelectric flow regulation on fish, invertebrates, and water quality in the Magpie and Batchawana rivers in the Algoma Region of Ontario. Conducted under a Fisheries and Oceans Canada–Brookfield Renewable partnership, the study employed a Before-After-Control-Impact (BACI) design to assess whether ramping rate restrictions at the Steephill Falls Waterpower Facility improved downstream conditions. Initial restrictions (2002–2005) were later removed, allowing unrestricted flow changes until 2017. In this dataset, monthly sampling from spring to fall included chlorophyll a and water chemistry at multiple sites to monitor productivity and detect irregularities. Analyses followed APHA standard methods, with chlorophyll a, pH, alkalinity, and conductivity processed at Fisheries and Oceans Canada, and major ions and nutrients at the Great Lakes Forestry Centre in Sault Ste. Marie, Ontario. Findings contribute to understanding flow management impacts on river ecosystems.
-
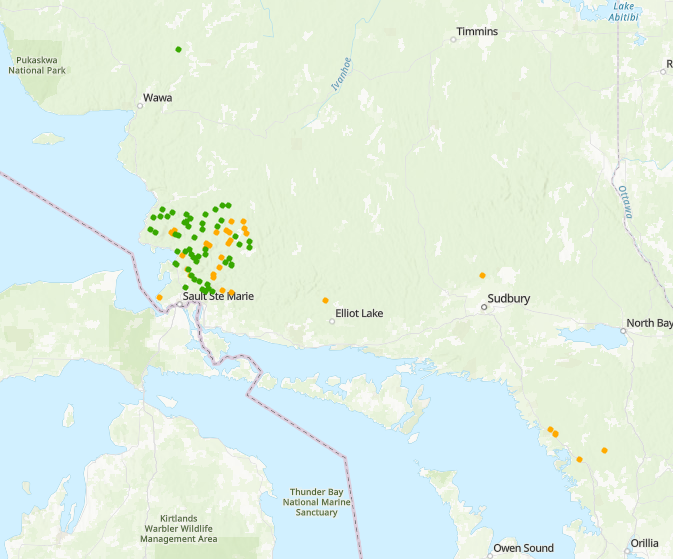
This program summarizes long term water chemistry and chlorophyll a monitoring in north central Ontario lakes developed under Canada’s Long Range Transport of Air Pollutants (LRTAP) initiative to understand and track lake acidification caused by atmospheric deposition. Centered on the intensively studied Turkey Lakes Watershed since 1979 and complemented by broader headwater and mesoscale lake networks around Sault Ste. Marie, Ontario, as well as a few locations near Parry Sound, Ontario, the monitoring integrates catchment scale approaches to link atmospheric inputs, watershed processes, and aquatic responses. Water chemistry measurements quantify acid–base status, major ions, nutrients, and trace metals to diagnose sensitivity to acidification, episodic stress during events such as spring snowmelt, and long term chemical recovery following emission controls. Chlorophyll a is used alongside chemistry to indicate phytoplankton biomass, lake productivity, and overall water quality, providing biological context for fish habitat and ecosystem condition. Together, these coordinated datasets support both detailed process studies and regional assessments of lake sensitivity, productivity, and ecological recovery across a heterogeneous landscape.
-

Description: This dataset contains layers of predicted occurrence for 65 groundfish species as well as overall species richness (i.e., the total number of species present) in Canadian Pacific waters, and the median standard error per grid cell across all species. They cover all seafloor habitat depths between 10 and 1400 m that have a mean summer salinity above 28 PSU. Two layers are provided for each species: 1) predicted species occurrence (prob_occur) and 2) the probability that a grid cell is an occurrence hotspot for that species (hotspot_prob; defined as being in the lower of: 1) 0.8, or 2) the 80th percentile of the predicted probability of occurrence values across all grid cells that had a probability of occurrence greater than 0.05.). The first measure provides an overall prediction of the distribution of the species while the second metric identifies areas where that species is most likely to be found, accounting for uncertainty within our model. All layers are provided at a 1 km resolution. Methods: These layers were developed using a species distribution model described in Thompson et al. 2023. This model integrates data from three fisheries-independent surveys: the Fisheries and Oceans Canada (DFO) Groundfish Synoptic Bottom Trawl Surveys (Sinclair et al. 2003; Anderson et al. 2019), the DFO Groundfish Hard Bottom Longline Surveys (Lochead and Yamanaka 2006, 2007; Doherty et al. 2019), and the International Pacific Halibut Commission Fisheries Independent Setline Survey (IPHC 2021). Further details on the methods are found in the metadata PDF available with the dataset. Abstract from Thompson et al. 2023: Predictions of the distribution of groundfish species are needed to support ongoing marine spatial planning initiatives in Canadian Pacific waters. Data to inform species distribution models are available from several fisheries-independent surveys. However, no single survey covers the entire region and different gear types are required to survey the range of habitats that are occupied by groundfish. Bottom trawl gear is used to sample soft bottom habitat, predominantly on the continental shelf and slope, whereas longline gear often focuses on nearshore and hardbottom habitats where trawling is not possible. Because data from these two gear types are not directly comparable, previous species distribution models in this region have been limited to using data from one survey at a time, restricting their spatial extent and usefulness at a regional scale. Here we demonstrate a method for integrating presence-absence data across surveys and gear types that allows us to predict the coastwide distributions of 66 groundfish species in British Columbia. Our model leverages the use of available data from multiple surveys to estimate how species respond to environmental gradients while accounting for differences in catchability by the different surveys. Overall, we find that this integrated method has two main benefits: 1) it increases the accuracy of predictions in data-limited surveys and regions while having negligible impacts on the accuracy when data are already sufficient to make predictions, 2) it reduces uncertainty, resulting in tighter confidence intervals on predicted species occurrences. These benefits are particularly relevant in areas of our coast where our understanding of habitat suitability is limited due to a lack of spatially comprehensive long-term groundfish research surveys. Data Sources: Research data was provided by Pacific Science’s Groundfish Data Unit for research surveys from the GFBio database between 2003 and 2020 for all species which had at least 150 observations, across all gear type and survey datasets available. Uncertainties: These are modeled results based on species observations at sea and their related environmental covariate predictions that may not always accurately reflect real-world groundfish distributions though methods that integrate different data types/sources have been demonstrated to improve model inference by increasing the accuracy of the predictions and reducing uncertainty.
-

Fisheries and Oceans Canada (DFO) conducts research and undertakes monitoring surveys of the marine and freshwater environment in support of sustainable fisheries, healthy aquatic ecosystems and living resources, and safe and effective marine services. In an effort to effectively inform and ensure Canadians feel engaged in the delivery of its science mandate, DFO produces Fieldnotes, an annual compendium of planned science field operations in the North Pacific and Arctic oceans, as well as in the coastal and interior waters of British Columbia and Yukon.
-

The Fieldnotes dataset represents the anticipated locations of DFO Science field operations for 2022-2023 in the North Pacific and Arctic oceans, as well as in the coastal and interior waters of British Columbia and the Yukon.
-
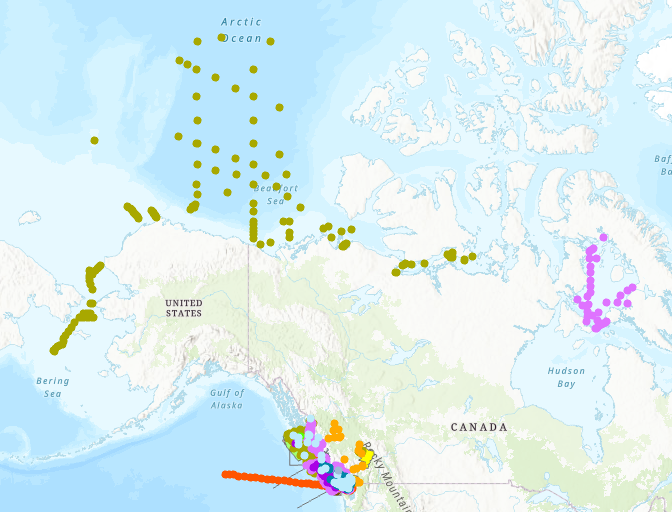
The Fieldnotes dataset represents anticipated locations of science field research and monitoring to be conducted throughout the year by Fisheries and Oceans Canadas' Pacific Science team and collaborators in the Northeast Pacific and Arctic oceans, and in the coastal and interior waters of British Columbia and Yukon.
-
The Fieldnotes dataset represents the anticipated locations of DFO Science field operations in the North Pacific and Arctic oceans, as well as in the coastal and interior waters of British Columbia and the Yukon.
-

This collection is a legacy product that is no longer supported. It may not meet current government standards. This inventory presents chronologically the satellite images acquired, orthorectified and published over time by Natural Resources Canada. It is composed of imagery from the Landsat7 (1999-2003) and RADARSAT-1 (2001-2002) satellites, as well as the CanImage by-product and the control points used to process the images. Landsat7 Orthorectified Imagery: The orthoimage dataset is a complete set of cloud-free (less than 10%) orthoimages covering the Canadian landmass and created with the most accurate control data available at the time of creation. RADARSAT-1 Orthorectified Imagery: The 5 RADARSAT-1 images (processed and distributed by RADARSAT International (RSI) complete the landsat 7 orthoimagery coverage. They are stored as raster data produced from SAR Standard 7 (S7) beam mode with a pixel size of 15 m. They have been produced in accordance with NAD83 (North American Datum of 1983) using the Universal Transverse Mercator (UTM) projection. RADARSAT-1 orthoimagery were produced with the 1:250 000 Canadian Digital Elevation Data (CDED) and photogrammetric control points generated from the Aerial Survey Data Base (ASDB). CanImage -Landsat7 Orthoimages of Canada,1:50 000: CanImage is a raster image containing information from Landsat7 orthoimages that have been resampled and based on the National Topographic System (NTS) at the 1:50 000 scale in the UTM projection. The product is distributed in datasets in GeoTIFF format. The resolution of this product is 15 metres. Landsat7 Imagery Control Points: the control points were used for the geometric correction of Landsat7 satellite imagery. They can also be used to correct vector data and for simultaneously displaying data from several sources prepared at different scales or resolutions.
-
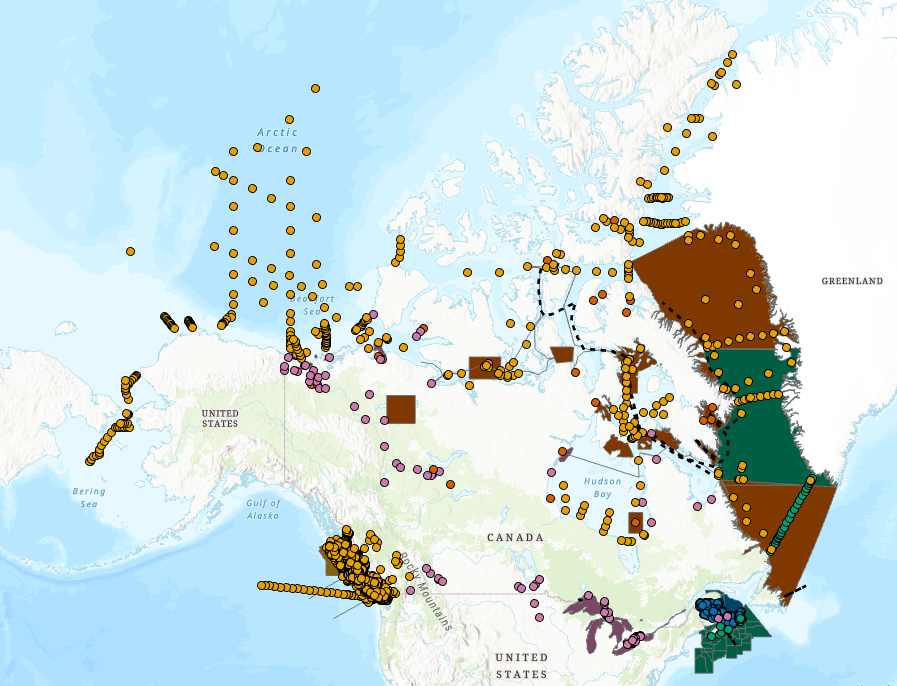
The Fieldnotes dataset provides information about science field work to be conducted each year by Fisheries and Oceans Canada (DFO) and collaborators. Field work takes place in the Pacific, Arctic and Atlantic Oceans, as well as the freshwater bodies of participating DFO Regions: Pacific, Arctic, Ontario and Prairie, Maritimes, and Gulf.
-

The Fieldnotes dataset represents the anticipated locations of DFO Science field operations for 2021-2022 in the North Pacific and Arctic oceans, as well as in the coastal and interior waters of British Columbia and the Yukon.