 Arctic SDI catalogue
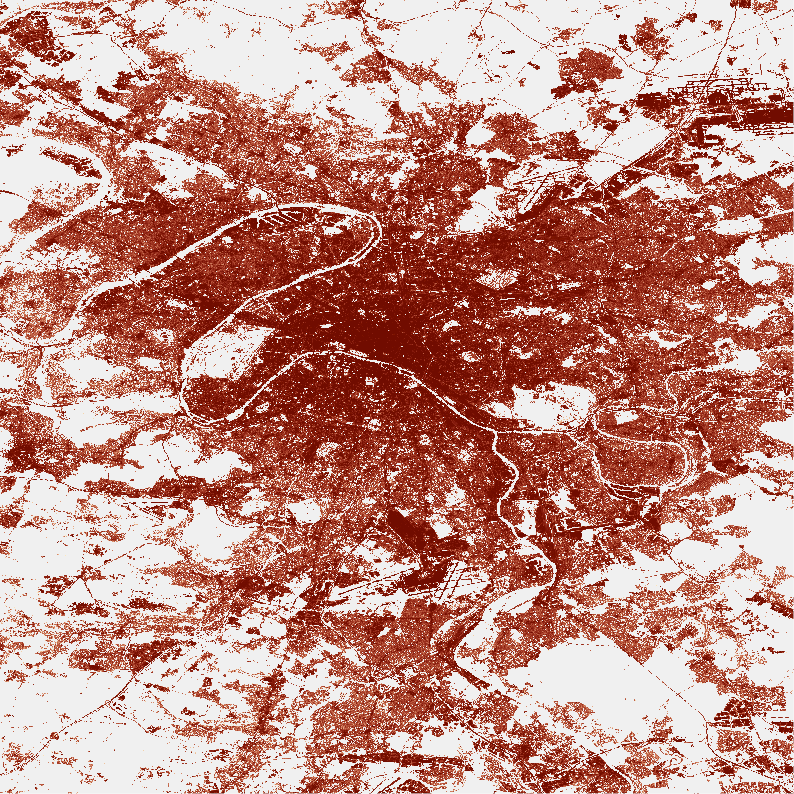
built-up area
Type of resources
Available actions
Topics
Keywords
Contact for the resource
Provided by
Years
Formats
Resolution
-

The Imperviousness Change (IMDC) 2018-2021 layer is part of the High Resolution Layer (HRL) Imperviousness. It contains the imperviousness change per pixel (increase or decrease in percentage) as derived from the difference between the Imperviousness Density (IMD) status layers for the reference years 2018 and 2021, in an aggregated version of 100m spatial resolution. The production of the HRL Imperviousness is coordinated by EEA in the frame of Copernicus, the Earth observation component of the European Union’s Space programme. The product is a raster dataset with 100-meter grid spacing (spatial resolution) that covers the 38 Eionet member and cooperating countries as well as the United Kingdom (i.e. EEA38+UK). It is distributed as 100 x 100 km tiles that are fully conformant with the EEA reference grid.
-
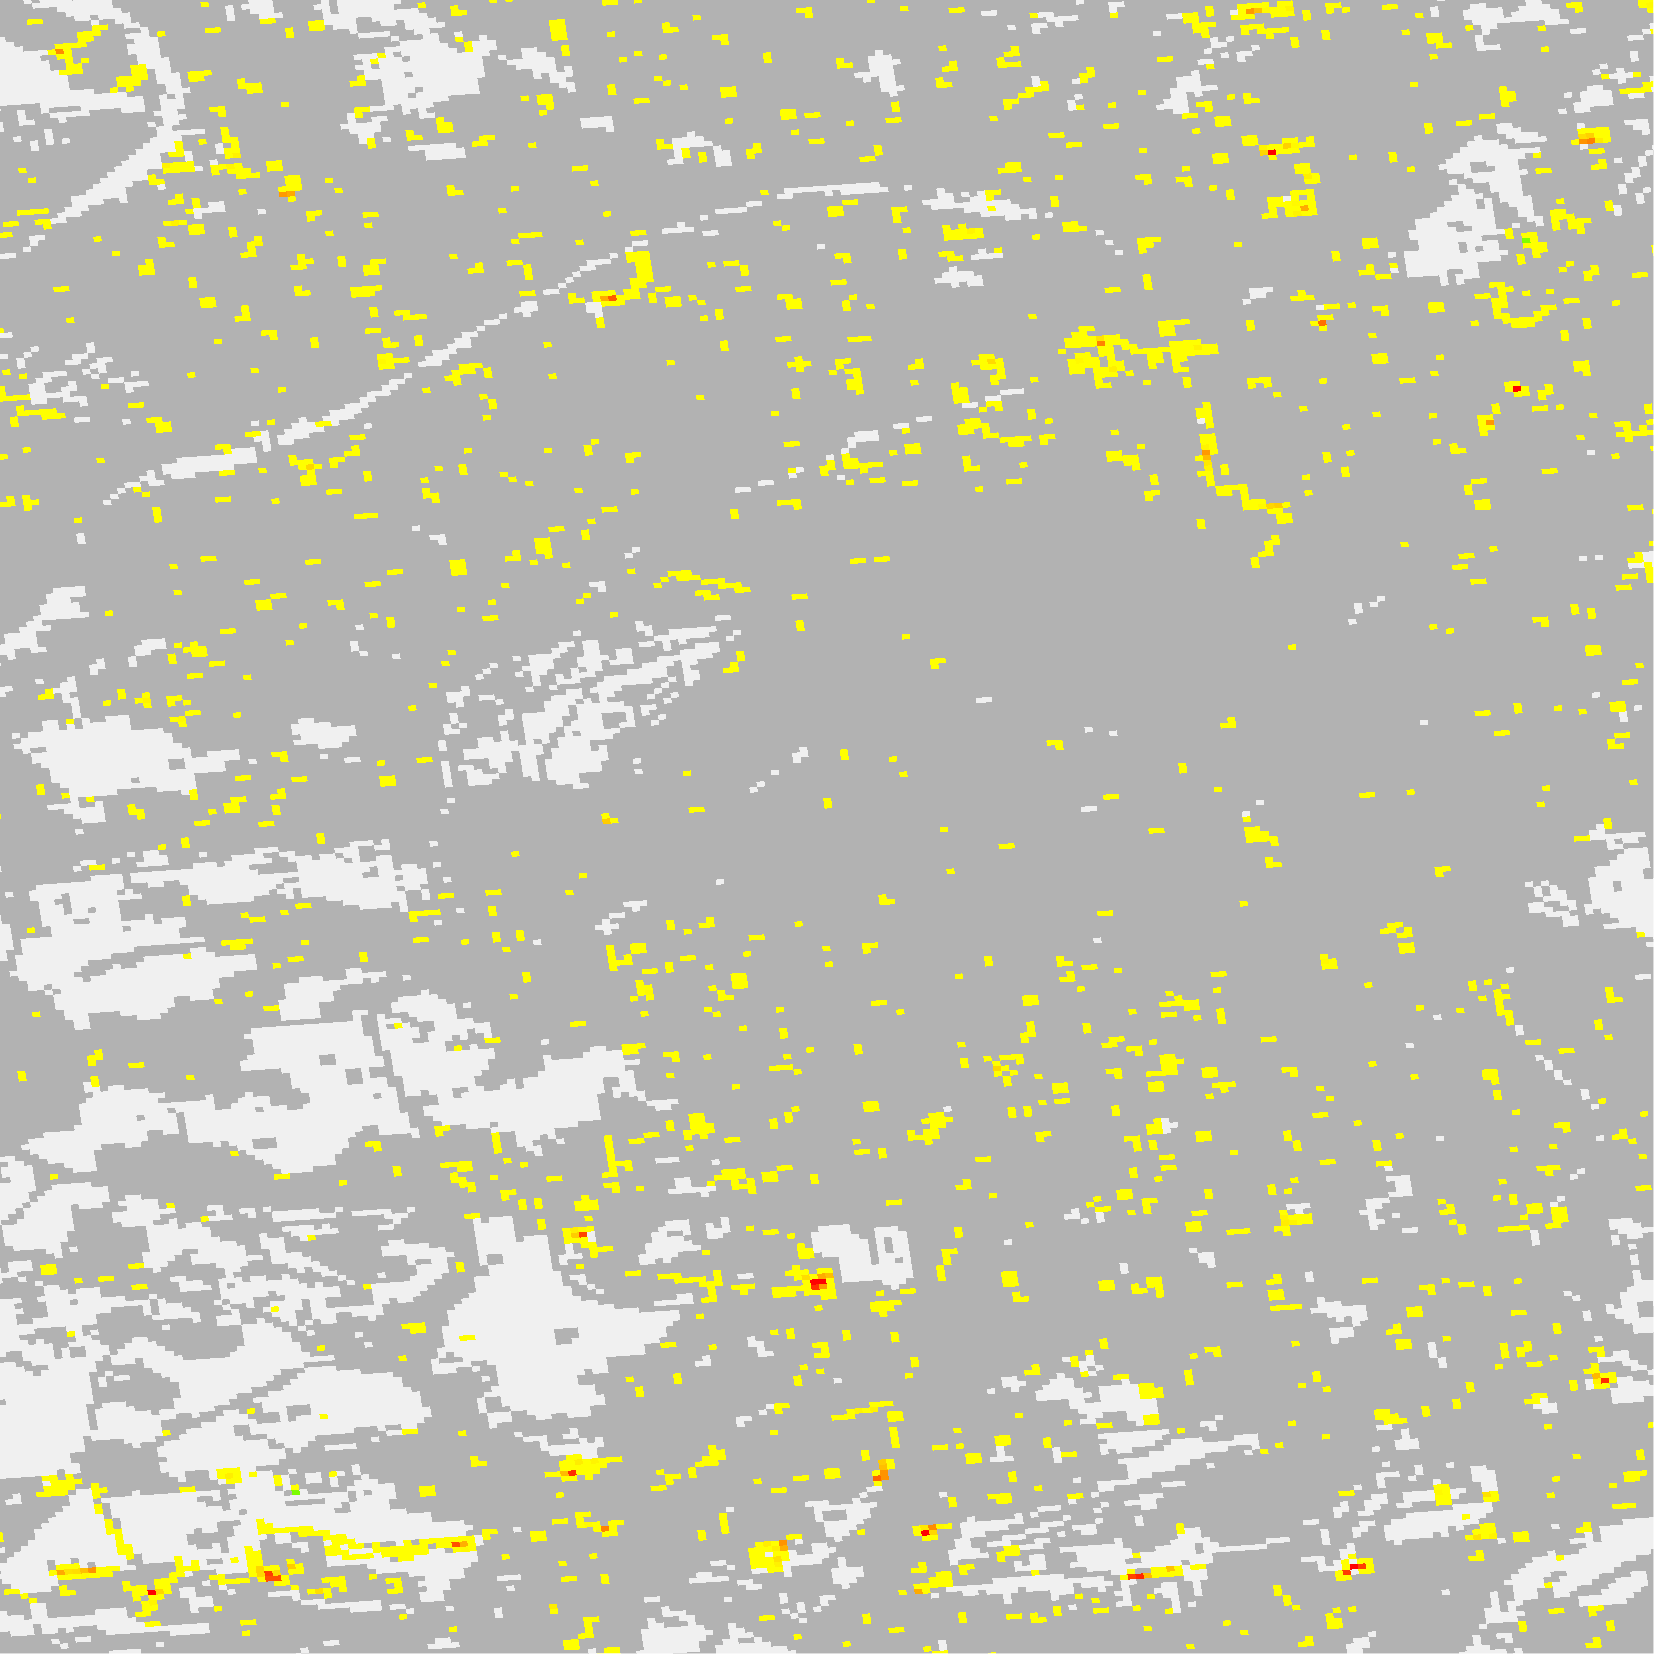
The Imperviousness Change (IMDC) 2021-2024 layer is part of the High Resolution Layer (HRL) Imperviousness. It contains the imperviousness change per pixel (increase or decrease in percentage) as derived from the difference between the Imperviousness Density (IMD) status layers for the reference years 2021 and 2024, in an aggregated version of 100m spatial resolution. The production of the HRL Imperviousness is coordinated by EEA in the frame of Copernicus, the Earth observation component of the European Union’s Space programme. The product is a raster dataset with 100-meter grid spacing (spatial resolution) that covers the 38 Eionet member and cooperating countries as well as the United Kingdom (i.e. EEA38+UK). It is distributed as 100 x 100 km tiles that are fully conformant with the EEA reference grid.
-
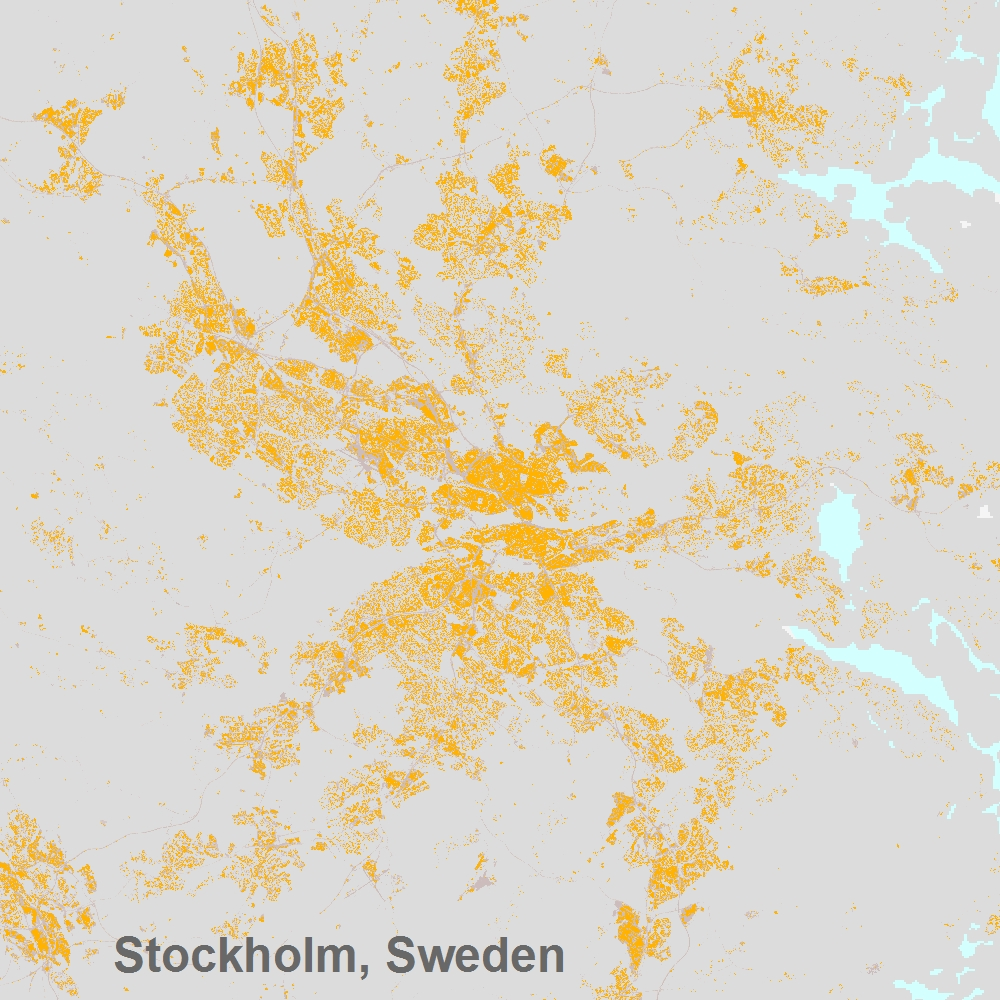
The Share of Built-up (SBU) layer for the reference year 2018 represents share (percentage) of built-up (IBU) for the reference year 2018 in an aggregated version of 100m spatial resolution for the EEA38 countries and the United Kingdom. The production of the high resolution imperviousness layers is coordinated by the EEA in the frame of the EU Copernicus programme. The high resolution imperviousness products capture the percentage and change of soil sealing. Built-up areas are characterized by the substitution of the original (semi-) natural land cover or water surface with an artificial, often impervious cover. These artificial surfaces are usually maintained over long periods of time. A series of high resolution imperviousness datasets (for the 2006, 2009, 2012, 2015 and 2018 reference years) with all artificially sealed areas was produced using automatic derivation based on calibrated Normalized Difference Vegetation Index (NDVI). This series of imperviousness layers constitutes the main status layers. They are per-pixel estimates of impermeable cover of soil (soil sealing) and are mapped as the degree of imperviousness (0-100%). Imperviousness change layers were produced as a difference between the reference years (2006-2009, 2009-2012, 2012-2015, 2015-2018 and additionally 2006-2012, to fully match the CORINE Land Cover production cycle) and are presented 1) as degree of imperviousness change (-100% -- +100%), in 20m and 100m pixel size, and 2) a classified (categorical) 20m change product. The 100 meter aggregate raster (fully conformant with the EEA reference grid) is provided as a full EEA38 and United Kingdom mosaic.
-
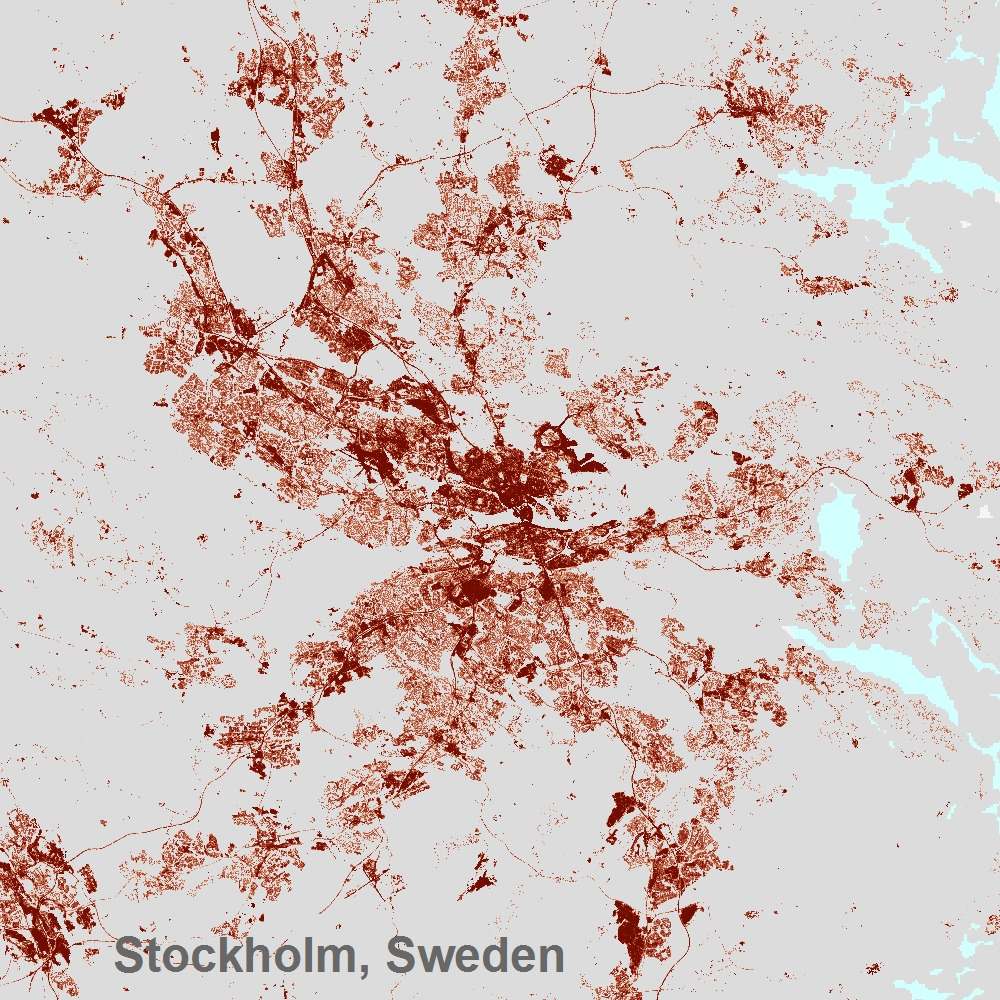
The High Resolution Layer on Imperviousness Density 2018 is a thematic product showing the sealing density in the range from 0-100% for the period 2018 (including data from 2017-2019) for the EEA-38 area and the United Kingdom. The production of the high resolution imperviousness layers is coordinated by EEA in the frame of the EU Copernicus programme. The high resolution imperviousness products capture the percentage and change of soil sealing. Built-up areas are characterized by the substitution of the original (semi-) natural land cover or water surface with an artificial, often impervious cover. These artificial surfaces are usually maintained over long periods of time. A series of high resolution imperviousness datasets (for the 2006, 2009, 2012, 2015 and 2018 reference years) with all artificially sealed areas was produced using automatic derivation based on calibrated Normalized Difference Vegetation Index (NDVI). This series of imperviousness layers constitutes the main status layers. They are per-pixel estimates of impermeable cover of soil (soil sealing) and are mapped as the degree of imperviousness (0-100%). Imperviousness change layers were produced as a difference between the reference years (2006-2009, 2009-2012, 2012-2015, 2015-2018 and additionally 2006-2012, to fully match the CORINE Land Cover production cycle) and are presented 1) as degree of imperviousness change (-100% -- +100%), in 20m and 100m pixel size, and 2) a classified (categorical) 20m change product. Data is provided as 10 meter rasters (fully conformant with the EEA reference grid) in 100 x 100 km tiles grouped according to the EEA38 countries and the United Kingdom.
-

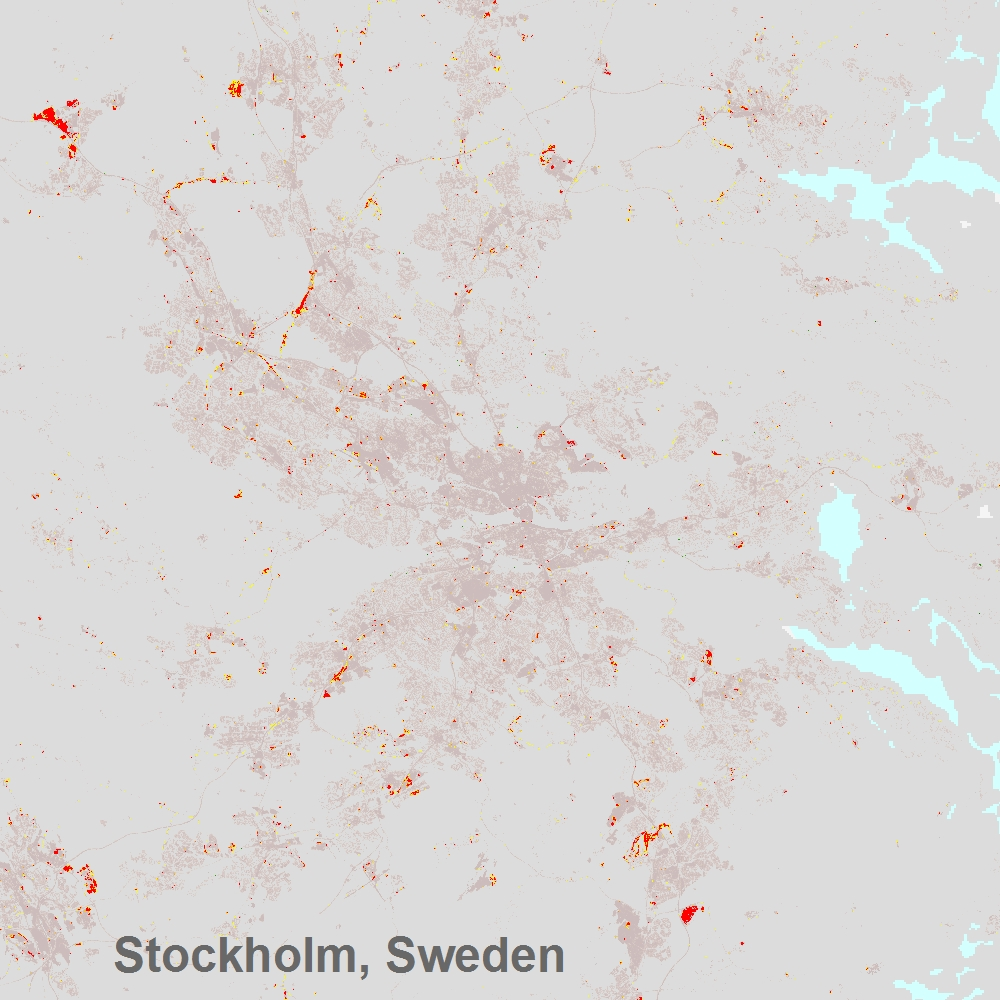
The Impervious Built-Up Change (IBUC) 2018-2021 layer is part of the High Resolution Layer (HRL) Imperviousness and provides categorical information on the change of built-up per pixel as derived from the difference between the Impervious Built-Up (IBU) status layers for the reference years 2018 and 2021. The production of the HRL Imperviousness is coordinated by EEA in the frame of Copernicus, the Earth observation component of the European Union’s Space programme. The product is a raster dataset with 20-meter grid spacing (spatial resolution) that covers the 38 Eionet member and cooperating countries as well as the United Kingdom (i.e. EEA38+UK). It is distributed as 100 x 100 km tiles that are fully conformant with the EEA reference grid.
-

The Share of Built-Up (SBU) 2021 is part of the High Resolution Layer (HRL) Imperviousness and contains the share (percentage) of built-up per pixel for the reference year 2021 as derived from a pixel aggregation of the binary Impervious Built-Up (IBU) 2021 layer. The production of the HRL Imperviousness is coordinated by EEA in the frame of Copernicus, the Earth observation component of the European Union’s Space programme. The product is a raster dataset with 100-meter grid spacing (spatial resolution) that covers the 38 Eionet member and cooperating countries as well as the United Kingdom (i.e. EEA38+UK). It is distributed as 100 x 100 km tiles that are fully conformant with the EEA reference grid.
-
The High Resolution Layer Imperviousness Change (IMC) 2015-2018 is a 20m raster dataset showing change in imperviousness between 2015 and 2018 reference years, produced in the frame of the EU Copernicus programme. The high resolution imperviousness products capture the percentage and change of soil sealing. Built-up areas are characterized by the substitution of the original (semi-) natural land cover or water surface with an artificial, often impervious cover. These artificial surfaces are usually maintained over long periods of time. A series of high resolution imperviousness datasets (for the 2006, 2009, 2012, 2015 and 2018 reference years) with all artificially sealed areas was produced using automatic derivation based on calibrated Normalized Difference Vegetation Index (NDVI). This series of imperviousness layers constitutes the main status layers. They are per-pixel estimates of impermeable cover of soil (soil sealing) and are mapped as the degree of imperviousness (0-100%). Imperviousness change layers were produced as a difference between the reference years (2006-2009, 2009-2012, 2012-2015, 2015-2018 and additionally 2006-2012, to fully match the CORINE Land Cover production cycle) and are presented 1) as degree of imperviousness change (-100% -- +100%), in 20m and 100m pixel size, and 2) a classified (categorical) 20m change product. This dataset is provided as 20 meter rasters (fully conformant with EEA reference grid) in 100 x 100 km tiles grouped according to the EEA38 countries and the United Kingdom.
-
The Imperviousness Density (IMD) 2024 layer is part of the High Resolution Layer (HRL) Imperviousness and contains the approximate density of artificial sealing per pixel (range: 0-100%) for the reference year 2024 as derived from Sentinel-2 image time series. The production of the HRL Imperviousness is coordinated by EEA in the frame of Copernicus, the Earth observation component of the European Union’s Space programme. The product is a raster dataset with 10-meter grid spacing (spatial resolution) that covers the 38 Eionet member and cooperating countries as well as the United Kingdom (i.e. EEA38+UK). It is distributed as 100 x 100 km tiles that are fully conformant with the EEA reference grid.
-

The Share of Built-Up Change Classified (SBCC) 2018-2021 layer is part of the High Resolution Layer (HRL) Imperviousness and provides categorical information on the change of built-up per pixel between the reference years 2018 and 2021 as derived from a re-classification of the Share of Built-Up Change (IMDC) 2021–2018 layer. The production of the HRL Imperviousness is coordinated by EEA in the frame of Copernicus, the Earth observation component of the European Union’s Space programme. The product is a raster dataset with 100-meter grid spacing (spatial resolution) that covers the 38 Eionet member and cooperating countries as well as the United Kingdom (i.e. EEA38+UK). It is distributed as 100 x 100 km tiles that are fully conformant with the EEA reference grid.
-

The Impervious Built-Up (IBU) 2024 layer is part of the High Resolution Layer (HRL) Imperviousness and provides binary information of built-up areas (class 1) and non built-up areas (class 0) for the reference year 2024 as derived from Sentinel-2 image time series. The production of the HRL Imperviousness is coordinated by EEA in the frame of Copernicus, the Earth observation component of the European Union’s Space programme. The product is a raster dataset with 10-meter grid spacing (spatial resolution) that covers the 38 Eionet member and cooperating countries as well as the United Kingdom (i.e. EEA38+UK). It is distributed as 100 x 100 km tiles that are fully conformant with the EEA reference grid.