From 1 - 10 / 12
  • Categories  

    Average grid cell density is a polygon feature class containing the average density value for each grid cell per species/groups and season.

  • Categories  

    This polygon outlines the basic area included in the survey counts. This area is the best approximation of the mudflat that can be surveyed from shore and is exposed at tide tide height of 3.5 m, based on tidal predictions at Point Atkinson, British Columbia.

  • Categories  

    Grids surveyed is a polygon feature class containing the 5’ latitude by 5’ longitude grid cells surveyed for all seasons combined including the grids that were surveyed but where no species were seen. In order to produce maps for a specific season a selection for these grids must be performed.

  • Surveyor shorebird bird observations and counts for all years.

  • Categories  

    Survey points is a point feature class containing transects and observations completed in 2011.

  • Categories  

    Survey transects is a line feature class containing transects completed in 2011.

  • Categories  

    Sidney Island Shorebird Surveys transects area feature.

  • Categories  

    Survey areas is a polygon feature class containing mudflats and staging areas observed for shorebirds.

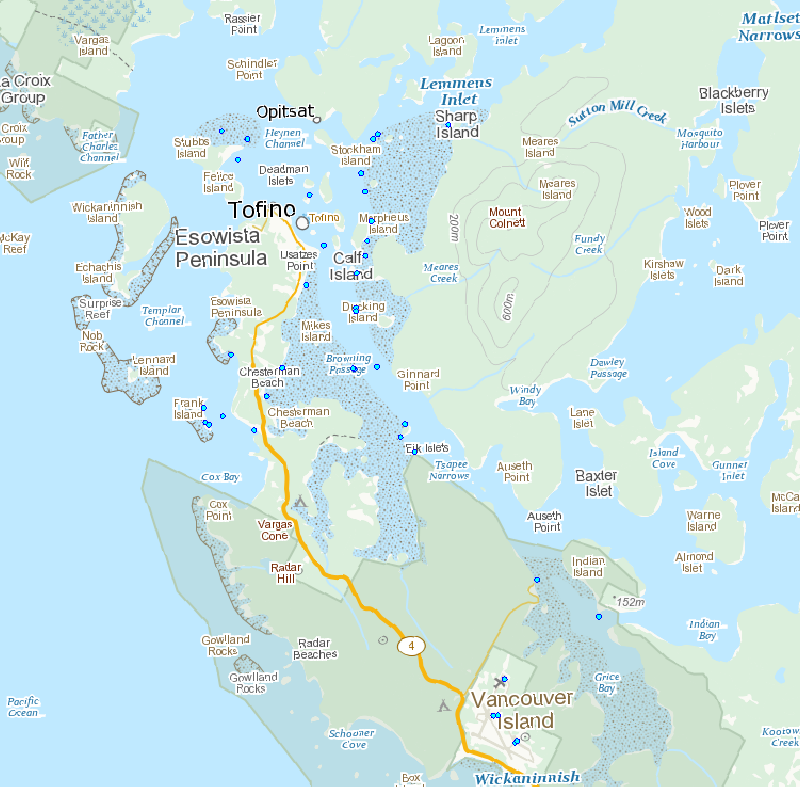
  • These shorebird surveys are conducted intermittently at a series of sites near the town of Tofino on the west coast of Vancouver Island, British Columbia, during northward (April to May) and southward migration (July to November). This survey includes all shorebird species. Surveyors used binoculars or a spotting scope to count the total number of shorebirds present within the natural boundaries of each survey site during the northward and/or southward migration periods. They used a boat to count birds within the entire area of Arakun Flats and Ducking Flats by traveling along the outer edge of the mudflats, and by stopping at standardized vantage points on land. They also used a boat to view as much area as possible within Maltby Slough, South Bay and Grice Bay from the openings to each of these bays. Surveyors walked the entire length of Chesterman Beach including the tombolo to Frank Island. Surveys were done at least twice a week at each site. Most boat surveys began at low tide when the mudflats were exposed and continued on the rising tide. Road accessible sites were usually surveyed during the hour before high tide or at high tide in 2011. Surveys were not conducted in weather that reduced visibility or made boat travel unsafe (heavy rain or high wind). Surveyors counted birds individually when they were within flocks of fewer than 200 birds. They estimated the size of larger flocks by counting 50 or 100 birds and then judged how many similar-sized groups made up the entire flock. Distant flocks were recorded as small or large shorebirds and assumed to have the same species composition as those closer to shore in 1995 or identified to species group and recorded as either “dowitchers” or “peeps” in 2011.