 Arctic SDI catalogue
Species
Type of resources
Available actions
Topics
Keywords
Contact for the resource
Provided by
Years
Formats
Representation types
Update frequencies
status
Service types
-
-
-
-
#abstract#
-
Distribution of species of community interest is a product of species and habitat surveillance under the obligations of Article 17 of EU Habitats Directive (92/43/ EEC). The species grid distribution (EEA reference grid 1 x 1 km) from data of species reports 2013 is presented. For detailed description and commentary see CHOBOT, K. (ed.) (2016). Druhy a přírodní stanoviště: Hodnotící zprávy o stavu v České republice. Praha: Agentura ochrany přírody a krajiny ČR a Ministerstvo životního prostředí. 226 s. ISBN 978-80-88076-20-9; NCA CR (AOPK ČR), 2013
-

Data on trees belonging to the municipality, referred to as “public domain”: street and off-street trees (parks and public squares). Please note that in many cases, the City's data on the spatial location of trees may be inaccurate or out of date. In addition, in some boroughs, park trees are not indicated.**This third party metadata element was translated using an automated translation tool (Amazon Translate).**
-
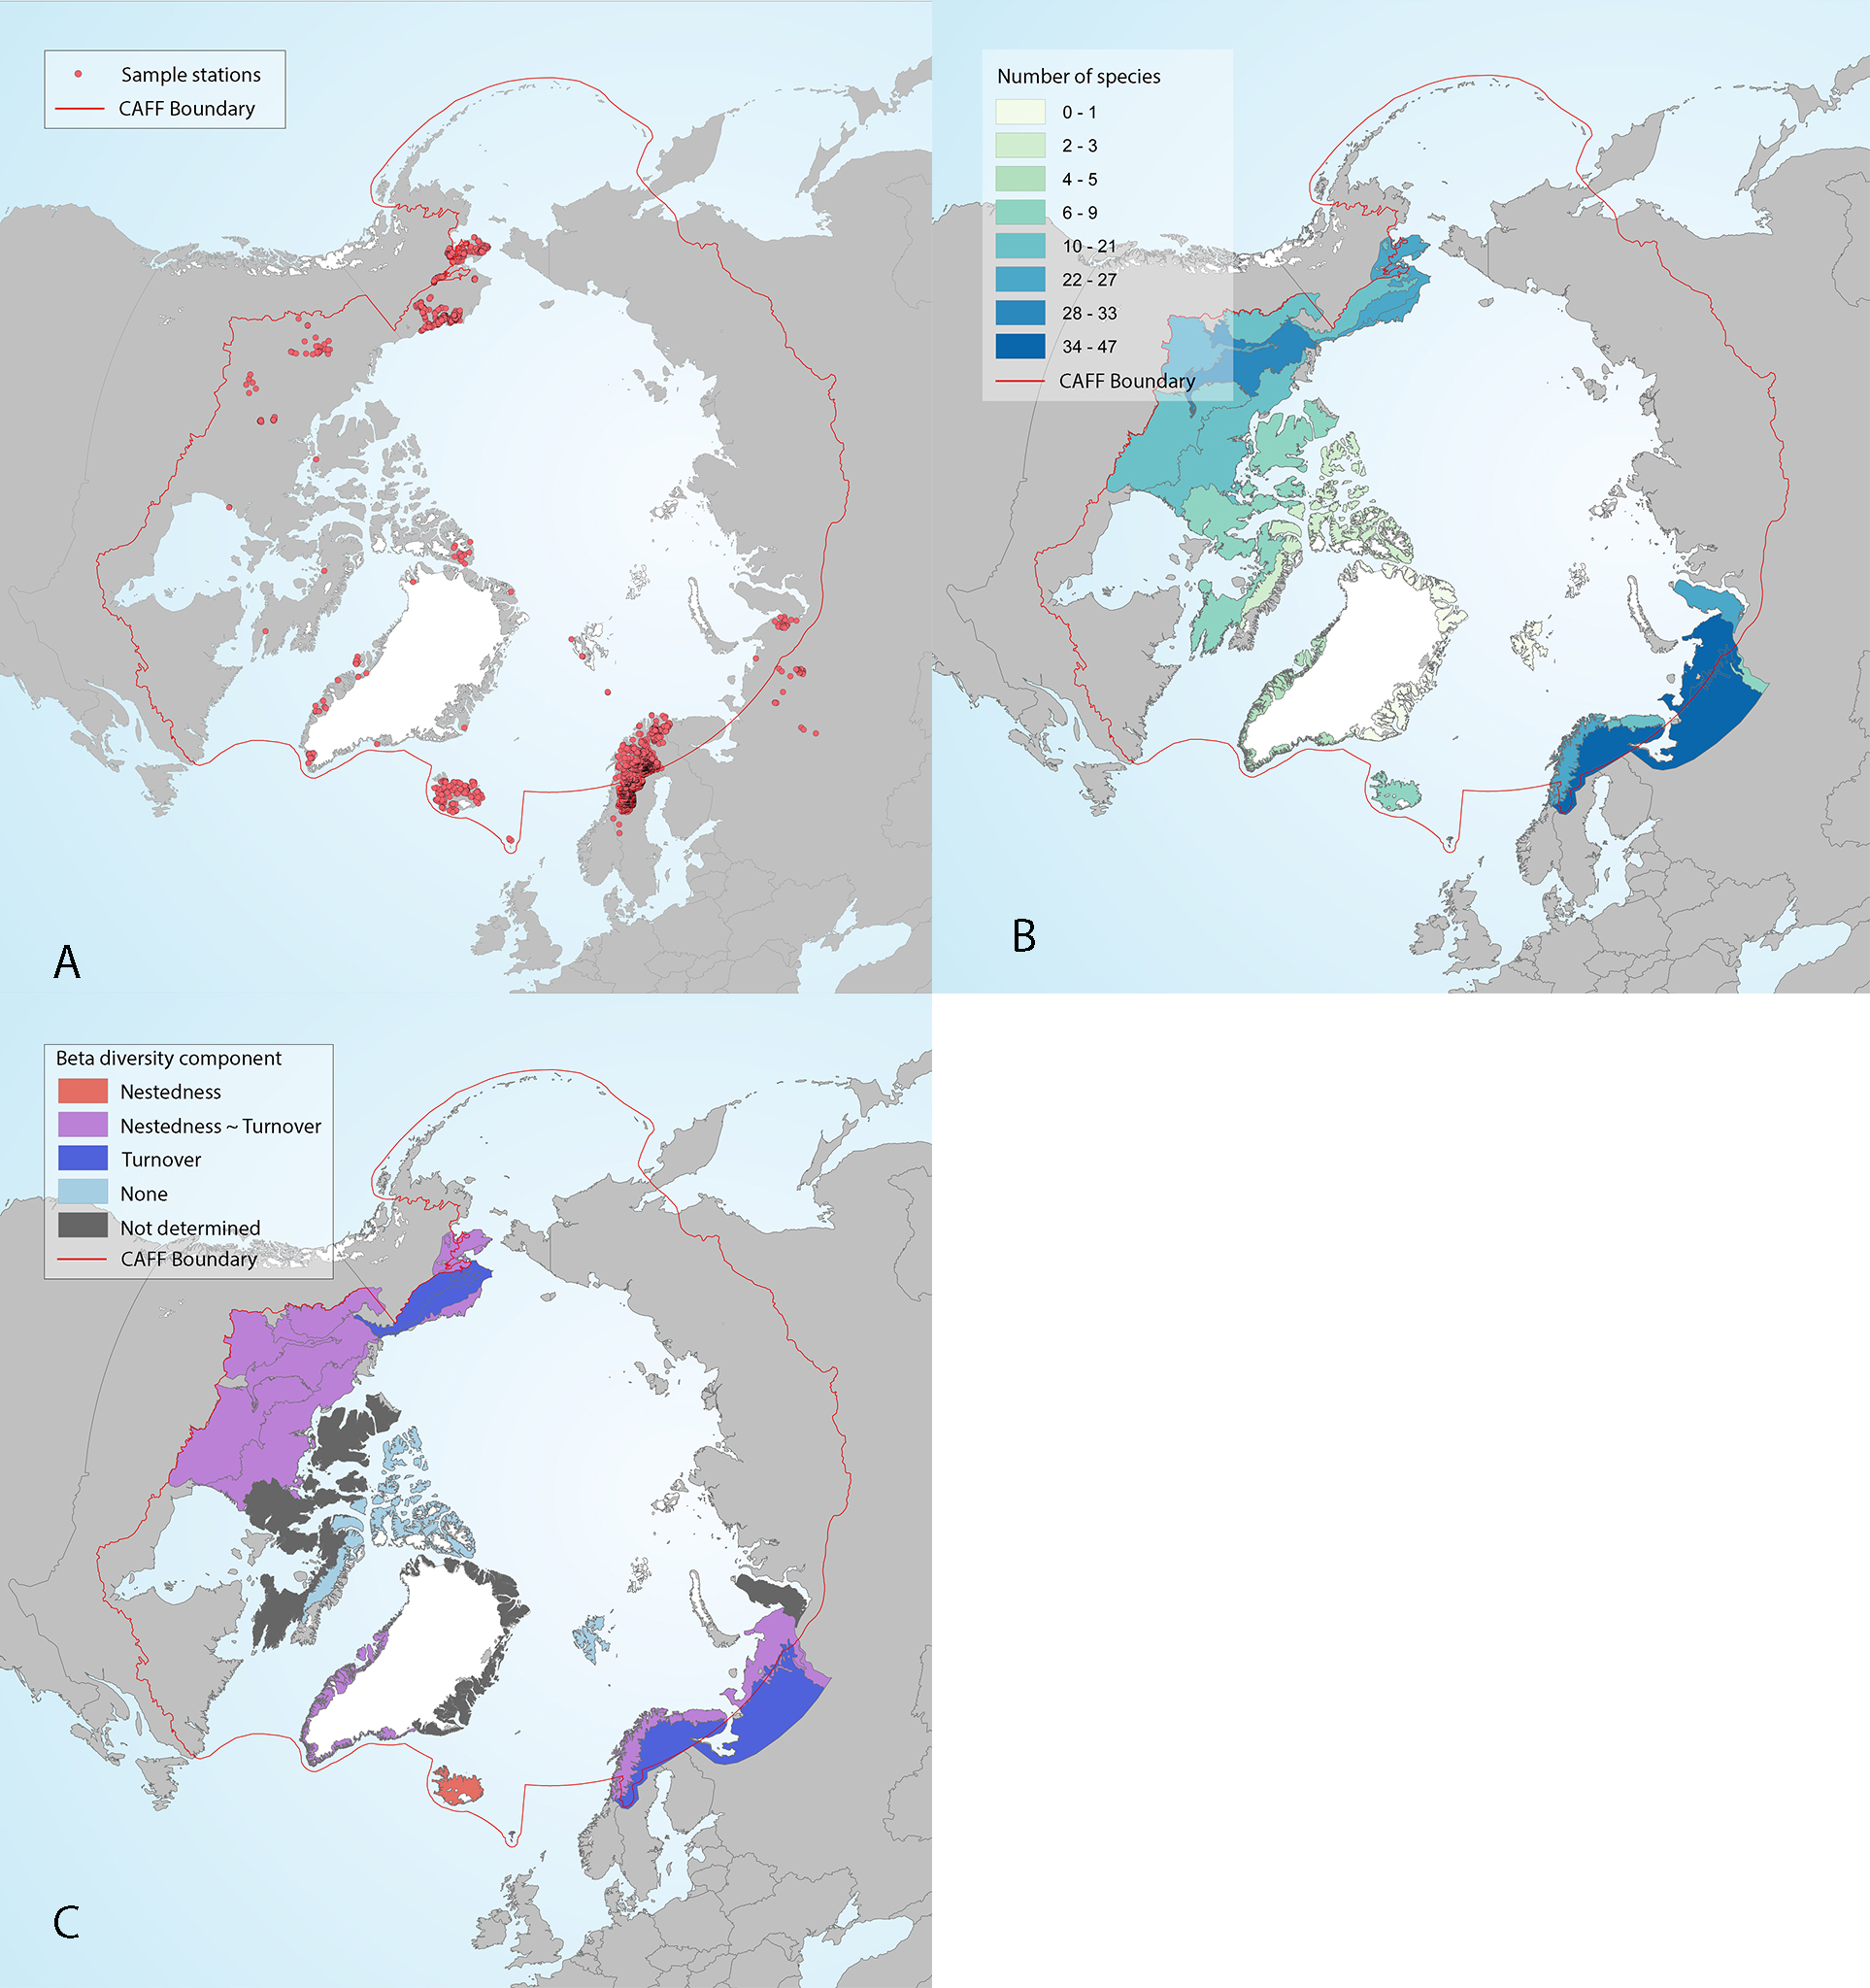
Figure 4 -36 Freshwater fish sampling stations (A), ecoregion alpha diversity in each of the sampled ecoregions, as quantified by estimates of species richness from reference texts (Muus and Dahlstrøm 1971, Scott and Crossman 1973, Mecklenburg et al. 2002) and expert knowledge (academic and government scientists and traditional knowledge) (B), and ecoregion beta diversity (C) characterized according to components of beta diversity as either nestedness, turnover, no diversity (none, beta = 0), or similar nestedness and turnover (nestedness ~ turnover) in the circumpolar Arctic. Ecoregions are shown only where sampling stations occur. Fish sampling stations included in this study assessed complete fish assemblages at each location. State of the Arctic Freshwater Biodiversity Report - Chapter 4 - Page 74 - Figure 4-36
-

## Information document concerning the results of the threat analysis This document provides additional information to better understand and use the threat data produced as part of the integrated recovery approach. This data highlights the sectors where the impacts of threats on occurrences listed by the [Quebec Natural Heritage Data Center (CDPNQ)] (https://www.quebec.ca/gouvernement/gouvernement-ouvert/transparence-performance/indicateurs-statistiques/donnees-especes-situation-precaire) are the most important. # #Quelles data included in the analyses? The analyses focus on the following 67 elements (wildlife species): * Amphibians: swamp frog, boreal chorus frog, western chorus frog, western chorus frog, purple salamander, Adirondack and Appalachian pop., mountain dusky salamander, mountain dusky salamander, mountain dusky salamander, mountain dusky salamander, mountain dusky salamander, mountain dusky salamander, mountain dusky salamander, mountain dusky salamander, mountain dusky salamander, mountain dusky salamander, mountain dusky salamander, mountain dusky salamander, mountain dusky salamander, mountain dusky salamander, mountain dusky salamander, mountain * Insects: satyr tawny from the Maritimes * Mammals: pygmy weasel, rock vole, forest vole, forest vole, forest vole, Cooper lemming vole, northern bat, eastern pygmy bat, Gaspé shrew, longicaude shrew, longicaude shrew, little flying squirrel, little flying squirrel, pop. of the plains of the Great Lakes, small brown bat, eastern pipistrelle * Birds: golden eagle, diving harlequin, eastern pop., eastern pop., bunting grasshopper pratensis, Pratensis, grasshopper, rufa, peregrine falcon, Anatum/tundrius, Iceland tourniquet, eastern pop., eastern pop., eastern pop., Bicknell's thrush, Bicknell's thrush, horned grebe, black tern, short-eared owl, shore swallow, chimney swift, eastern pop., eastern pop., Bicknell's thrush, thrush of Bicknell, thrush, horned grebe, black tern, short-eared owl, shore swallow, chimney swift, eastern pop. White-tailed Plover, Cerulean Warbler, Golden-winged Warbler, Golden-winged Warbler, Lesser Bittern, Melodus Piping Plover, Bald Eagle, Yellow Rail, Yellow Rail, Roseate Tern * Fish: savory shad, mesh pike, vermiculated pike, vermiculated pike, crazy cat-rapids, copper redhorse, river redhorse, northern crappy, sand stinger, lake sturgeon, black sturgeon, black sturgeon, black sturgeon, black sturgeon, Atlantic sturgeon, Atlantic sturgeon, black sturgeon, Atlantic sturgeon, black sturgeon, Atlantic sturgeon, black sturgeon, Atlantic sturgeon, Atlantic sturgeon, black sturgeon, gray rock digger, rock darter, northern lamprey, northern lamprey, grass minnow, brass minnow, oquassa arctic char, rainbow smelt, southern pop. of St. Lawrence Estuary * Reptiles: brown snake, northern water snake, northern ribbonsnake, northern ribbonsnake, spotted snake, green snake, northern collared snake, wood turtle, geographic turtle, geographic turtle, speckled turtle, speckled turtle, musky turtle, spiny softshell turtle Other species, including floristic species, could be added to the analyses. Threats: Threats are activities that, by their location, intensity, or time in which they occur, generate stress (see next section) that affects elements of biodiversity. In total, the available data concerns 16 threats: * Future conversion risk: Development of residential, industrial and commercial areas; * Ski resorts; * Future conversion risk: Annual agriculture (field crops); * Sustainable agriculture; * Quarries and sandpits; * Roads; * Total removal of forest cover; * Partial removal of forest cover; * Educational treatments; * Motorized vehicles; * Boating; * Drainage in agricultural areas; * Phragmites australis; * Rhamnus cathartica; * Increase in predation by mesopredators; * Nutrient load. # #Méthode for calculating the impact rating * The method used to calculate the impact score is presented in the document Integrated Recovery Approach for Threatened or Vulnerable Species — Development of a New Tool for Conservation Planning. * The results are presented using a map grid in which each 10 km x 10 km plot shows the cumulative impact of a threat on the occurrences present in this portion of territory. The cumulative impact is obtained by adding up the impact ratings of all the occurrences present within the plot. This accumulation makes it possible to identify, using a color code, the “hot spots” of a threat on occurrences. The absence of color indicates the absence of calculated or listed impacts on occurrences. The color gradient illustrates the variation in the cumulative impact of this threat on all occurrences in the plot, from the lowest score (yellow) to the highest (red). * Each threat is presented on a separate layer, while an additional layer called “Threat Compilation” shows the sum of the threats over all the occurrences present in a plot. # #Quelle is standardized classification used for analysis? The threats analyzed were defined according to the document Standardized Classification of Threats Affecting Biodiversity — Definitions for the Quebec Conservation Data Center (CDC) v1.0, published in 2021.**This third party metadata element was translated using an automated translation tool (Amazon Translate).**
-
Surveyor shorebird bird observations and counts for all years.