 Arctic SDI catalogue
/Concepción/CON06
Type of resources
Available actions
Topics
Keywords
Contact for the resource
Provided by
Years
Formats
Resolution
-

EMODnet Chemistry aims to provide access to marine chemistry data sets and derived data products concerning eutrophication, ocean acidification, contaminants and litter. The chosen parameters are relevant for the Marine Strategy Framework Directive (MSFD), in particular for descriptors 5, 8, 9 and 10. The dataset contains standardized, harmonized and validated data collections from beach litter (monitoring and other sources). Datasets concerning beach and seafloor litter data are loaded in a central database after a semi-automated validation phase. Once loaded, a data assessment is performed in order to check data consistency and potential errors are corrected thanks to a feedback loop with data originators. For beach litter, the harmonized datasets contain all unrestricted EMODnet Chemistry data on beach litter, including monitoring data, data from cleaning surveys and data from research. A relevant part of the monitoring data has been considered for assessment purposes by the European institutions and therefore is tagged as MSFD_monitoring. EMODnet beach litter data and databases are hosted and maintained by 'Istituto Nazionale di Oceanografia e di Geofisica Sperimentale, Division of Oceanography (OGS/NODC)' from Italy. Data are formatted following Guidelines and forms for gathering marine litter data, which can be found at: https://doi.org/10.6092/15c0d34c-a01a-4091-91ac-7c4f561ab508 The updated vocabularies of admitted values are available at: https://nodc.ogs.it/marinelitter/vocab The harmonized datasets can be downloaded as EMODnet Beach litter data format Version 7.0, which is a spreadsheet file composed of 4 sheets: beach metadata, survey metadata, animals and litter. Local_CDI field in the survey metadata sheet allows to retrieve the original data.
-
This visualization product displays the number of non-MSFD monitoring surveys, research & cleaning operations and the associated temporal coverage per beach. EMODnet Chemistry included the collection of marine litter in its 3rd phase. Since the beginning of 2018, data of beach litter have been gathered and processed in the EMODnet Chemistry Marine Litter Database (MLDB). The harmonization of all the data has been the most challenging task considering the heterogeneity of the data sources, sampling protocols and reference lists used on a European scale. Preliminary processing were necessary to harmonize all the data: - Exclusion of OSPAR 1000 protocol: in order to follow the approach of OSPAR that it is not including these data anymore in the monitoring; - Selection of surveys from non-MSFD monitoring, cleaning and research operations; - Exclusion of beaches without coordinates. More information is available in the attached documents. Warning: the absence of data on the map doesn't necessarily mean that they don't exist, but that no information has been entered in the Marine Litter Database for this area.
-
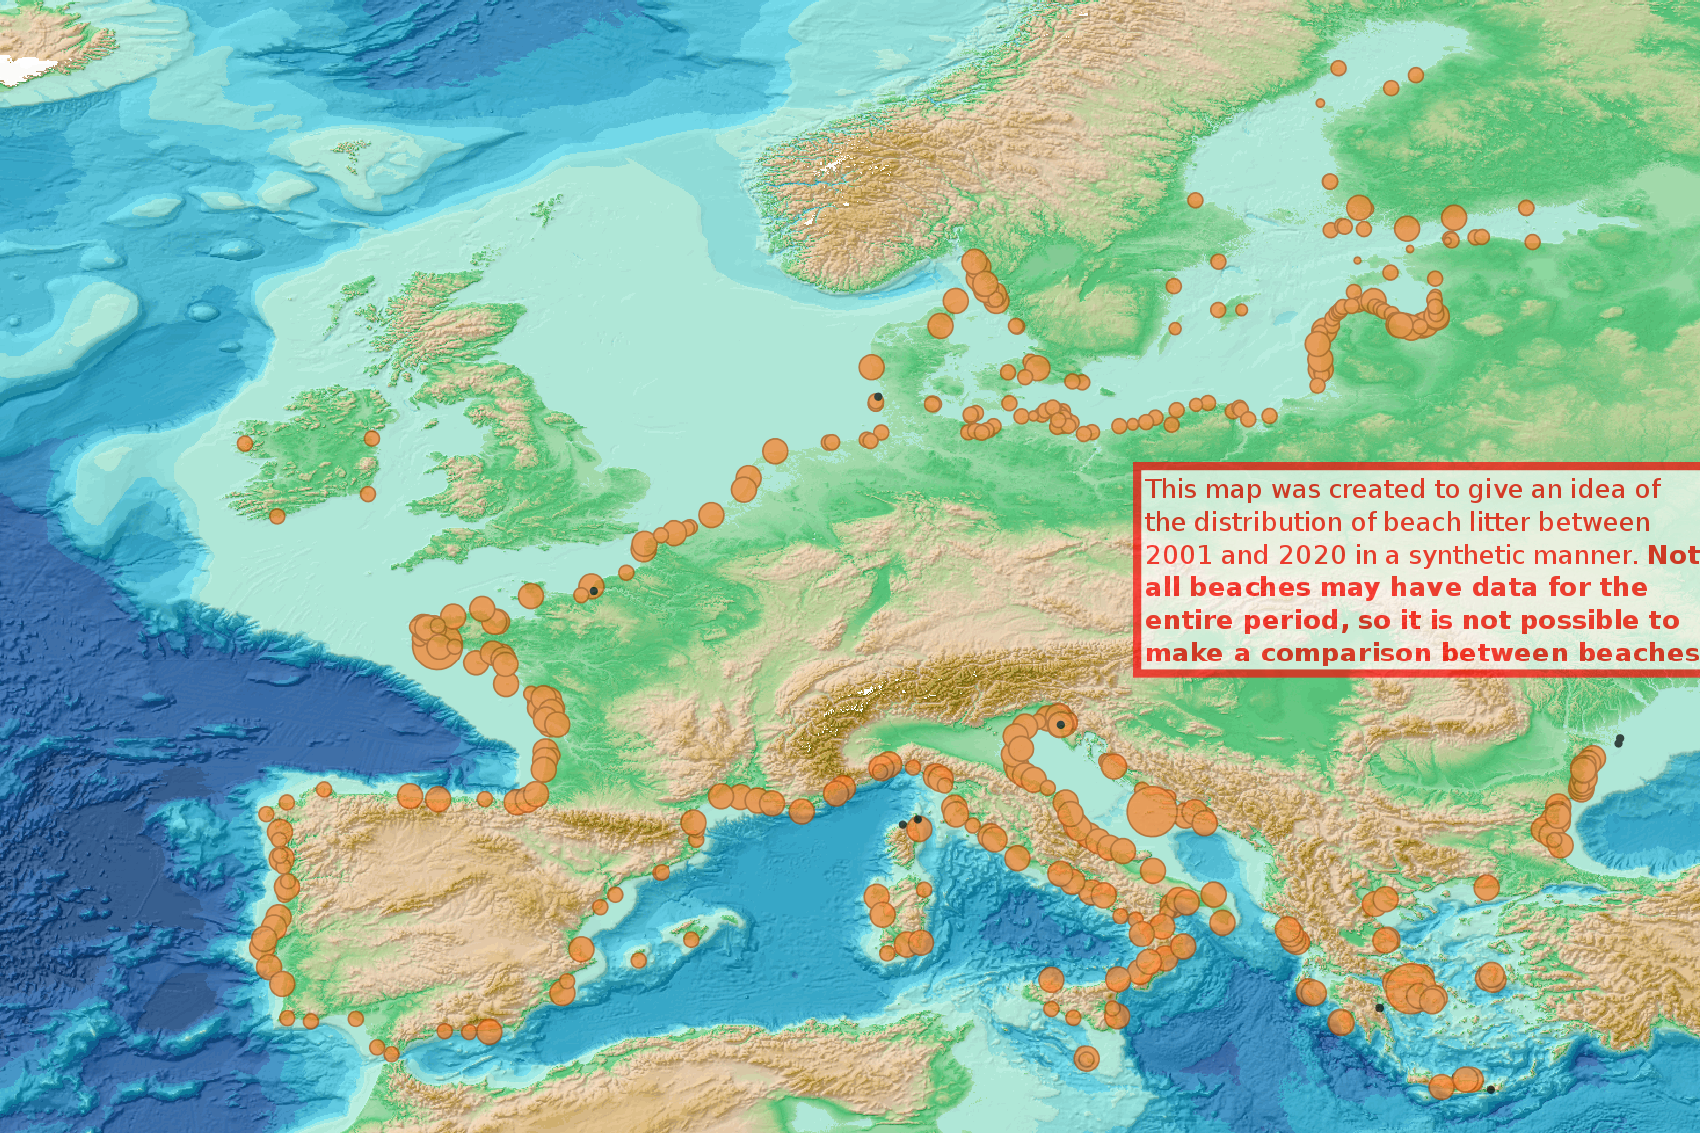
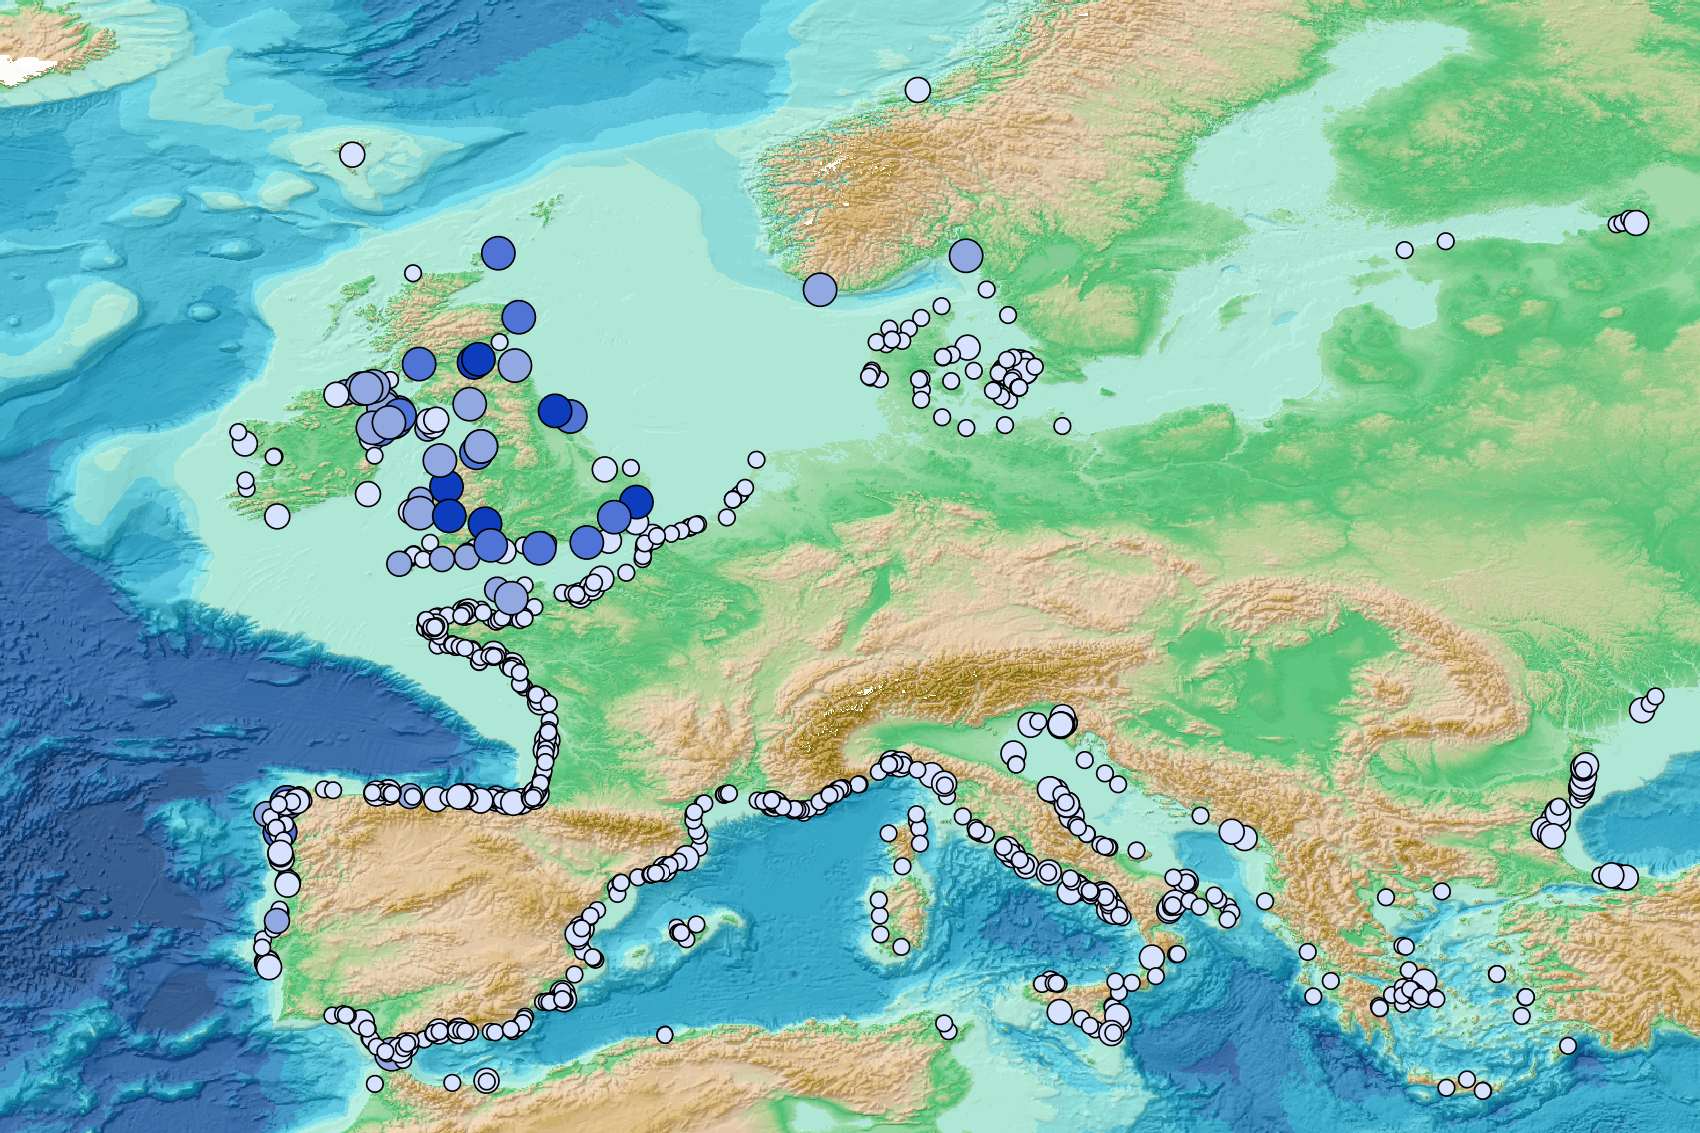
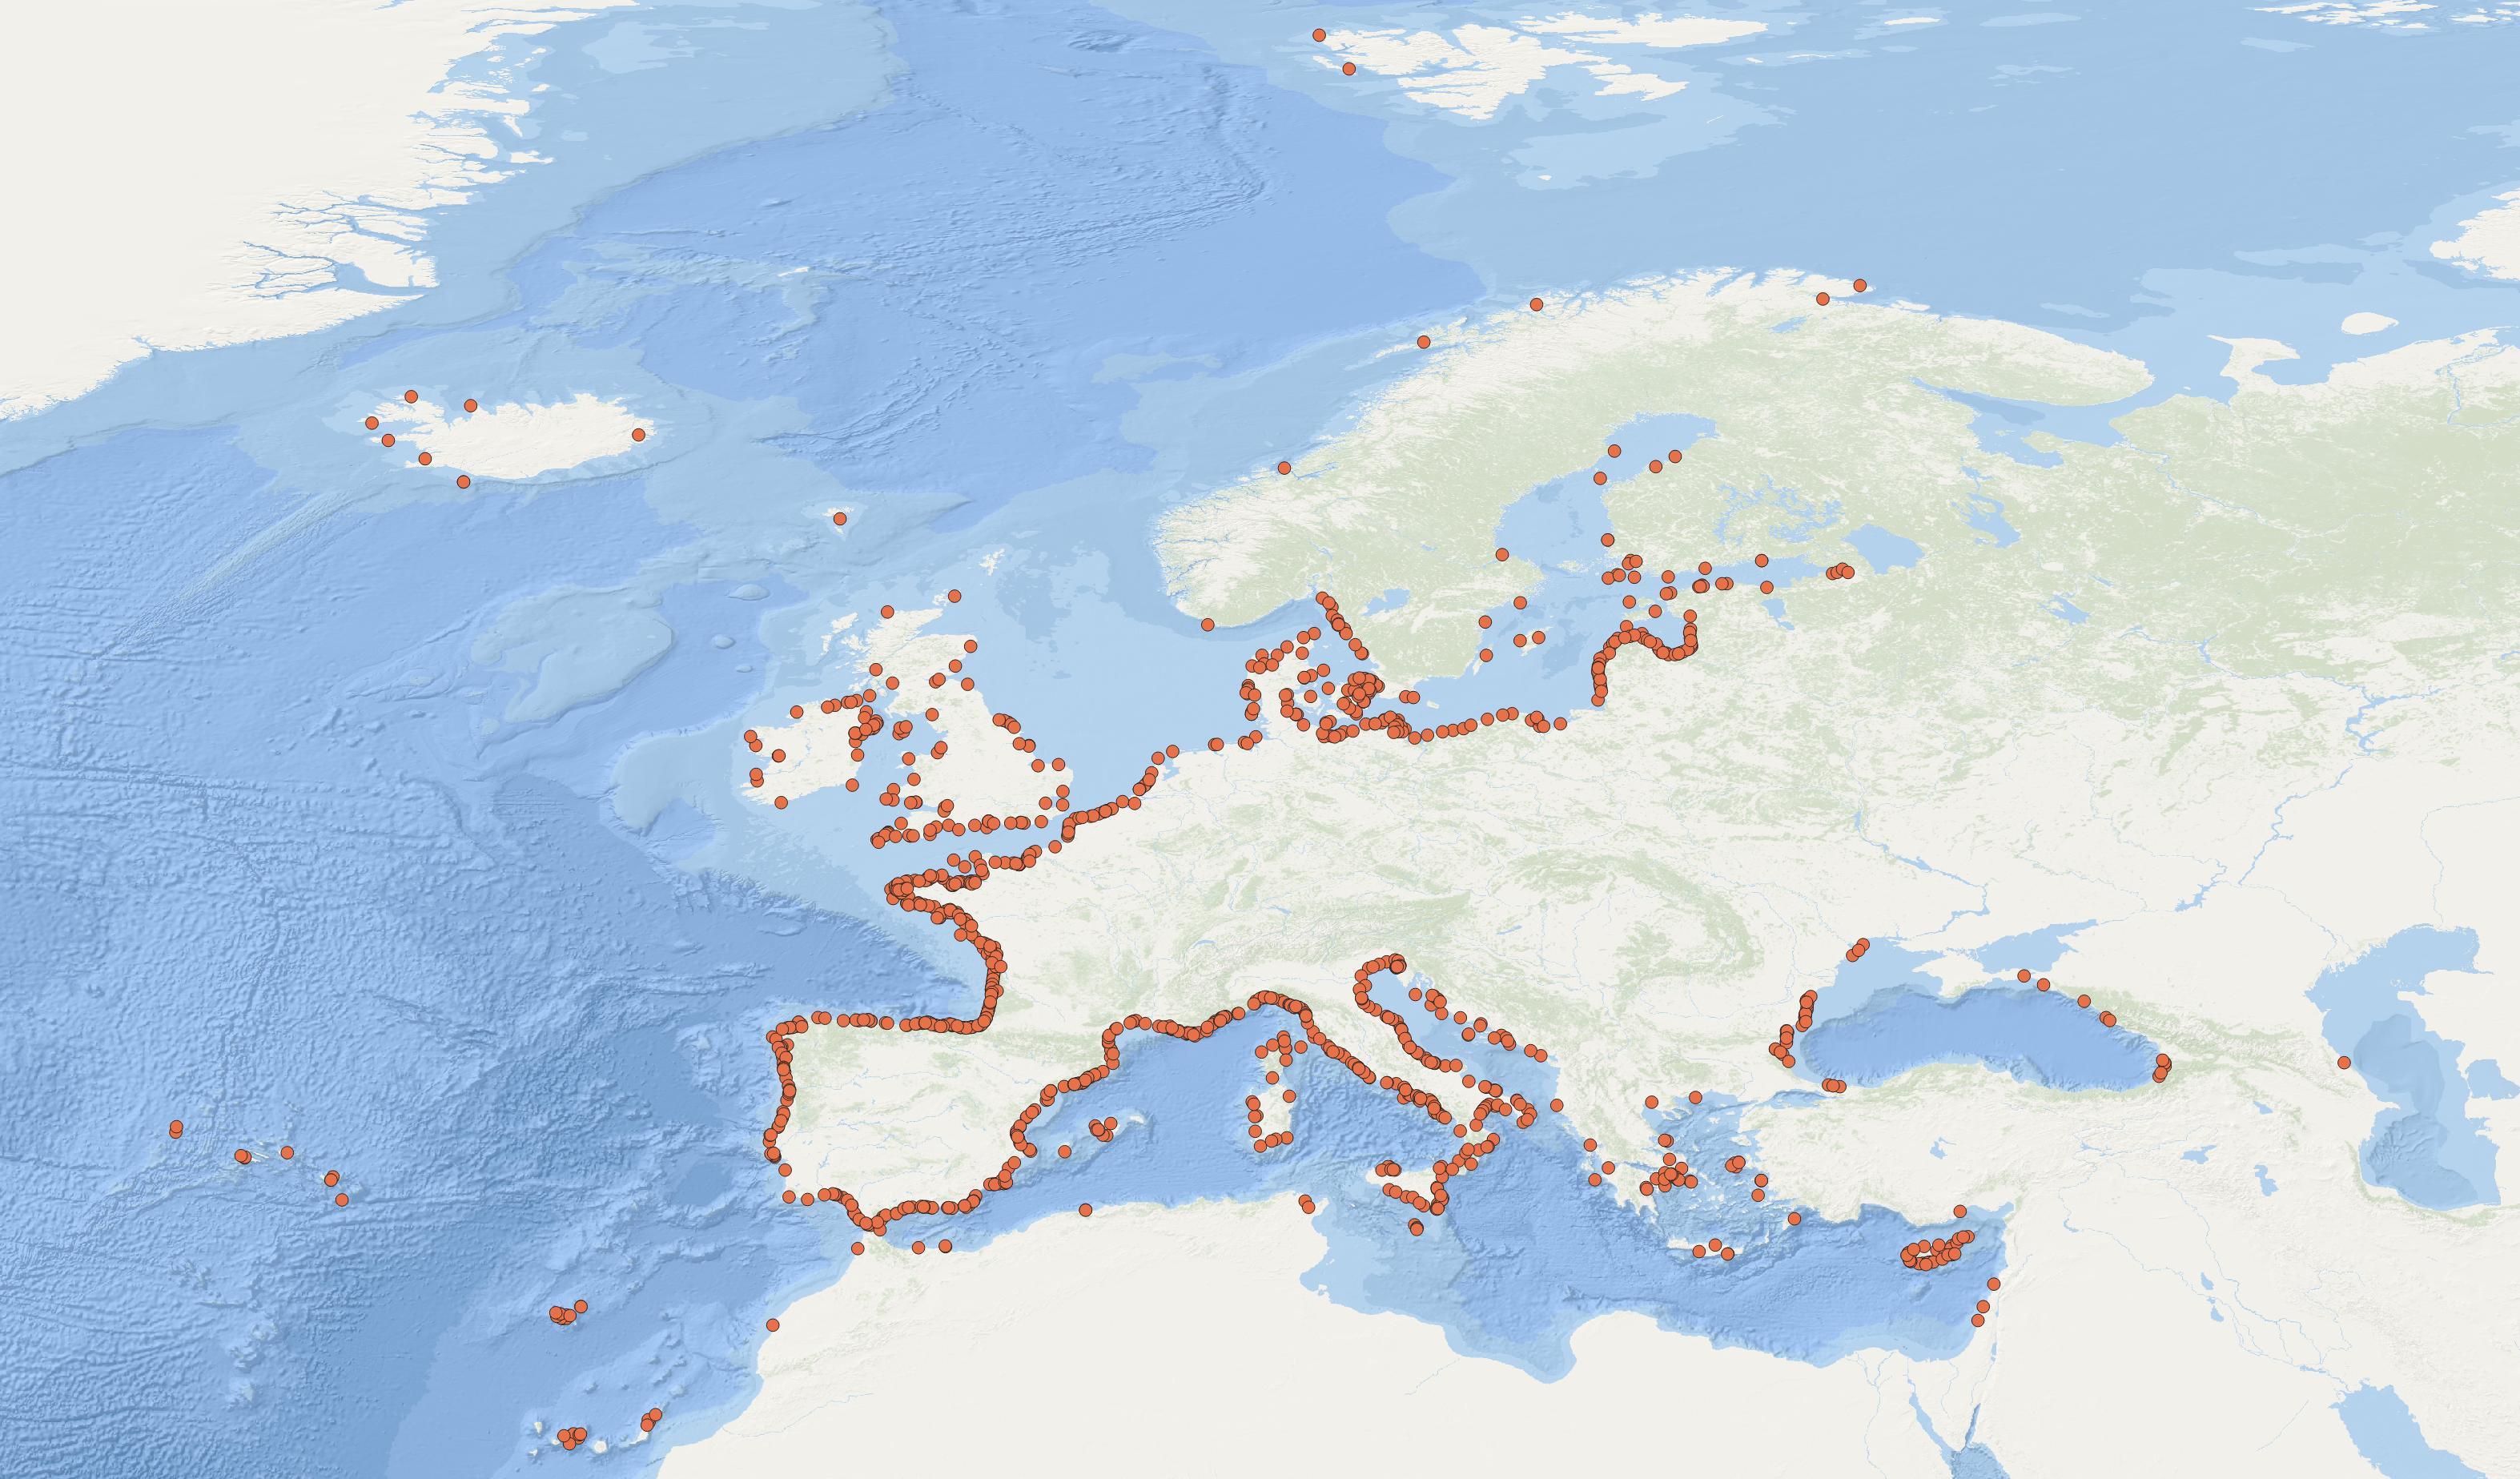
This visualization product displays the total abundance of marine macro-litter (> 2.5cm) per beach, per 100m & to 1 survey aggregated over the period 2001 to 2020 from Marine Strategy Framework Directive (MSFD) monitoring surveys. EMODnet Chemistry included the collection of marine litter in its 3rd phase. Since the beginning of 2018, data of beach litter have been gathered and processed in the EMODnet Chemistry Marine Litter Database (MLDB). The harmonization of all the data has been the most challenging task considering the heterogeneity of the data sources, sampling protocols and reference lists used on a European scale. Preliminary processing were necessary to harmonize all the data: - Exclusion of OSPAR 1000 protocol: in order to follow the approach of OSPAR that it is not including these data anymore in the monitoring; - Selection of MSFD surveys only (exclusion of other monitoring, cleaning and research operations); - Exclusion of beaches without coordinates; - Some categories & some litter types like organic litter, small fragments (paraffin and wax; items > 2.5cm) and pollutants have been removed. The list of selected items is attached to this metadata (total abundance list). This list was created using EU Marine Beach Litter Baselines and EU Threshold Value for Macro Litter on Coastlines from JRC (these two documents are attached to this metadata); - Normalization of survey lengths to 100m & 1 survey / year: in some cases, the survey length was not exactly 100m, so in order to be able to compare the abundance of litter from different beaches a normalization is applied using this formula: Number of items (normalized by 100 m) = Number of litter per items x (100 / survey length) Then, this normalized number of items is summed to obtain the total normalized number of litter for each survey. Finally, a median is calculated over the entire period among all these total numbers of litter per 100m calculated for each survey. Sometimes the survey length was null or equal to 0. Assuming that the MSFD protocol has been applied, the length has been set at 100m in these cases. The size of each circle on this map increases with the calculated median number of marine litter per beach, per 100m & to 1 survey. The median litter abundance values displayed in the legend correspond to the 50 and 99 percentiles and the maximum value. More information is available in the attached documents. Warning: - the absence of data on the map doesn't necessarily mean that they don't exist, but that no information has been entered in the Marine Litter Database for this area. - This map was created to give an idea of the distribution of beach litter between 2001 and 2021 in a synthetic manner. NOT ALL BEACHES MAY HAVE DATA FOR THE ENTIRE PERIOD, SO IT IS NOT POSSIBLE TO MAKE A COMPARISON BETWEEN BEACHES.
-

This visualization product displays the number of non-MSFD monitoring surveys, research & cleaning operations and the associated temporal coverage per beach. EMODnet Chemistry included the collection of marine litter in its 3rd phase. Since the beginning of 2018, data of beach litter have been gathered and processed in the EMODnet Chemistry Marine Litter Database (MLDB). The harmonization of all the data has been the most challenging task considering the heterogeneity of the data sources, sampling protocols and reference lists used on a European scale. Preliminary processings were necessary to harmonize all the data: - Exclusion of OSPAR 1000 protocol: in order to follow the approach of OSPAR that it is not including these data anymore in the monitoring; - Selection of surveys from non-MSFD monitoring, cleaning and research operations; - Exclusion of beaches without coordinates. More information is available in the attached documents. Warning: the absence of data on the map does not necessarily mean that they do not exist, but that no information has been entered in the Marine Litter Database for this area.
-
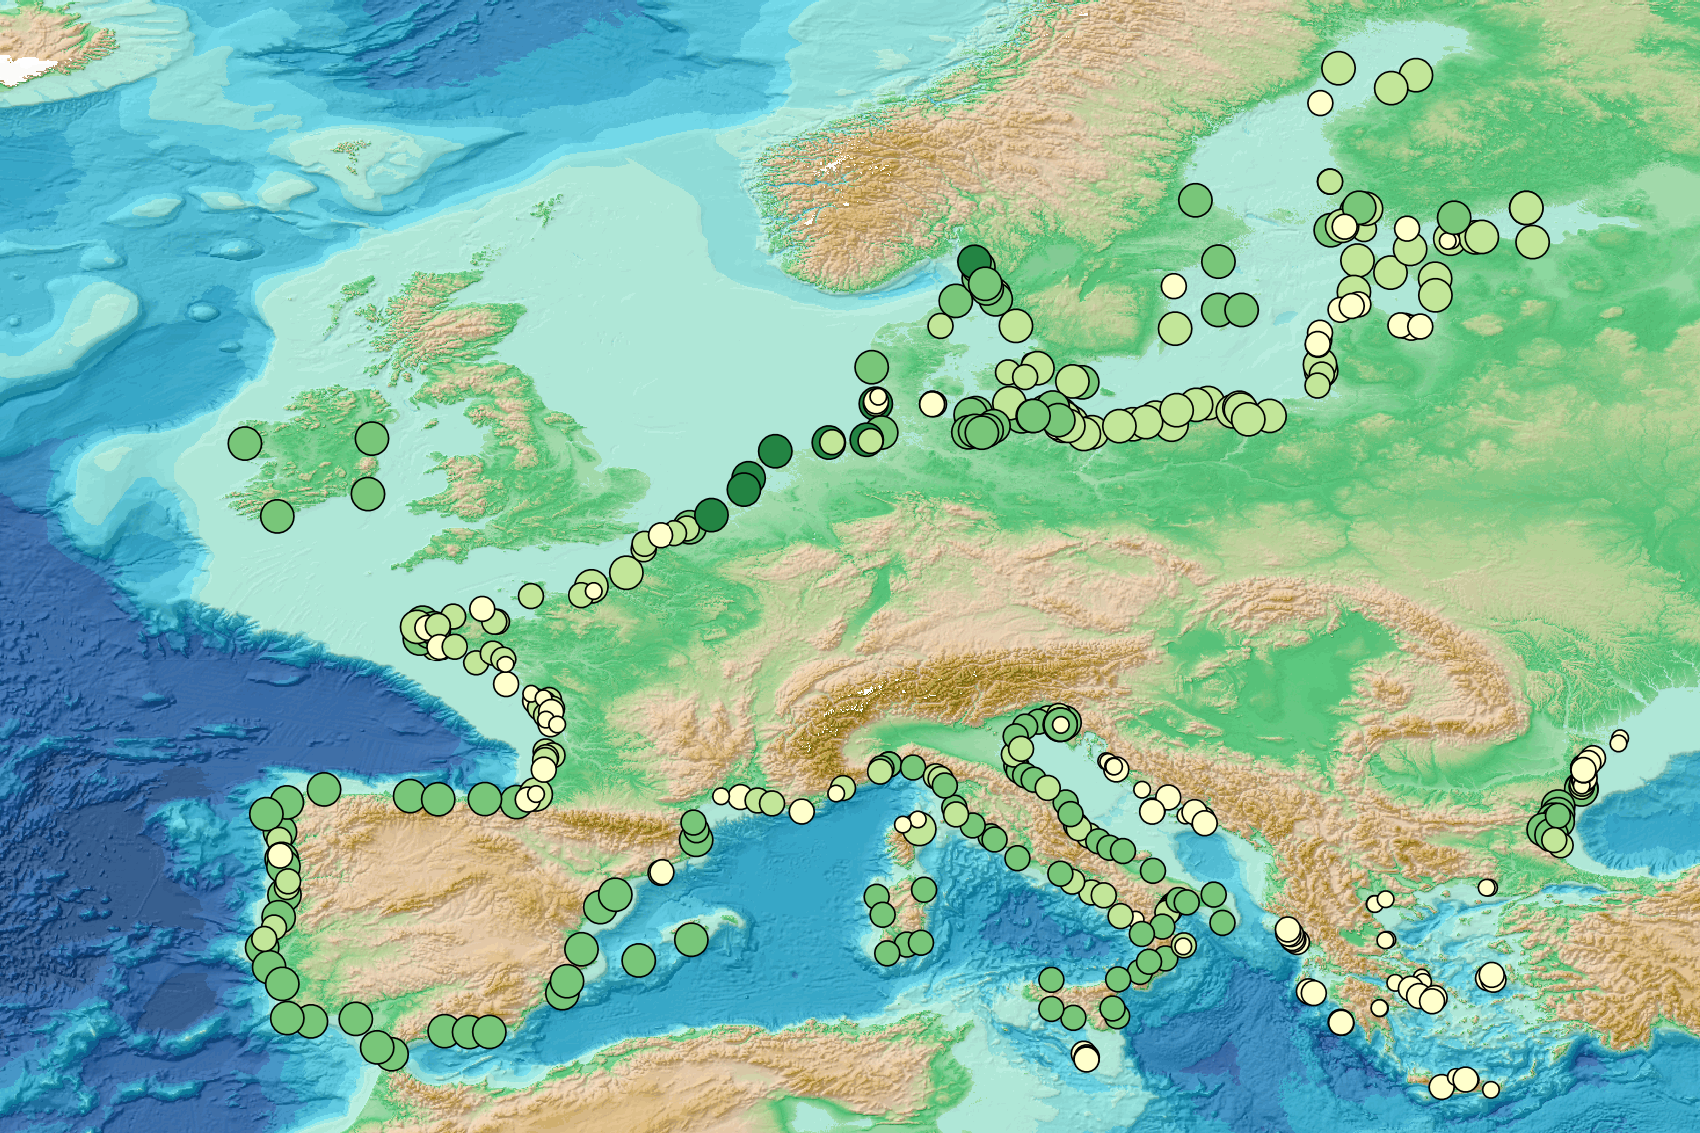
This visualization product displays the number of Marine Strategy Framework Directive (MSFD) monitoring surveys and the associated temporal coverage per beach. EMODnet Chemistry included the collection of marine litter in its 3rd phase. Since the beginning of 2018, data of beach litter have been gathered and processed in the EMODnet Chemistry Marine Litter Database (MLDB). The harmonization of all the data has been the most challenging task considering the heterogeneity of the data sources, sampling protocols and reference lists used on a European scale. Preliminary processing were necessary to harmonize all the data: - Exclusion of OSPAR 1000 protocol: in order to follow the approach of OSPAR that it is not including these data anymore in the monitoring; - Selection of MSFD surveys only (exclusion of other monitoring, cleaning and research operations); - Exclusion of beaches without coordinates. More information is available in the attached documents. Warning: the absence of data on the map doesn't necessarily mean that they don't exist, but that no information has been entered in the Marine Litter Database for this area.
-
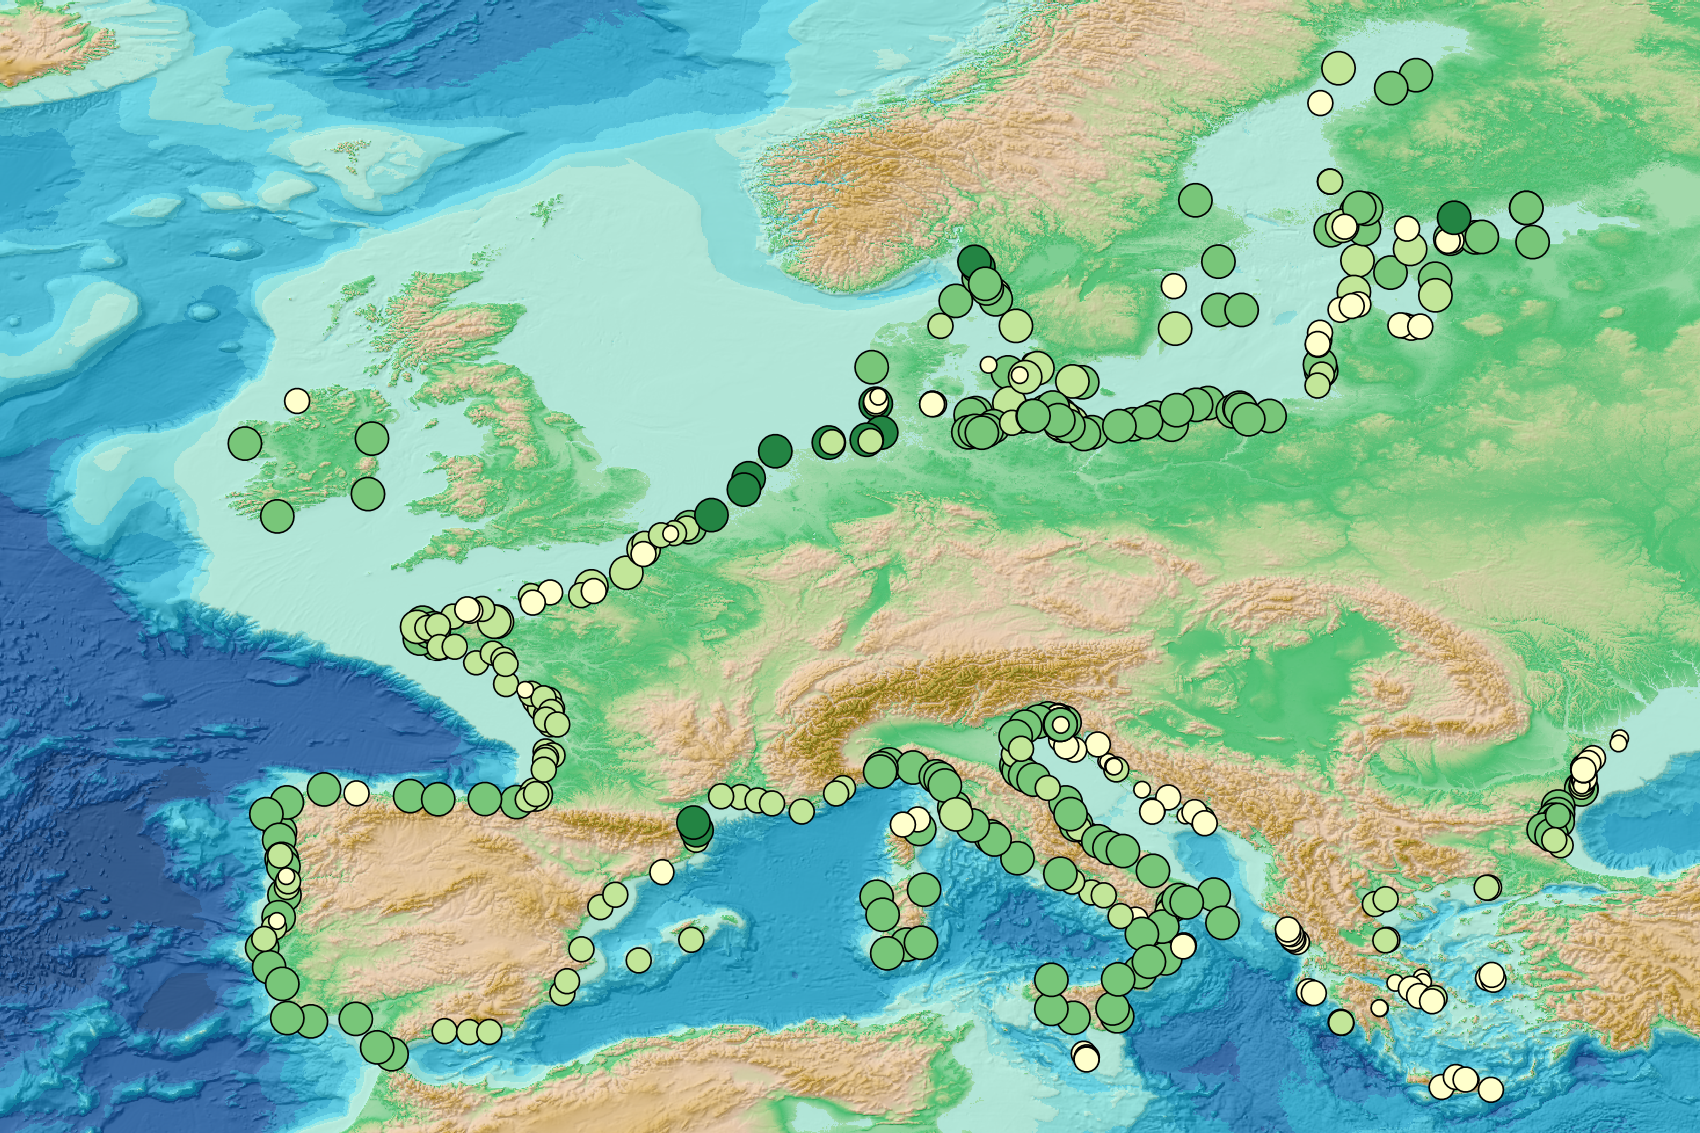
This visualization product displays the number of Marine Strategy Framework Directive (MSFD) monitoring surveys and the associated temporal coverage per beach. EMODnet Chemistry included the collection of marine litter in its 3rd phase. Since the beginning of 2018, data of beach litter have been gathered and processed in the EMODnet Chemistry Marine Litter Database (MLDB). The harmonization of all the data has been the most challenging task considering the heterogeneity of the data sources, sampling protocols and reference lists used on a European scale. Preliminary processings were necessary to harmonize all the data: - Exclusion of OSPAR 1000 protocol: in order to follow the approach of OSPAR that it is not including these data anymore in the monitoring; - Selection of MSFD surveys only (exclusion of other monitoring, cleaning and research operations); - Exclusion of beaches without coordinates. More information is available in the attached documents. Warning: the absence of data on the map does not necessarily mean that they do not exist, but that no information has been entered in the Marine Litter Database for this area.
-
EMODnet Chemistry aims to provide access to marine chemistry data sets and derived data products concerning eutrophication, ocean acidification, contaminants and litter. The chosen parameters are relevant for the Marine Strategy Framework Directive (MSFD), in particular for descriptors 5, 8, 9 and 10. The dataset contains standardized, harmonized and validated data collections from beach litter (monitoring and other sources). Datasets concerning beach and seafloor litter data are loaded in a central database after a semi-automated validation phase. Once loaded, a data assessment is performed in order to check data consistency and potential errors are corrected thanks to a feedback loop with data originators. For beach litter, the harmonized datasets contain all unrestricted EMODnet Chemistry data on beach litter, including monitoring data, data from cleaning surveys and data from research. A relevant part of the monitoring data has been considered for assessment purposes by the European institutions and therefore is tagged as MSFD_monitoring. EMODnet beach litter data and databases are hosted and maintained by 'Istituto Nazionale di Oceanografia e di Geofisica Sperimentale, Division of Oceanography (OGS/NODC)' from Italy. Data are formatted following Guidelines and forms for gathering marine litter data, which can be found at: https://doi.org/10.6092/15c0d34c-a01a-4091-91ac-7c4f561ab508. The updated vocabularies of admitted values are available in https://nodc.ogs.it/marinelitter/vocab. The harmonized datasets can be downloaded as EMODnet Beach litter data format Version 7.0, which is a spreadsheet file composed of 4 sheets: beach metadata, survey metadata, animals and litter.
-

EMODnet Chemistry aims to provide access to marine chemistry data sets and derived data products concerning eutrophication, ocean acidification, contaminants and litter. The chosen parameters are relevant for the Marine Strategy Framework Directive (MSFD), in particular for descriptors 5, 8, 9 and 10. The dataset contains standardized, harmonized and validated data collections from beach litter (monitoring and other sources). Datasets concerning beach and seafloor litter data are loaded in a central database after a semi-automated validation phase. Once loaded, a data assessment is performed in order to check data consistency and potential errors are corrected thanks to a feedback loop with data originators. For beach litter, the harmonized datasets contain all unrestricted EMODnet Chemistry data on beach litter, including monitoring data, data from cleaning surveys and data from research. A relevant part of the monitoring data has been considered for assessment purposes by the European institutions and therefore is tagged as MSFD_monitoring. EMODnet beach litter data and databases are hosted and maintained by 'Istituto Nazionale di Oceanografia e di Geofisica Sperimentale, Division of Oceanography (OGS/NODC)' from Italy. Data are formatted following Guidelines and forms for gathering marine litter data, which can be found at: https://doi.org/10.6092/15c0d34c-a01a-4091-91ac-7c4f561ab508 The updated vocabularies of admitted values are available at: https://nodc.ogs.it/marinelitter/vocab The European harmonized dataset is provided as csv format in two files, one containing the survey data and one containing the survey metadata. The dataset is available through direct download or through ERDDAP.
-
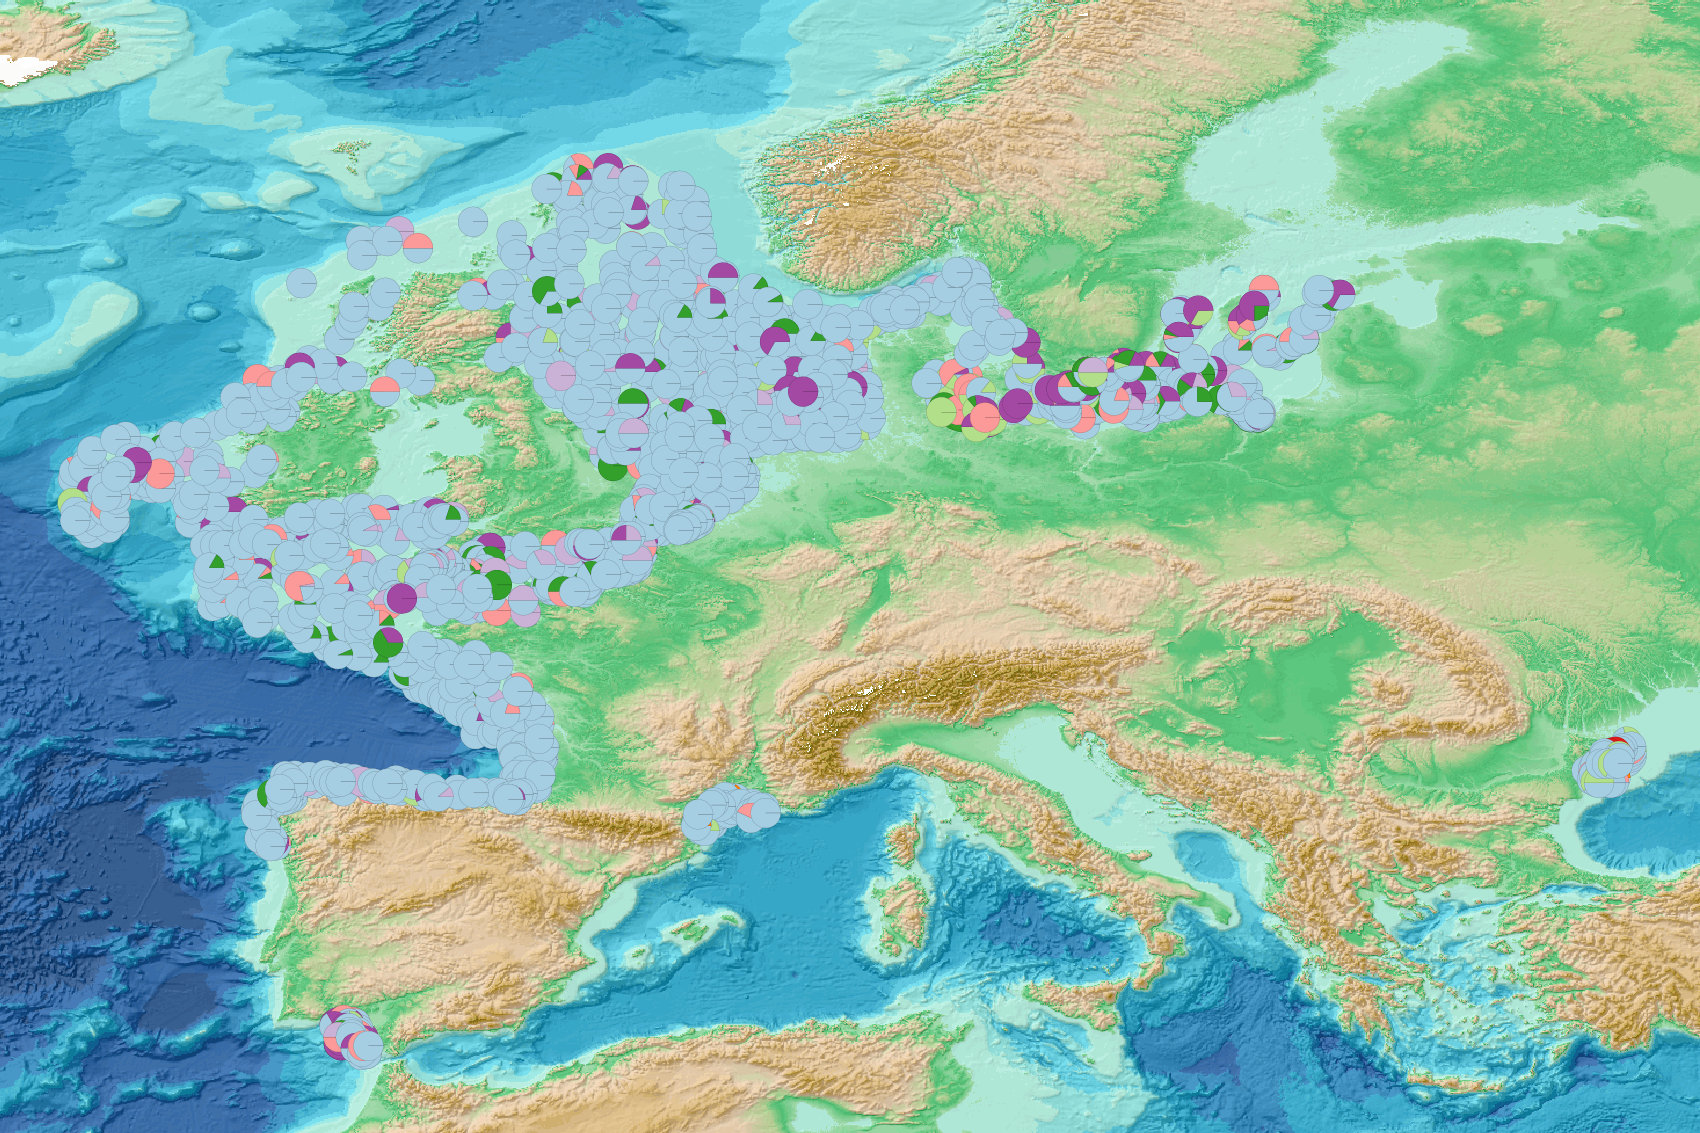
This visualization product displays the marine litter material categories percentage per trawl. EMODnet Chemistry included the collection of marine litter in its 3rd phase. Since the beginning of 2018, data of seafloor litter collected by international fish-trawl surveys have been gathered and processed in the EMODnet Chemistry Marine Litter Database (MLDB). The harmonization of all the data has been the most challenging task considering the heterogeneity of the data sources, sampling protocols (OSPAR and MEDITS protocols) and reference lists used on a European scale. Moreover, within the same protocol, different gear types are deployed during fishing bottom trawl surveys. Unlike other EMODnet seafloor litter products, all trawls surveyed since 2007 are included in this map even if the wingspread and/or the distance are unknown. Only surveys with an unknown number of items were excluded from this product. Harmonization of the material categories between ICES and MEDITS lists has been performed and the following calculation has been applied: Material % = (∑Number of items of each material category*100)/(∑Number of items of all material categories) More information on data processing and calculation are detailed in the document attached. Warning: the absence of data on the map doesn't necessarily mean that they don't exist, but that no information has been entered in the Marine Litter Database for this area.