 Arctic SDI catalogue
sediment
Type of resources
Available actions
Topics
Keywords
Contact for the resource
Provided by
Years
Formats
Representation types
Update frequencies
status
Service types
Scale
Resolution
-
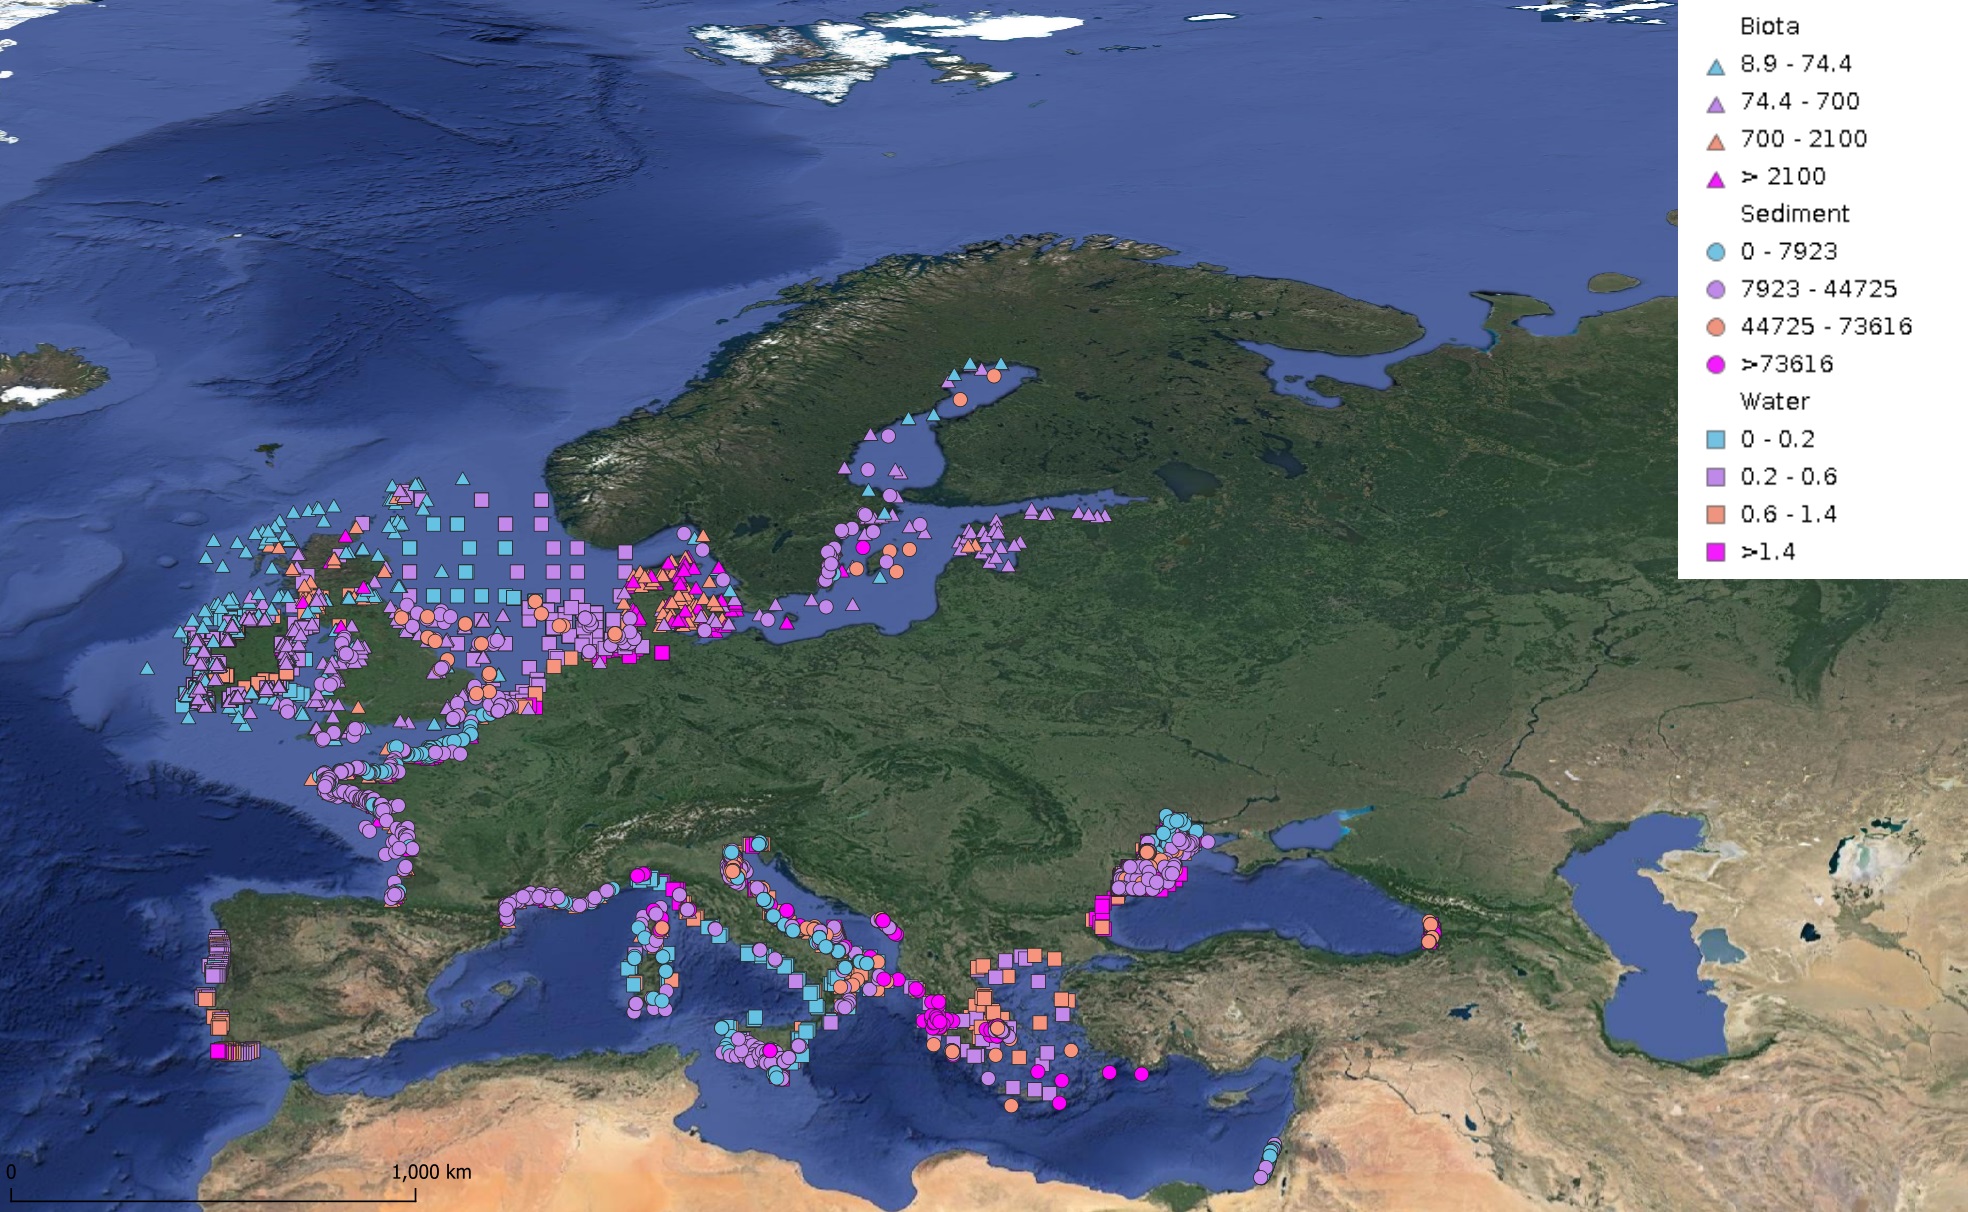
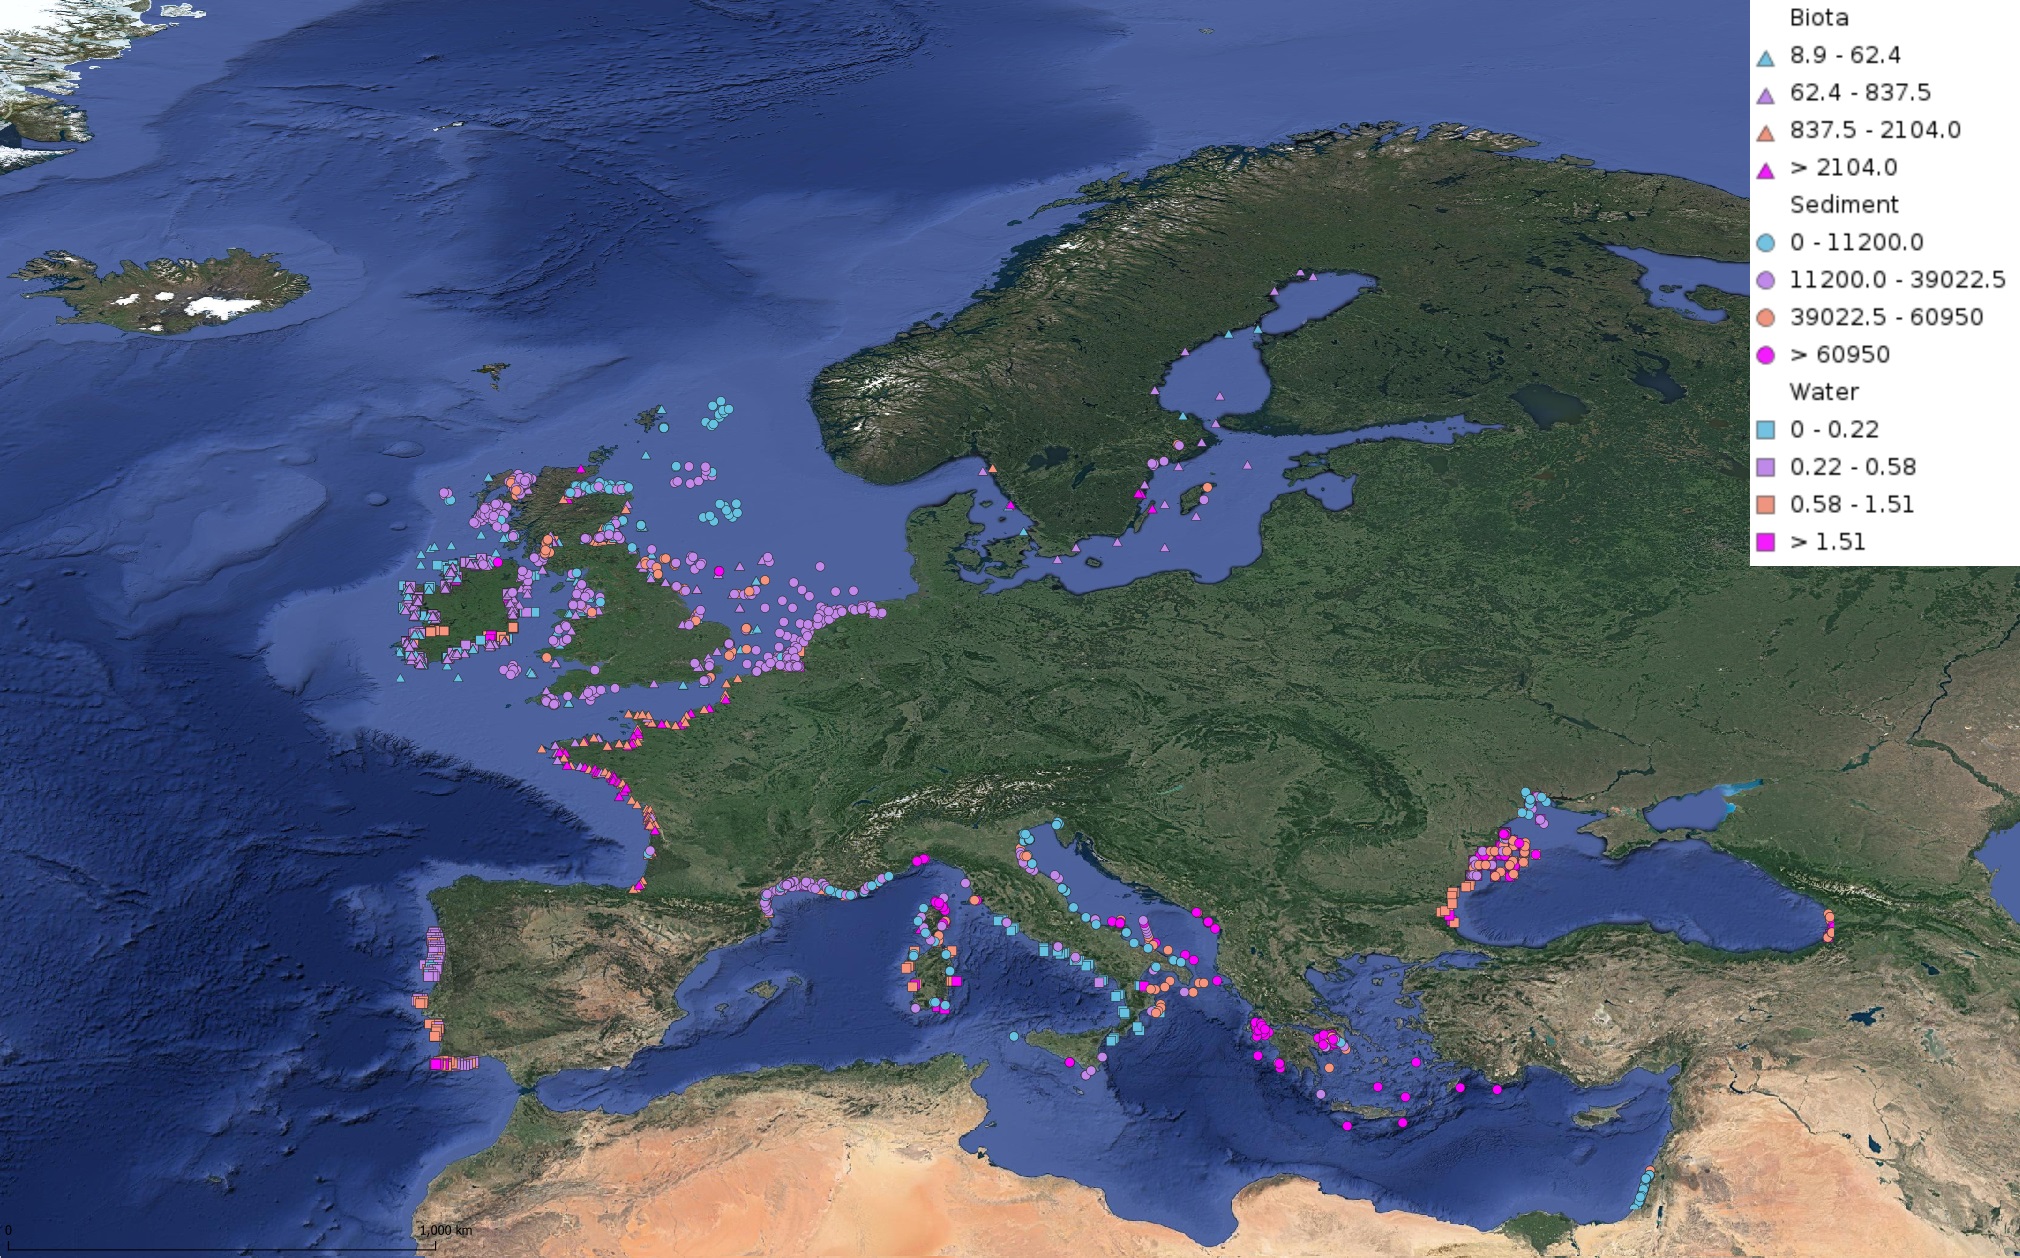
This product displays for Nickel, median values since 2012 that have been measured per matrix and are present in EMODnet regional contaminants aggregated datasets, v2024. The median values ranges are derived from the following percentiles: 0-25%, 25-75%, 75-90%, >90%. Only "good data" are used, namely data with Quality Flag=1, 2, 6, Q (SeaDataNet Quality Flag schema). For water, only surface values are used (0-15 m), for sediment and biota data at all depths are used.
-
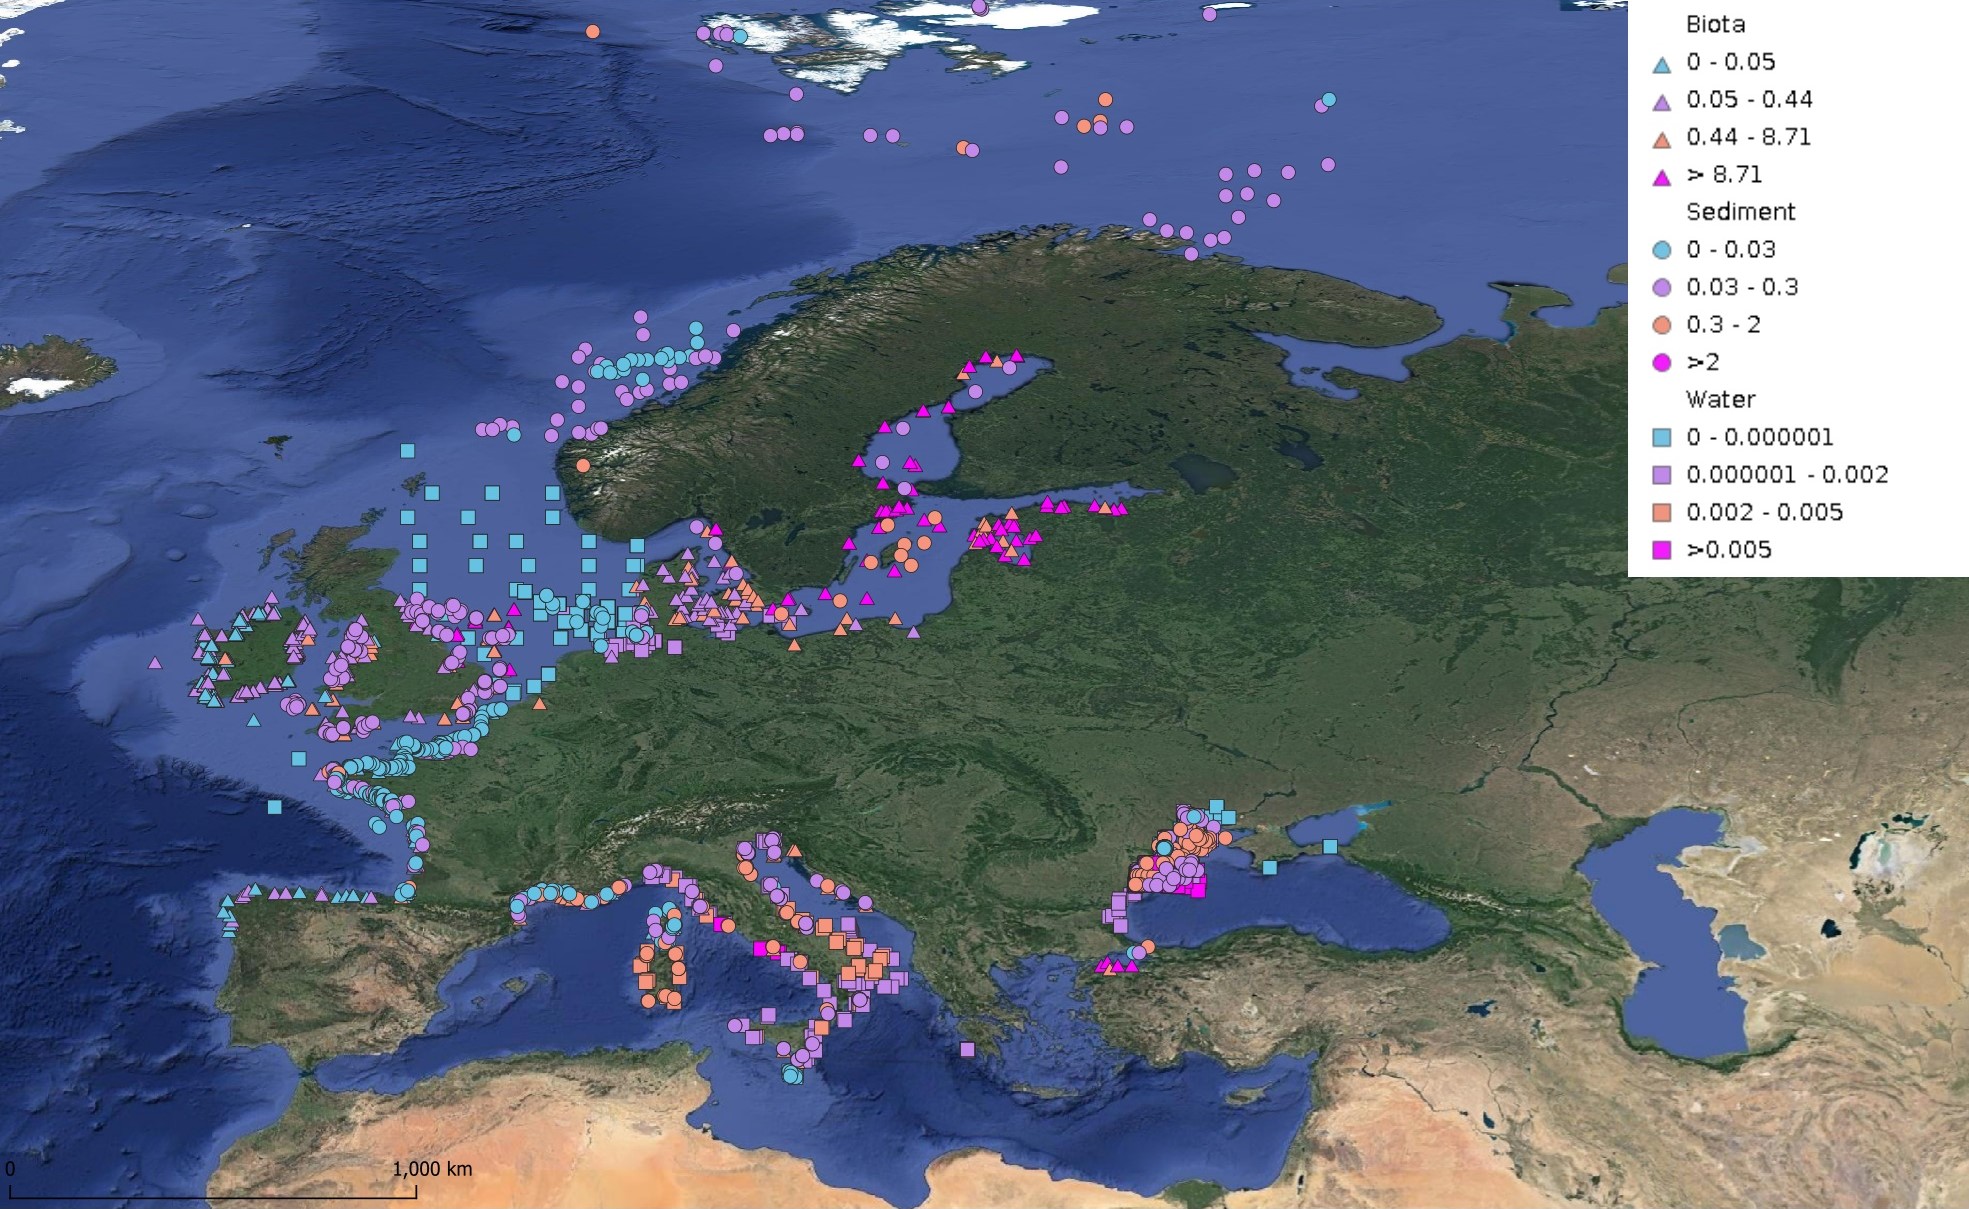
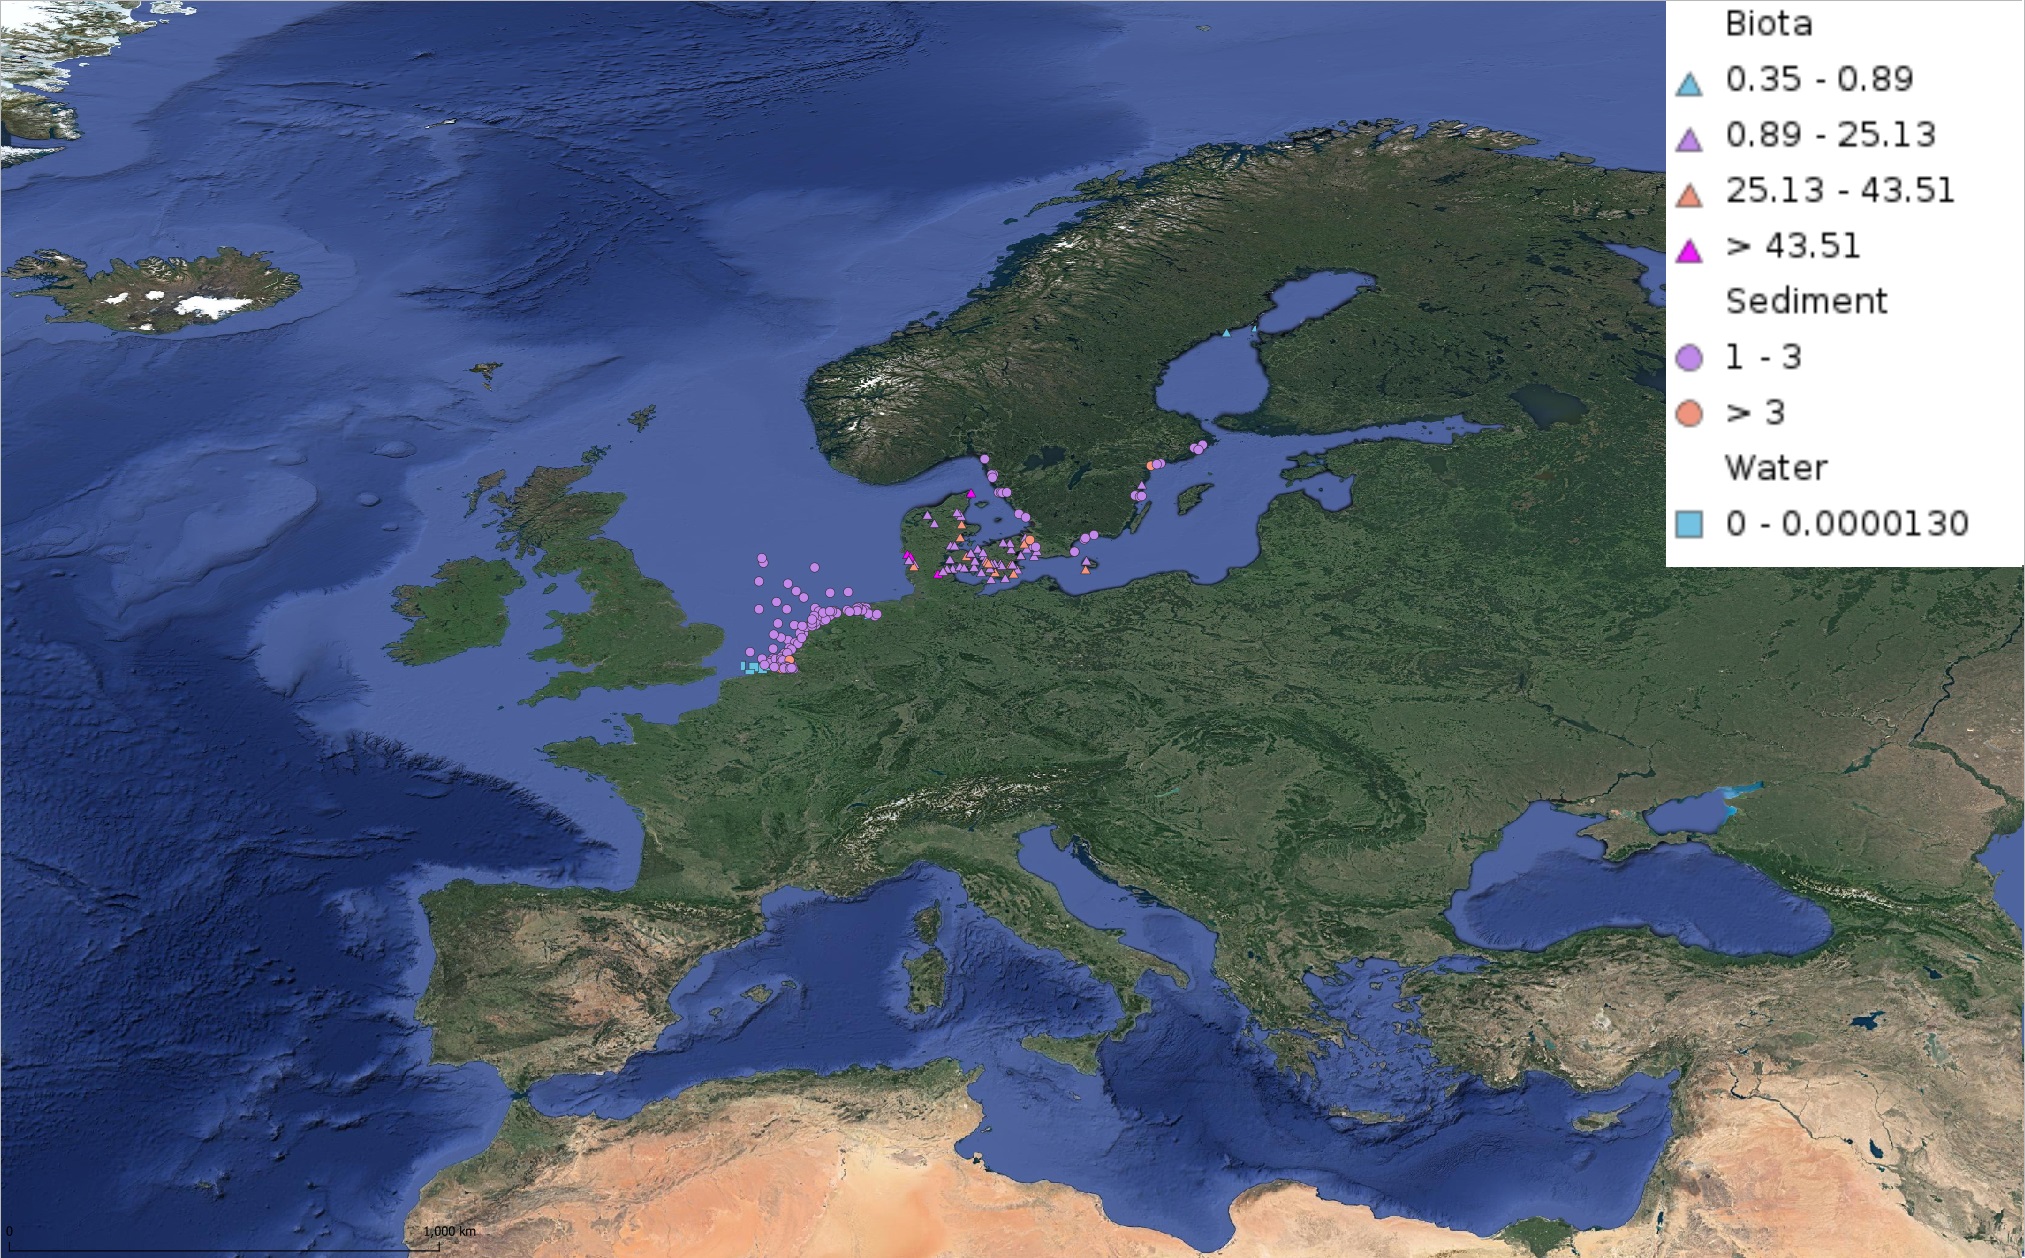
This product displays for DDT, DDE, and DDD, median values since 2012 that have been measured per matrix and are present in EMODnet regional contaminants aggregated datasets, v2024. The median values ranges are derived from the following percentiles: 0-25%, 25-75%, 75-90%, >90%. Only "good data" are used, namely data with Quality Flag=1, 2, 6, Q (SeaDataNet Quality Flag schema). For water, only surface values are used (0-15 m), for sediment and biota data at all depths are used.
-
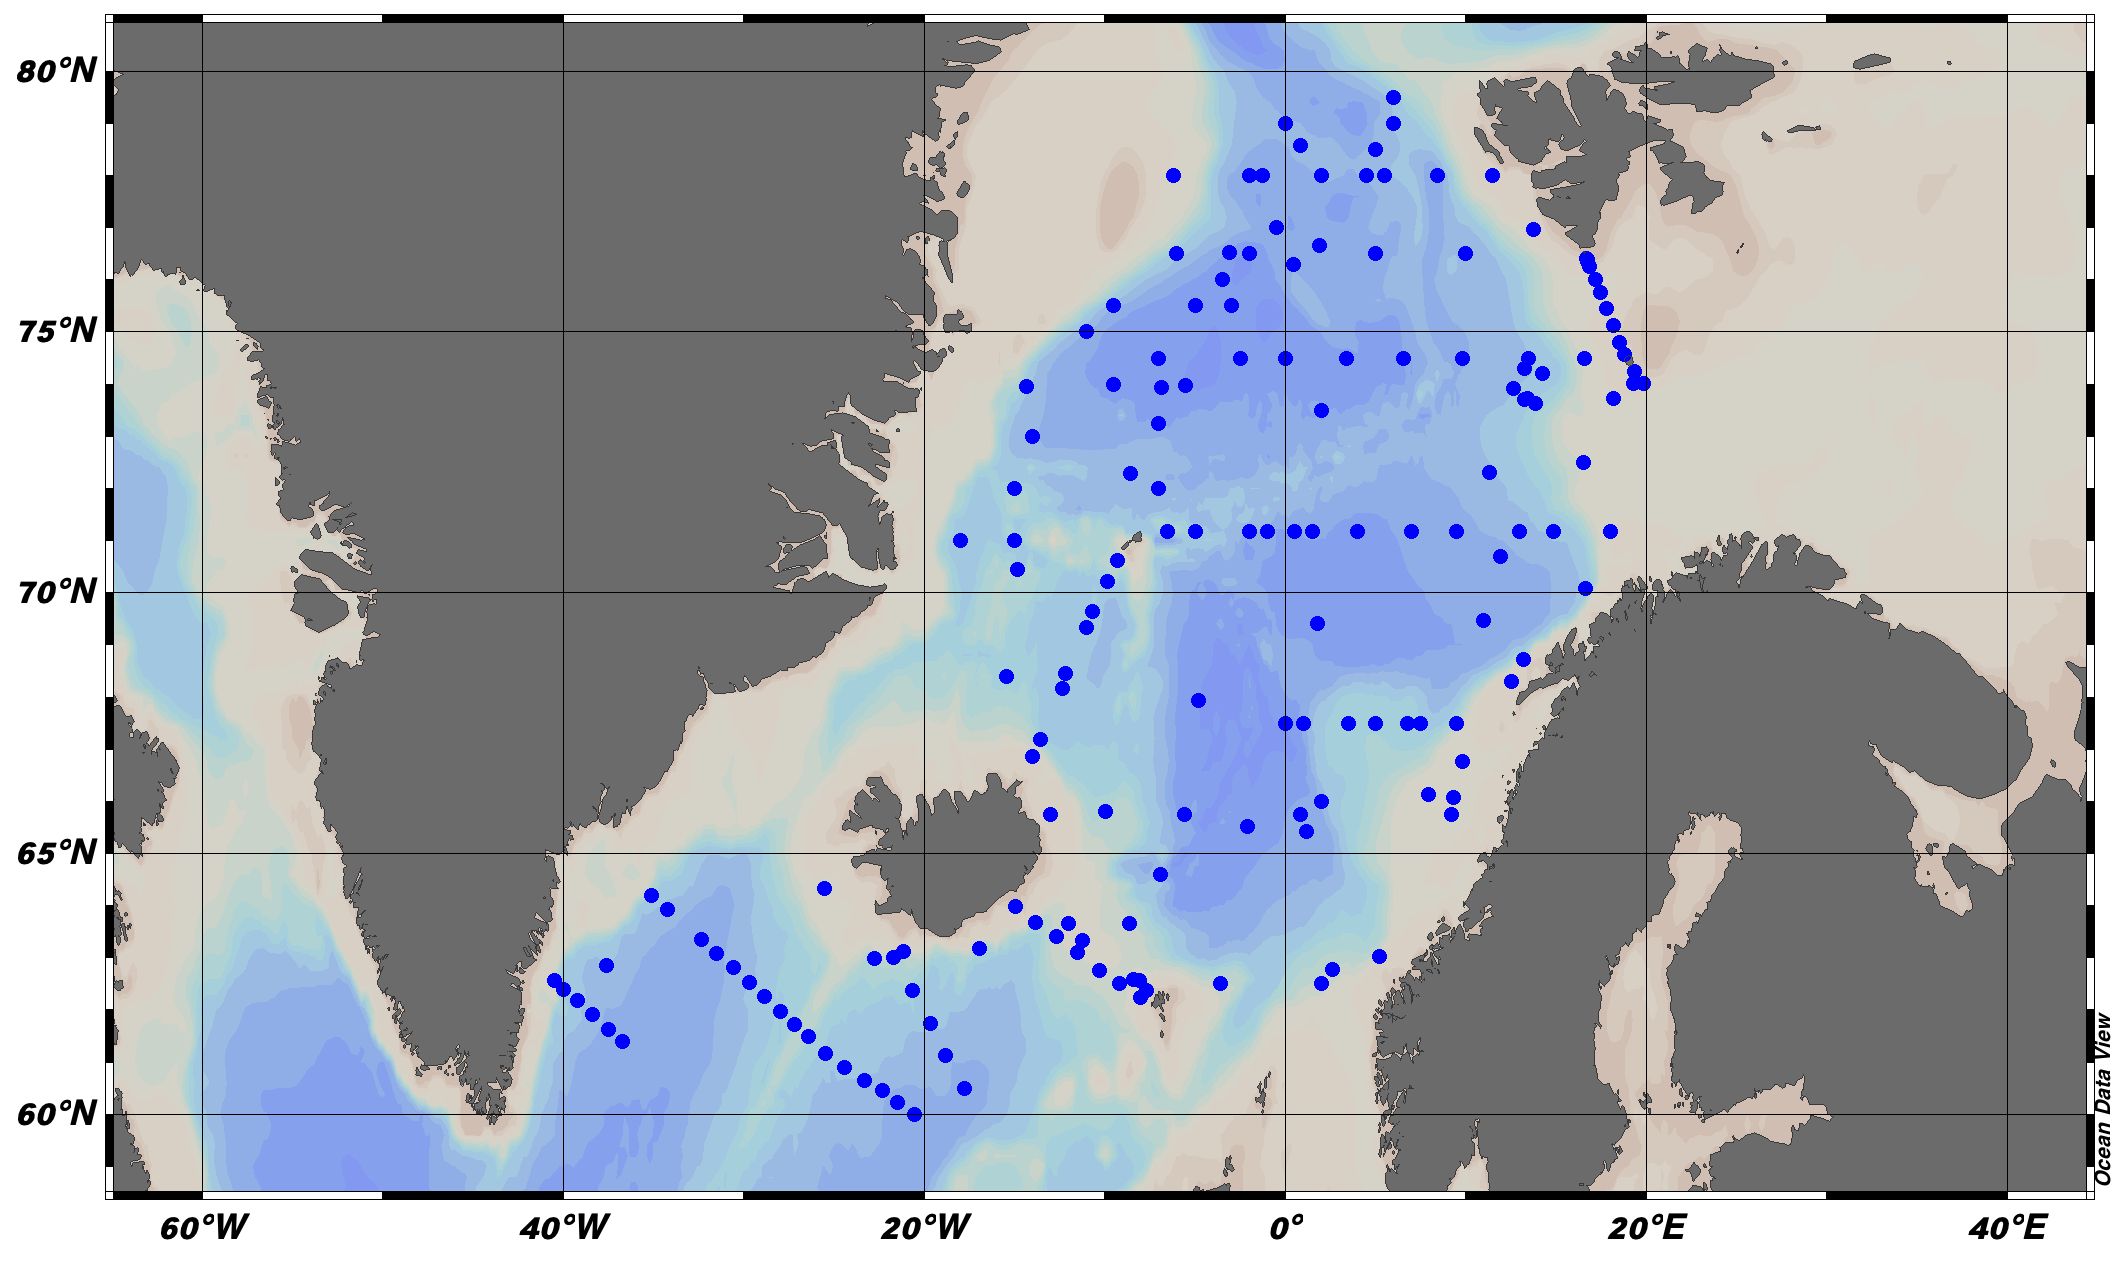
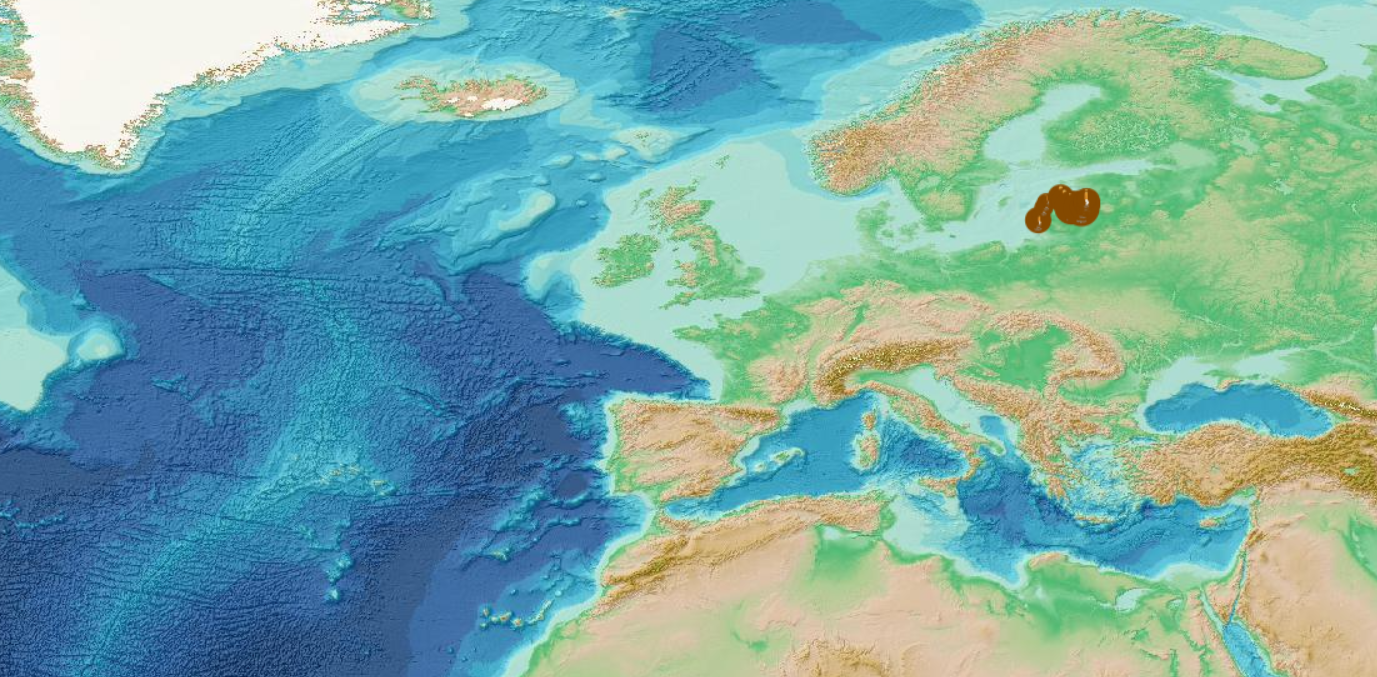
EMODnet Chemistry aims to provide access to marine chemistry datasets and derived data products concerning eutrophication, acidity and contaminants. The importance of the selected substances and other parameters relates to the Marine Strategy Framework Directive (MSFD). This aggregated dataset contains all unrestricted EMODnet Chemistry data on potential hazardous substances, despite the fact that some data might not be related to pollution (e.g. collected by deep corer). Temperature, salinity and additional parameters are included when available. It covers the Norwegian Sea, Barents Sea, Greenland Sea and Icelandic Waters. Data were harmonised and validated by the 'Institute of Marine Research - Norwegian Marine Data Centre (NMD)' in Norway. The dataset contains water and sediment profiles. The temporal coverage is 1974–2011 for water measurements and 1974–2021 for sediment measurements. Regional datasets concerning contaminants are automatically harvested and the resulting collections are harmonised and validated using ODV Software and following a common methodology for all sea regions ( https://doi.org/10.6092/8b52e8d7-dc92-4305-9337-7634a5cae3f4 ). Parameter names are based on P01 vocabulary, which relates to BODC Parameter Usage Vocabulary and is available at: https://vocab.nerc.ac.uk/search_nvs/P01/ . The harmonised dataset can be downloaded as as an ODV spreadsheet, which is composed of a metadata header followed by tab separated values. This spreadsheet can be imported into ODV Software for visualisation (more information can be found at: https://www.seadatanet.org/Software/ODV ). In addition, the same dataset is offered also as a txt file in a long/vertical format, in which each P01 measurement is a record line. Additionally, there are a series of columns that split P01 terms into subcomponents (substance, CAS number, matrix...).This transposed format is more adapted to worksheet applications (e.g. LibreOffice Calc).
-
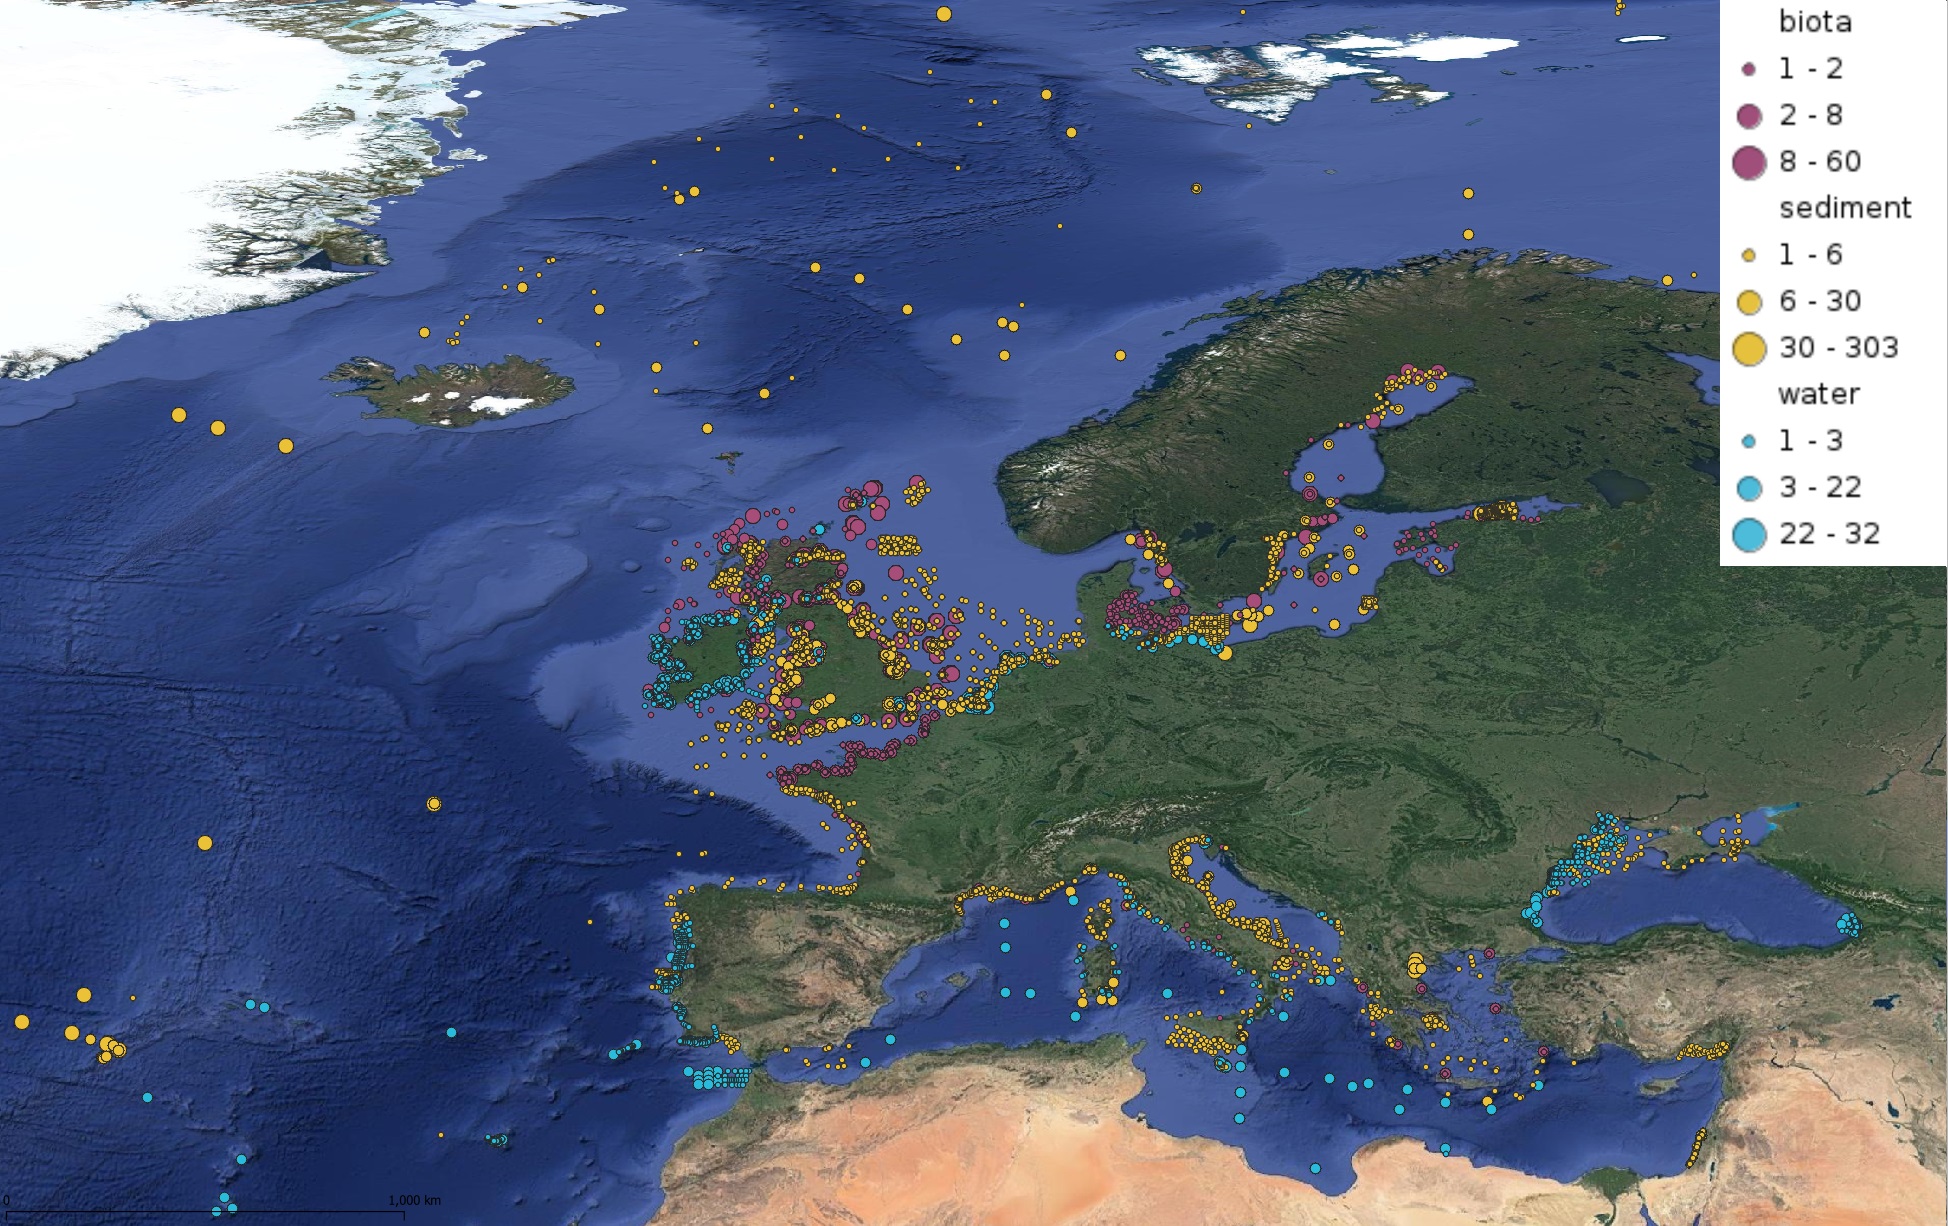
This product displays for Nickel, positions with values counts that have been measured per matrix for each year and are present in EMODnet regional contaminants aggregated datasets, v2022. The product displays positions for every available year.
-
This product displays for Nickel, median values of the last 6 available years that have been measured per matrix and are present in EMODnet regional contaminants aggregated datasets, v2022. The median values ranges are derived from the following percentiles: 0-25%, 25-75%, 75-90%, >90%. Only "good data" are used, namely data with Quality Flag=1, 2, 6, Q (SeaDataNet Quality Flag schema). For water, only surface values are used (0-15 m), for sediment and biota data at all depths are used.
-
This visualization product displays the cigarette related items abundance of marine macro-litter (> 2.5cm) per beach per year from non-MSFD monitoring surveys, research & cleaning operations related to UNEP-MARLIN data only. EMODnet Chemistry included the collection of marine litter in its 3rd phase. Since the beginning of 2018, data of beach litter have been gathered and processed in the EMODnet Chemistry Marine Litter Database (MLDB). The harmonization of all the data has been the most challenging task considering the heterogeneity of the data sources, sampling protocols and reference lists used on a European scale. Preliminary processing were necessary to harmonize all the data: - Selection of surveys from non-MSFD monitoring, cleaning and research operations; - Exclusion of beaches without coordinates; - Selection of cigarette related items only. The list of selected items is attached to this metadata. This list was created using EU Marine Beach Litter Baselines and EU Threshold Value for Macro Litter on Coastlines from JRC (these two documents are attached to this metadata); - Exclusion of surveys without associated length; - Selection of surveys referring to the UNEP-MARLIN list: the UNEP-MARLIN protocol differs from the other types of monitoring in that cigarette butts are surveyed in a 10m square. To avoid comparing abundances from very different protocols, the choice has been made to distinguish in two maps the cigarette related items results associated with the UNEP-MARLIN list from the others; - Normalization of survey lengths to 100m & 1 survey / year: in some case, the survey length was not 100m, so in order to be able to compare the abundance of litter from different beaches a normalization is applied using this formula: Number of cigarette related items of the survey (normalized by 100 m) = Number of cigarette related items of the survey x (100 / survey length) Then, this normalized number of cigarette related items is summed to obtain the total normalized number of cigarette related items for each survey. Finally, the median abundance of cigarette related items for each beach and year is calculated from these normalized abundances of cigarette related items per survey. Percentiles 50, 75, 95 & 99 have been calculated taking into account cigarette related items from other sources data (UNEP-MARLIN protocol only) for all years. More information is available in the attached documents. Warning: the absence of data on the map doesn't necessarily mean that they don't exist, but that no information has been entered in the Marine Litter Database for this area.
-
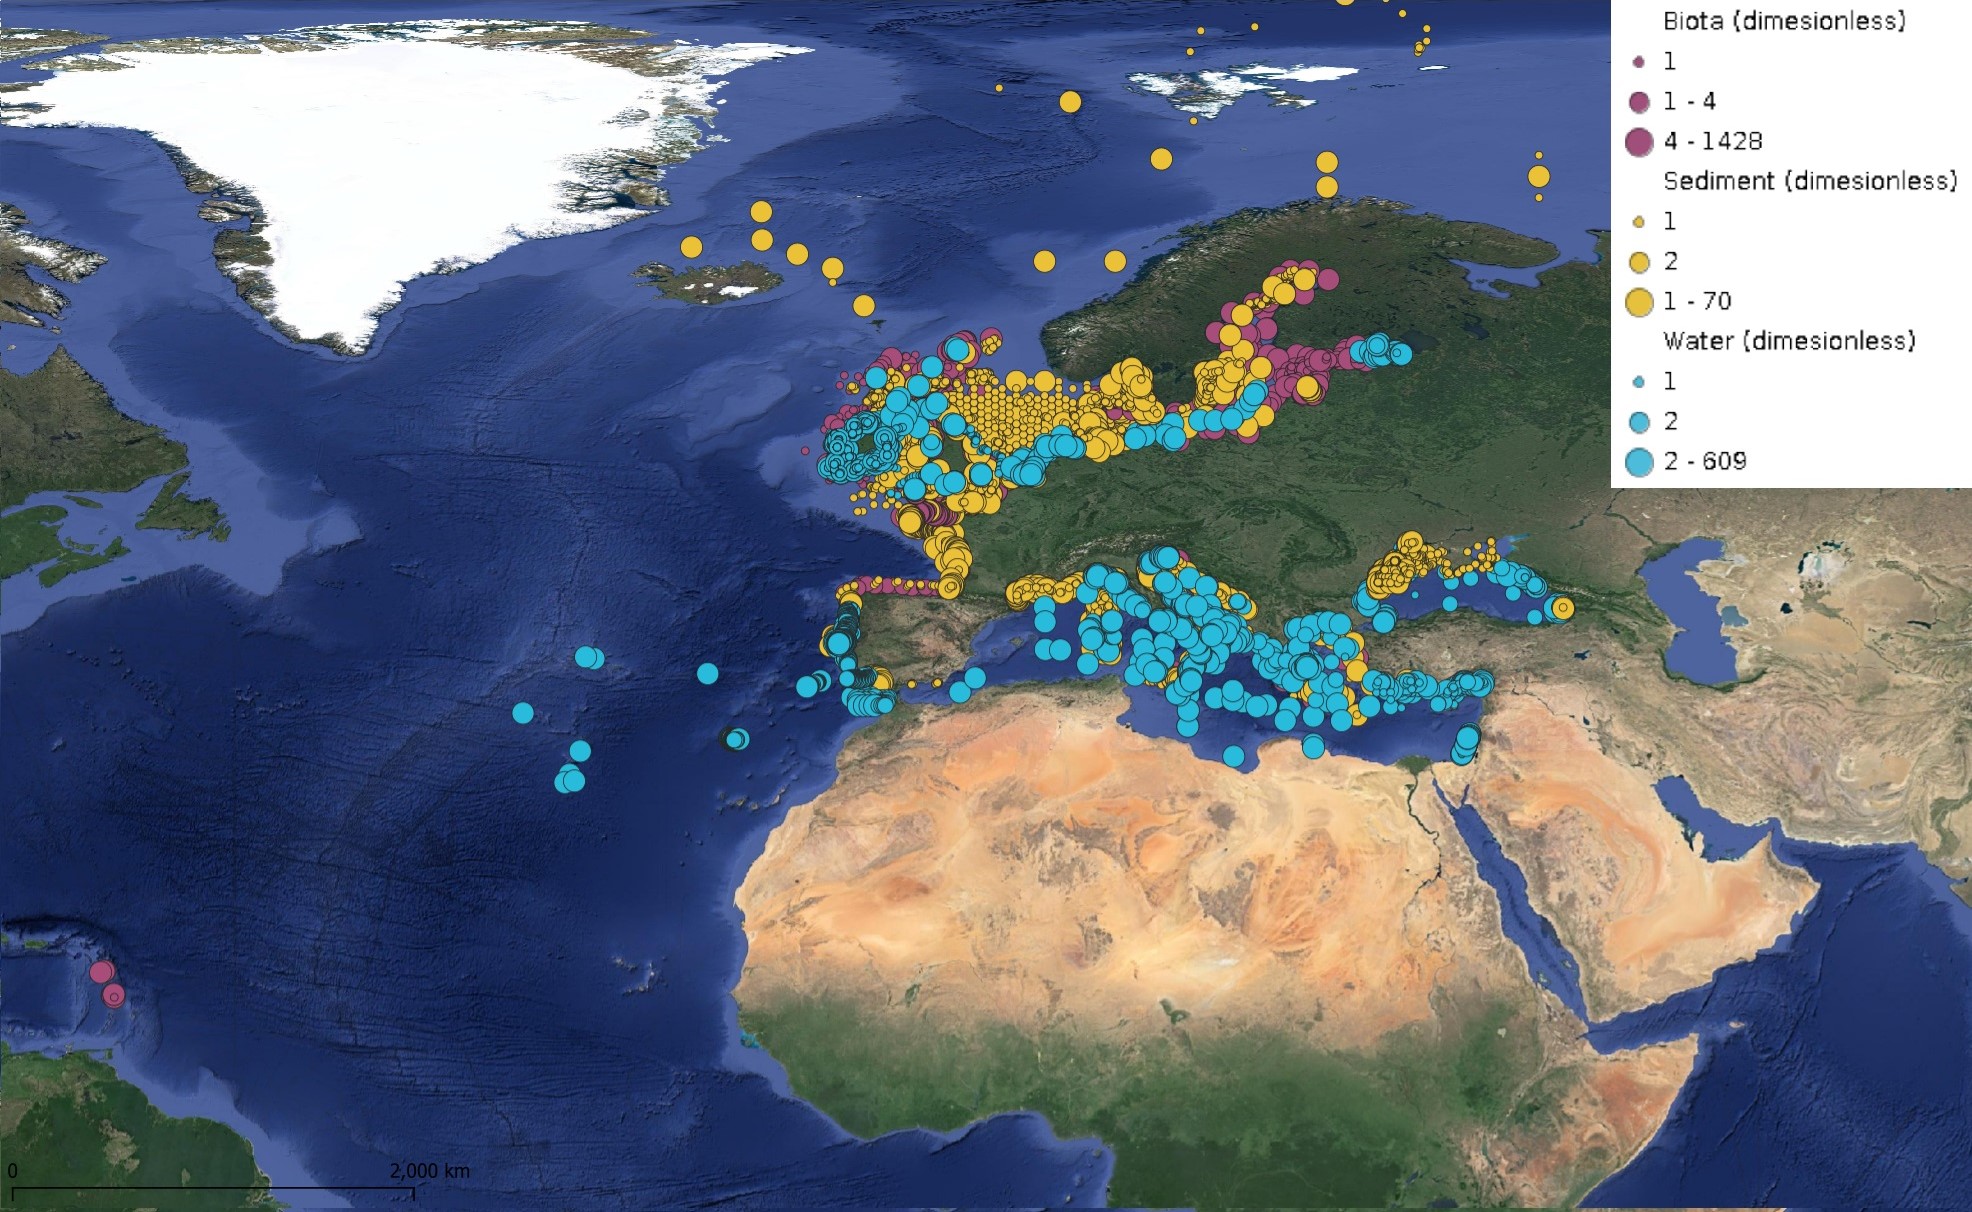
This product displays for Cadmium, positions with values counts that have been measured per matrix and are present in EMODnet regional contaminants aggregated datasets, v2024. The product displays positions for all available years.
-
This product displays for Triphenyltin, median values of the last 6 available years that have been measured per matrix and are present in EMODnet regional contaminants aggregated datasets, v2022. The median values ranges are derived from the following percentiles: 0-25%, 25-75%, 75-90%, >90%. Only "good data" are used, namely data with Quality Flag=1, 2, 6, Q (SeaDataNet Quality Flag schema). For water, only surface values are used (0-15 m), for sediment and biota data at all depths are used.
-
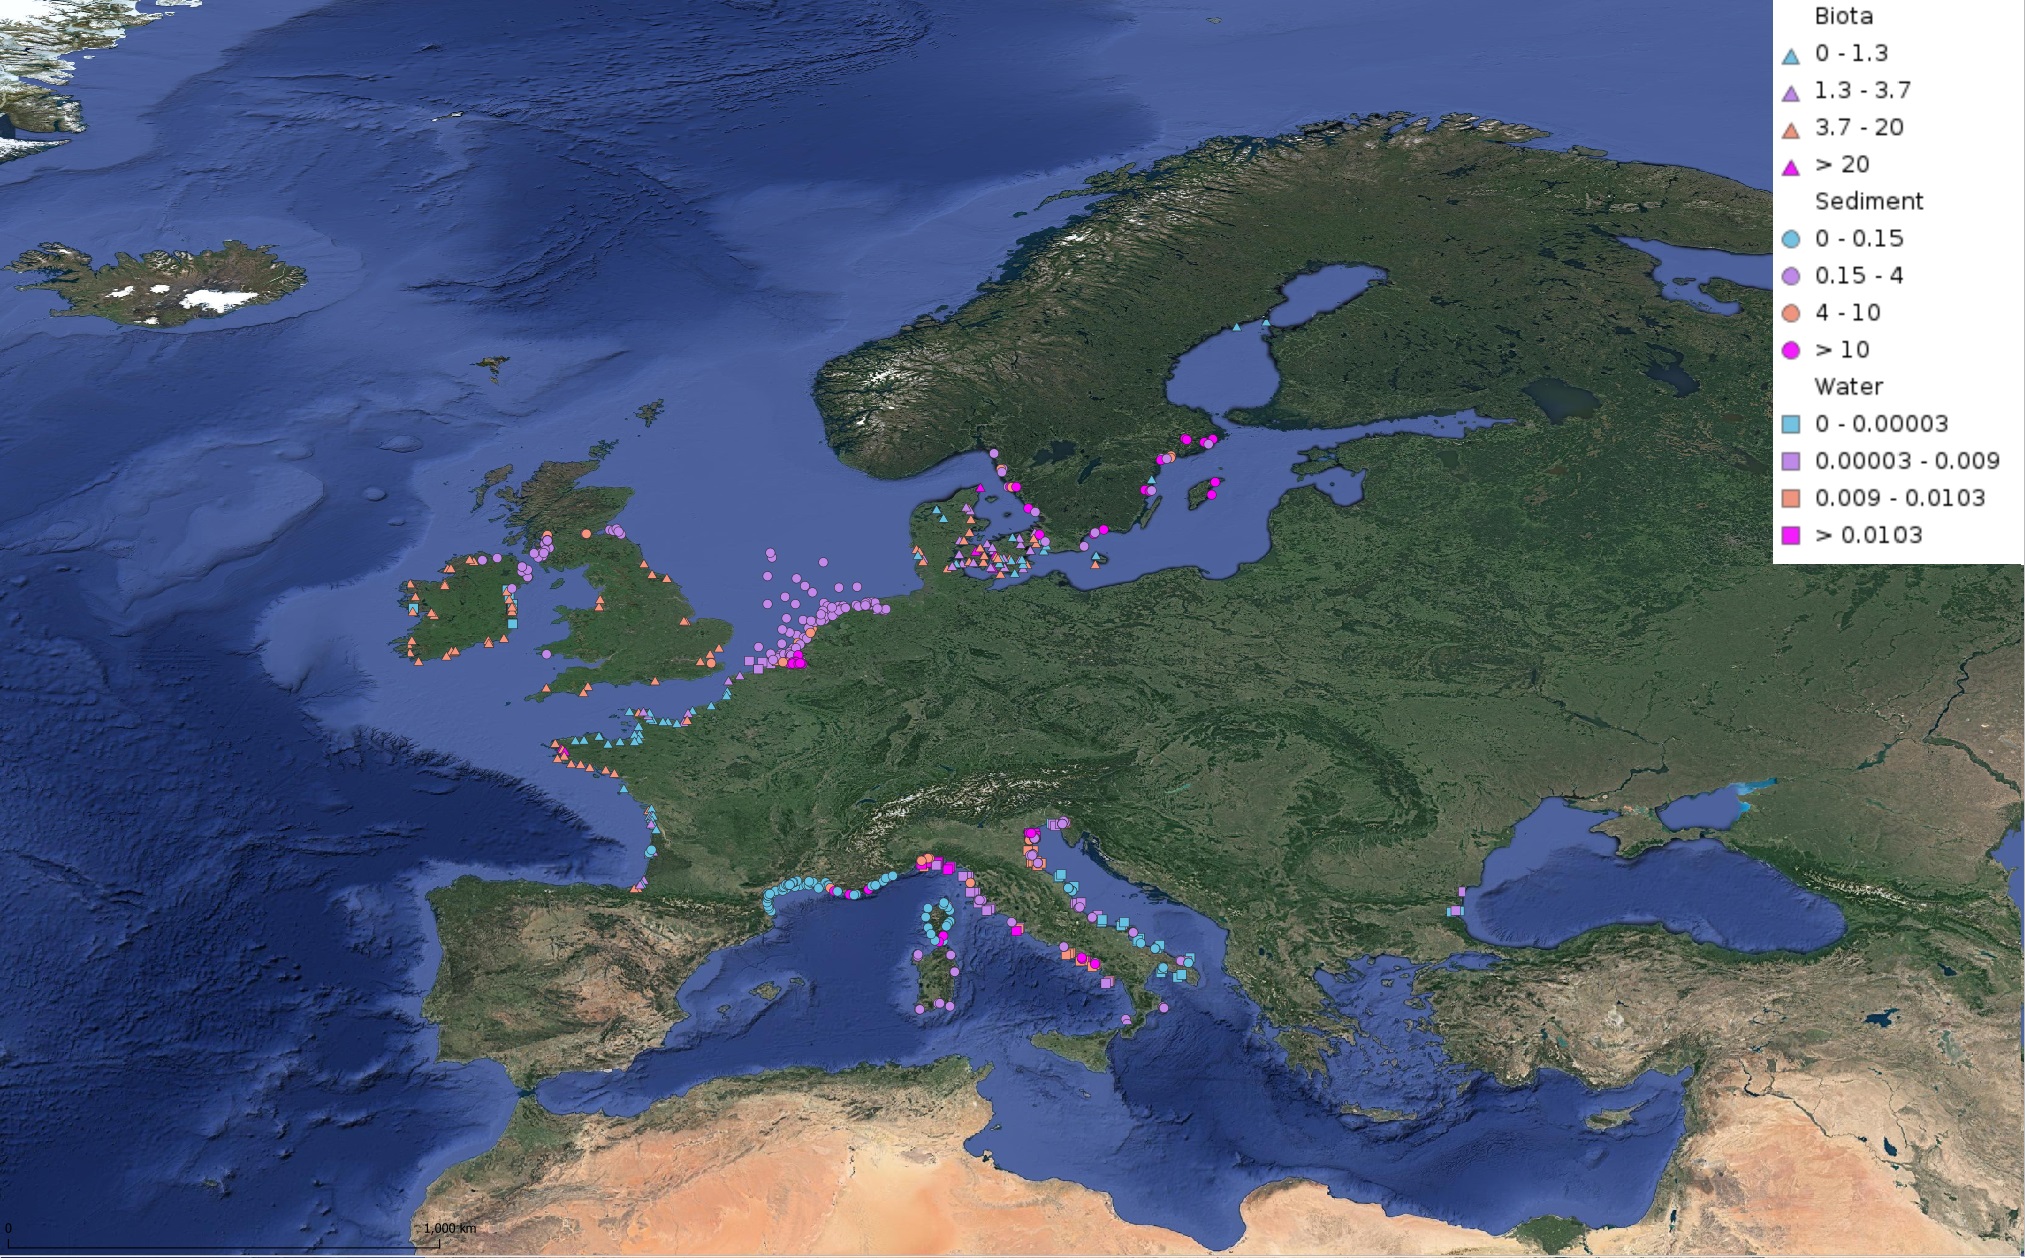
This product displays for Tributyltin, median values of the last 6 available years that have been measured per matrix and are present in EMODnet regional contaminants aggregated datasets, v2022. The median values ranges are derived from the following percentiles: 0-25%, 25-75%, 75-90%, >90%. Only "good data" are used, namely data with Quality Flag=1, 2, 6, Q (SeaDataNet Quality Flag schema). For water, only surface values are used (0-15 m), for sediment and biota data at all depths are used.
-
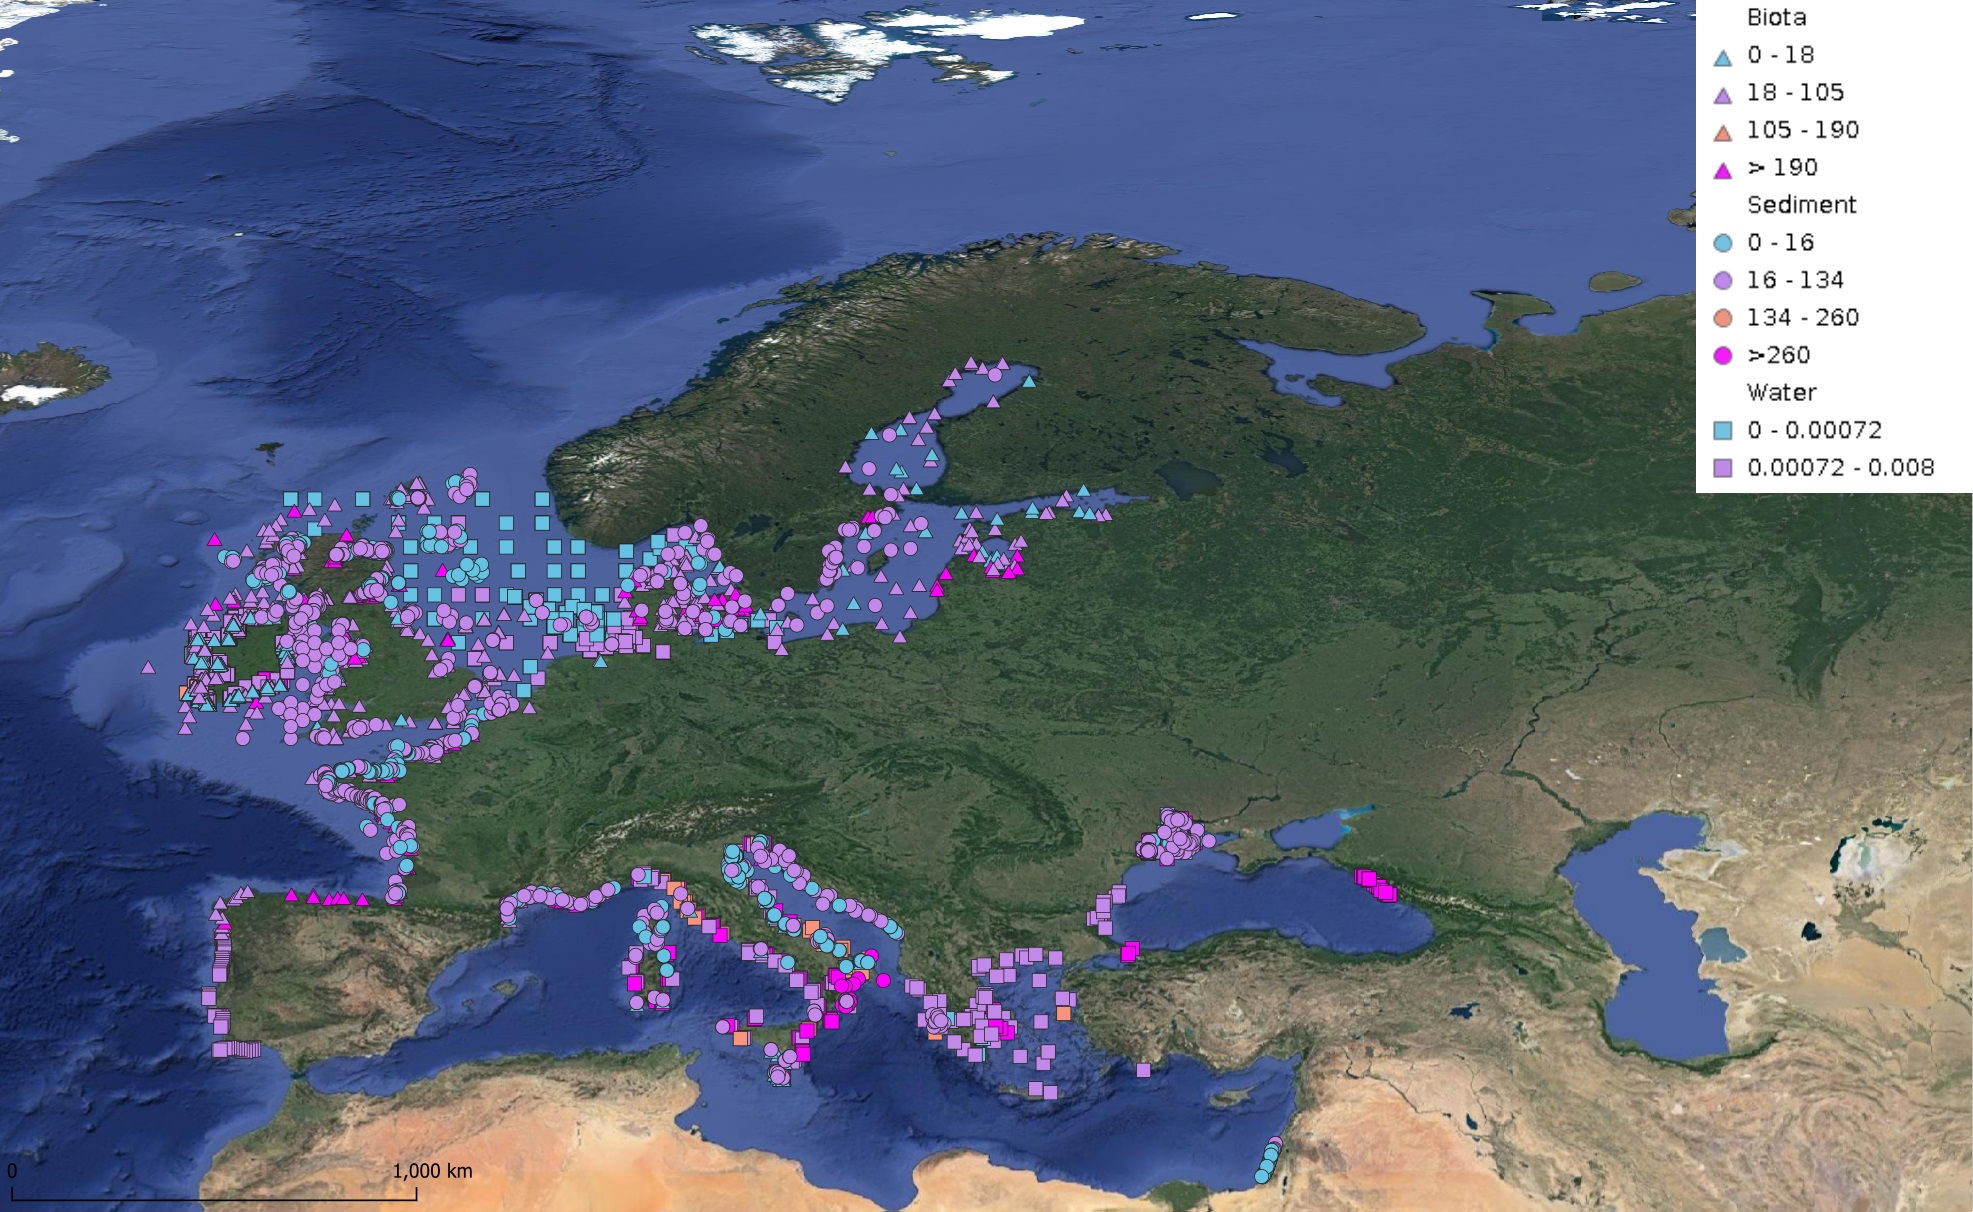
This product displays for Naphthalene, median values since 2012 that have been measured per matrix and are present in EMODnet regional contaminants aggregated datasets, v2024. The median values ranges are derived from the following percentiles: 0-25%, 25-75%, 75-90%, >90%. Only "good data" are used, namely data with Quality Flag=1, 2, 6, Q (SeaDataNet Quality Flag schema). For water, only surface values are used (0-15 m), for sediment and biota data at all depths are used.