 Arctic SDI catalogue
Meteorological data
Type of resources
Available actions
Topics
Keywords
Contact for the resource
Provided by
Formats
Representation types
Update frequencies
status
-

This dataset includes daily averages of solar irradiance on tilted surfaces for all of Canada based on the period of 1998 - 2022. Daily averages of solar irradiance are displayed on both a monthly and annual basis for ten different tilt and tracking methods relative to the ground (horizontal) and latitude of the location. The daily averages were derived from multi-year satellite-derived solar resource datasets at an hourly temporal resolution and gridded geospatial resolution of approximately 10 km by 10 km. The data can be used to further assess the potential of solar energy technologies in Canada, including solar photovoltaics (PV) for electricity and solar thermal for domestic hot water and space heating. Maps of solar resource potential in Canada – Data Format The data stored in these files includes the daily-average insolation on tilted surfaces in units of kW·hr/m² for a given period. Each band represents period, numbered in order: band 1 = Annual, band 2 = January, band 3 = February, ..., band 13 = December. The period of averaging is the year 1998-2022, inclusive. Four fixed tilted surfaces of 0° (horizontal), 30°, 60°, and 90° (vertical) relative to the horizontal plane: - fixed tilted surfaces of 0° (vertical) relative to the horizontal plane (H+ 00 S+00) - fixed tilted surfaces of 30° (vertical) relative to the horizontal plane (H+ 30 S+00) - fixed tilted surfaces of 60° (vertical) relative to the horizontal plane (H+ 60 S+00) - fixed tilted surfaces of 90° (vertical) relative to the horizontal plan (H+ 90 S+00) Three fixed tilted surfaces of 0°, +15°, and -15°, relative to the local latitude: - fixed tilted surfaces of 0° relative to the local latitude (L+00 S+00) - fixed tilted surfaces of +15°, relative to the local latitude (L+00 S+00) - fixed tilted surfaces of -15°, relative to the local latitude (L+00 S+00) - A two-axis tracking surface that follows the sun throughout the day (T+00 T+00) - A single-axis tracking surface with the axis aligned north-south, tracking the sun east to west (A+00_S+90) - A single-axis tracking surface with the axis aligned east-west, tracking the sun's elevation (A+00_S+00)
-
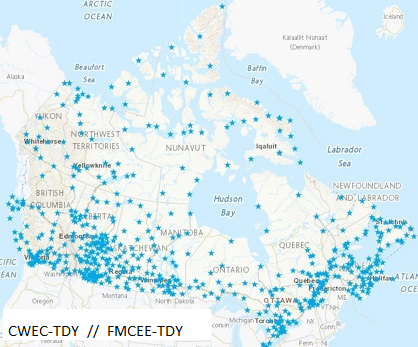
644 datasets of Typical Meteorological Years (TMY) created by joining twelve Typical Meteorological Months selected from a database of up to 20 years of CWEEDS hourly data. The months are chosen by statistically comparing individual monthly means with long-term monthly means for daily total global solar irradiance, mean, minimum and maximum dry bulb temperature, mean, minimum and maximum dew point temperature, and mean and maximum wind speed. These hourly datasets are used by the engineering and scientific community mainly as inputs for solar system design and analysis and building energy systems analysis tools. This dataset has been updated with the most recent changes made in March 2023. The solar values in these files are based on 0.1° x 0.1° (11 km x 11 km grid) for all of Canada. Refer to Data Resources below for additional information on the TMY file format.
-

644 datasets of hourly meteorological data for all of Canada from various periods (1998 to 2020). The values of the records for solar irradiance are primarily based on satellite-derived solar estimates. This dataset has been updated with the most recent changes made in March 2023. The solar values in these files are based on 0.1° x 0.1° (11 km x 11 km grid) for all of Canada. Refer to Data Resources below for additional information on the CWEEDS file format and revision history.
-
The Canadian Seasonal to Inter-annual Prediction System (CanSIPS) carries out physics calculations to arrive at probabilistic predictions of atmospheric elements from the beginning of a month out to up to 12 months into the future, resulting in seasonal forecasts. Atmospheric elements include temperature, precipitation, wind speed and direction and others. This product contains raw numerical results of these calculations. Geographical coverage is global. Data is available on a grid at a horizontal resolution of 2.5 degrees and 1 degree and for a few selected vertical levels. In addition, forecast probabilities for below, near, and above normal temperature and precipitation are available at both resolutions. Predictions and corresponding hindcast are made available monthly.
-

The Regional Deterministic Precipitation Analysis (RDPA) produces a best estimate of the amount of precipitation that occurred over recent past periods of 6 or 24 hours. The estimate integrates data from in situ precipitation gauge measurements, weather radar, satellite imagery and numerical weather prediction models. Geographic coverage is North America (Canada, United States and Mexico). Data is available at horizontal resolution of 10 km. Data is only available for the surface level. Analysis data is made available four times a day for 6h intervals and twice a day for the 24h interval. A preliminary estimate is available approximately 1h after the end of the accumulation period, and revised 7h after in order to assimilate gauge data arriving later.
-

The Canadian Precipitation Analysis System (CaPA) produces a best estimate of 6 and 24 hour precipitation amounts. This objective estimate integrates data from in situ precipitation gauge measurements, radar QPEs and a trial field generated by a numerical weather prediction system. In order to produce the High Resolution Deterministic Precipitation Analysis (HRDPA) at a resolution of 2.5 km, CaPA is connected to the continental HRDPS for its trial field. CaPA-HRDPA produces four analyses of 6 hour amounts per day, valid at synoptic hours (00, 06, 12 and 18 UTC) and two 24 hour analyses valid at 06 and 12 UTC. A preliminary production is started 1 hour after valid time and a final one is launched 7 hours later. This translates into a production of 12 analyses per day.
-

The Regional Deterministic Precipitation Analysis (RDPA) produces a best estimate of precipitation amounts that occurred over a period of 24 hours. The estimate integrates data from in situ precipitation gauge measurements, weather radar, satellite imagery and numerical weather prediction models. Geographic coverage is North America (Canada, United States and Mexico). Data is available at a horizontal resolution of 10 km. The 24 hour analysis is produced twice a day and is valid at 06 and 12 UTC. A preliminary analysis is available approximately 1 hour after the end of the accumulation period and a final one is generated 7 hours later in order to assimilate more gauge data.
-

The Regional Deterministic Precipitation Analysis (RDPA) produces a best estimate of precipitation amounts that occurred over a period of 6 hours. The estimate integrates data from in situ precipitation gauge measurements, weather radar, satellite imagery and numerical weather prediction models. Geographic coverage is North America (Canada, United States and Mexico). Data is available at a horizontal resolution of 10 km. The 6 hour analysis is produced 4 times a day and is valid at 00, 06, 12 and 18 UTC. A preliminary analysis is available approximately 1 hour after the end of the accumulation period and a final one is generated 7 hours later in order to assimilate more gauge data.
-
The Global Environmental eMuLator (GEML) is a component of the experimental Global Deterministic Prediction System (GDPS) and is an artificial intelligence (AI)-based weather emulator trained on past atmospheric states. More specifically, this GEML model is based on data compatible with the ¼°, 13-level version of the GraphCast model (Lam et al. 2023) from DeepMind. It was trained and refined by ECCC, using ECMWF's ERA5 data (1979-2016) and operational analyses (2016-2021). The weights have been recalculated and are also available to the public. Forecasts are carried out twice daily, each with a 10-day lead time. It generates the reference large-scale temperature and horizontal wind fields, toward which GDPS's GEM forecasts are spectrally nudged. The geographical coverage is global with a horizontal resolution of 28 km. Data is available on 13 pressure levels, and employs a uniform latitude-longitude grid with 0.25-degree grid resolution. Six atmospheric variables defined on the 13 pressure levels, along with 4 surface variables are available every 6 hours.
-

WCPS-coupled forecast is the component in the Water Cycle Prediction System (WCPS) that provides the coupled atmosphere-ocean-sea ice forecasts at a 1km resolution (0.008 x 0.008 degree) over the Great Lakes, St. Lawrence River and the Gulf of St. Lawrence. It launches 4 times a day at 00, 06, 12, and 18 UTC and produces 84 hours forecast, based on the atmospheric model GEM, coupled with the ocean-ice model NEMO-CICE. The products from WCPS-coupled forecasts are (1) GEM : surface air temperatures, surface wind velocities, and surface runoff (2) NEMO-CICE : variety of lake/ocean sea ice variables, for example, lake levels and temperatures. They are designed to help forecasters issuing bulletins and warnings in ice-infestested waters for navigation, water level alert, emergency response, Search and Rescue, and CIS Sea Ice forecast.