 Arctic SDI catalogue
Snow
Type of resources
Available actions
Topics
Keywords
Contact for the resource
Provided by
Years
Formats
Representation types
Update frequencies
status
Service types
-

This catalog contains annual 30 m spatial resolution snow dynamics metrics for each snow-year from 2018-2019 to 2023-2024 for all of Canada. We gather all Landsat and Sentinel-2 images collected over Canada and identify the status of each pixel observation on the image collection date: snow (and ice), non-snow (i.e., land, water), unclear (i.e., clouds, shadows). We built an algorithm to calculate snow cover metrics for each pixel during each winter: start date of the first (and biggest) snow period [startF, startB], end date of the last (and biggest) snow period [endL, endB], number of days with snow cover in total (or in the biggest snow period) [lengthT, lengthB], number of snow periods (i.e., separated times with multiple confirmed snow observations) [periods], and a status classification (e.g., continuous snow, snow free) [status]. We do not obtain a clear observation every day because of satellite orbit frequencies and clouds. This means that timing-based metrics are identified by the middle date between two clear observations, with uncertainty quantified as half the length of the gap (i.e., ± days) [startF_u, startB_u, endL_u, endB_u, lengthT_u, lengthB_u].
-

Polygonal layer of public and private buildings on the territory of the city of Shawinigan. ! [Shawinigan logo] (https://jmap.shawinigan.ca/doc/photos/LogoShawinigan.jpg) **Collection context** Attribute information updated in 2012 following a study carried out by the Fire Department **Collection method** As soon as there is a new orthophotography, digitization of buildings. (2025) + Addition of a schematic building footprint from the main residential building permits issued **Attributes** * _objectid_ (_OID_): * _type_building_ (_String_): Building type * _st_area (shape) _ (_Double_): * _st_length (shape) _ (_Double_): * _id_bat2012_ (_String_): * _matricle_ (_String_): * _address_ (_String_): Address * _flow_lpm_ (_Integrate_): * _gpm_speed_ (_Integrate_): * _numbers_and_ (_smallInteger_): * _roof_type_ (_String_): * _height_ (_Double_): * _usage__ (_String_): * _location_ (_String_): * _batime_name_ (_String_): * _sprinklers_ (_String_): * _distance_bf_ (_String_): Fountain terminal * _barrack_distance_ (_String_): * _barrack_ (_String_): Barracks * _building_id_ (_smallInteger_): * _snow_permit_ (_String_): * _distance_bf_seche_ (_String_): Dry terminal For more information, consult the metadata on the Isogeo catalog (OpenCatalog link).**This third party metadata element was translated using an automated translation tool (Amazon Translate).**
-
The dataset includes two data products derived from the Visible Infrared Imaging Radiometer Suite (VIIRS) imager operated by the US National Oceanic and Atmospheric Administration (NOAA) onboard Suomi National Polar-Orbiting Partnership (SNPP) satellite: 1) Normalized Difference Vegetation Index (NDVI) 2) Snow Mask (Snow) with supplementary information about data quality and scene identification Each product, NDVI and Snow, has been derived at two spatial resolutions: 1) I-band resolution for 250-m spatial grid (VIIRS image bands I1 and I2) 2) M-band resolution for 500-m spatial grid (VIIRS moderate resolution bands M5 and M7) Datasets are produced with a daily temporal frequency, i.e. one file per day. The study area with the size of 5,700 km × 4,800 km covers Canada and neighboring regions (Trishchenko, 2019). The VIIRS time series are produced from VIIRS /SNPP imagery at CCRS from January 1, 2017.
-

The daily climate records database, also known as Long Term Climate Extremes (LTCE), was developed to address the fragmentation of climate information due to station changes (opening, closing, relocation, etc.) over time. For approximately 750 locations in Canada, "virtual" climate stations have been developed by joining (threading) climate data for an urban location, from nearby stations to make long-term records. Each long-term record consists of the extremes (record values) of daily maximum/minimum temperatures, total precipitation and snowfall for each day of the year. Many of the longest data sets of extremes date as far back as the 1800s. This data provides the daily extremes of record for Snowfall for each day of the year. Daily elements include: Greatest Snowfall.
-
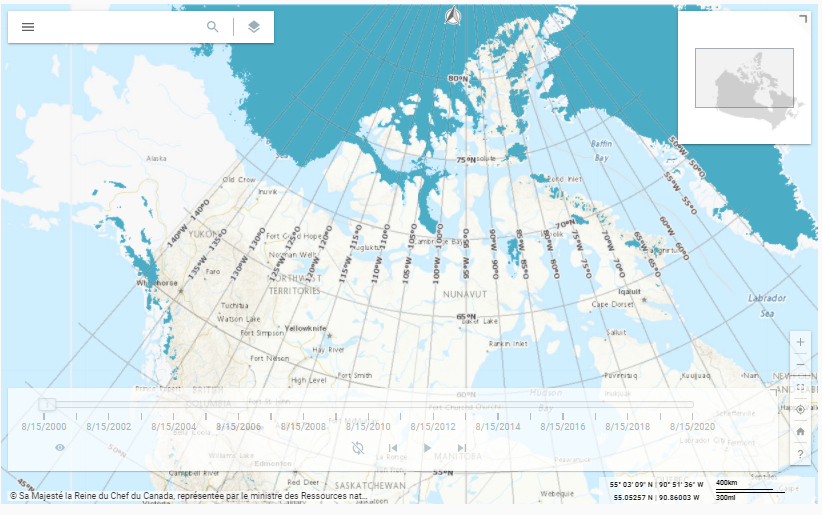
The Annual Minimum Snow and Ice (MSI) Extent of the Atlas of Canada National Scale Data, are data sets compiled containing annual data from 2000 to present. The data sets were derived from research published by the Canada Centre for Remote Sensing which classified satellite imagery over Canada and neighbouring regions for the continued presence or absence of snow and ice from April 1 to September 20 each year. The Atlas of Canada MSI products consist of a vector dataset and a raster time-series animation application. VECTOR DATASET The vector dataset has been generalized to display at the scale of 1:1,000,000. TIME-SERIES ANIMATION APPLICATION The time-series animation application has not been generalized from its original scale (250 m pixels). The application is disseminated through the Data Cube Platform, implemented by the Canada Centre for Mapping and Earth Observation, Natural Resources Canada using geospatial big data management techniques. These technologies enable the rapid and efficient visualization of high-resolution geospatial data and allow for the rapid generation of dynamically derived products. The time-series is also available as a Web Map Service (WMS) and Web Coverage Service (WCS). CREDIT Source data provided by Alexander P. Trishchenko, Canada Centre for Remote Sensing, Natural Resources Canada Metadata record: https://open.canada.ca/data/en/dataset/808b84a1-6356-4103-a8e9-db46d5c20fcf
-

The set contains geospatial data for snow removal sectors in the City of Montreal as well as the boroughs associated with them. The packages on the [snow disposal sites] (/city-of-montreal/depot-snow), the [contracts and transactions] (/city-of-montreal/contrats-transaction-de-neigement) are also available on the portal.**This third party metadata element was translated using an automated translation tool (Amazon Translate).**
-
Data set containing the list and location of snow disposal sites used by the City of Montreal during snow loading periods, including information on each site. The sets on [snow removal sectors] (/city-of-montreal/sector-deenigement), the [contracts and transactions] (/city-of-montreal/contrats-transaction-de-neigement) are also available on the portal.**This third party metadata element was translated using an automated translation tool (Amazon Translate).**
-
Location of free and paid parking lots available during snow removal operations. The data is also visible on the [311 Montreal] application (https://donnees.montreal.ca/fr/showcase/311-montreal-info-deneigement-alertes) and on the [map of snow removal operations] (https://montreal.ca/services/carte-des-operations-de-deneigement).**This third party metadata element was translated using an automated translation tool (Amazon Translate).**
-

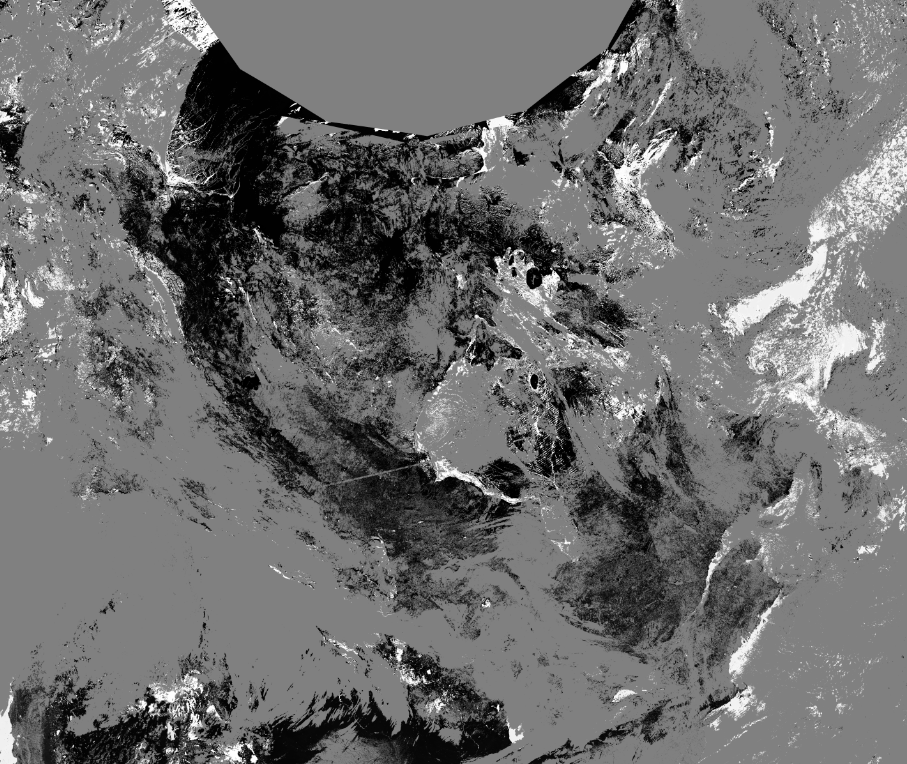
Snow and ice are important hydrological resources. Their minimum spatial extent here referred to as annual minimum snow/ice (MSI) cover, plays a very important role as an indicator of long-term changes and baseline capacity for surface water storage. The MSI probability is derived from sequence of seventeen 10-day clear-sky composites corresponding to April, 1 to September, 20 warm period for each year since 2000. Data from Moderate Resolution Imaging Spectroradiometer (MODIS) on Terra satellite for the period since 2000 have been processed with the special technology developed at the Canada Centre for Remote Sensing (CCRS) as described in Trishchenko, 2016; Trishchenko et al., 2016; 2009, 2006, Trishchenko and Ungureanu, 2021, Khlopenkov and Trishchenko, 2008, Luo et al., 2008. The presence of snow or ice is determined for each pixel of the image based on snow/ice scene identification procedure and the probability if computed for the entire warm season as a ratio of number of snow/ice flags to the total number of pixels available (less or equal to 17). The minimum snow and ice extent can be derived from the probability map by applying a certain threshold. New data version V5.0 replaces previous version V4.0 for all data available since 2000. All MSI files were reprocessed for all MODIS input data based on collection 6.1. The output format has not changed since previous version. It is described in Trishchenko (2024). The impact of input data change is small and can be detected only for time interval 2000-2015. Data starting 2016 has been already derived using MODIS collection 6.1 input. The differences between the MSI data based on MODIS Collection 5 (i.e. MSI V4) versus MODIS Collection 6.1 (i.e. MSI V5), on average, are quite small. The region-wide relative difference in the MSI extent varies from -3.97% to +1.75%. The mean value is -0.14%, the median value is 0.18% and standard deviation is 1.83%. As such, we do not expect any sizeable impact of the version change on our previous conclusions regarding trends and climate variations, except for refining the relative values of statistical parameters within the range of a few percents. References: TRISHCHENKO, A.P., 2024: Probability maps of the annual minimum snow and ice (MSI) presence over April,1 to September, 20 period since 2000 derived from MODIS 250m imagery over Canada and neighbouring regions. Data format description. CCRS, NRCan. 4pp.
-
This service contains snow plow routes for streets in Kingston, classified as Arterial, Collector and transit routes, and Residential. Created 01.30.15 ^CT