 Arctic SDI catalogue
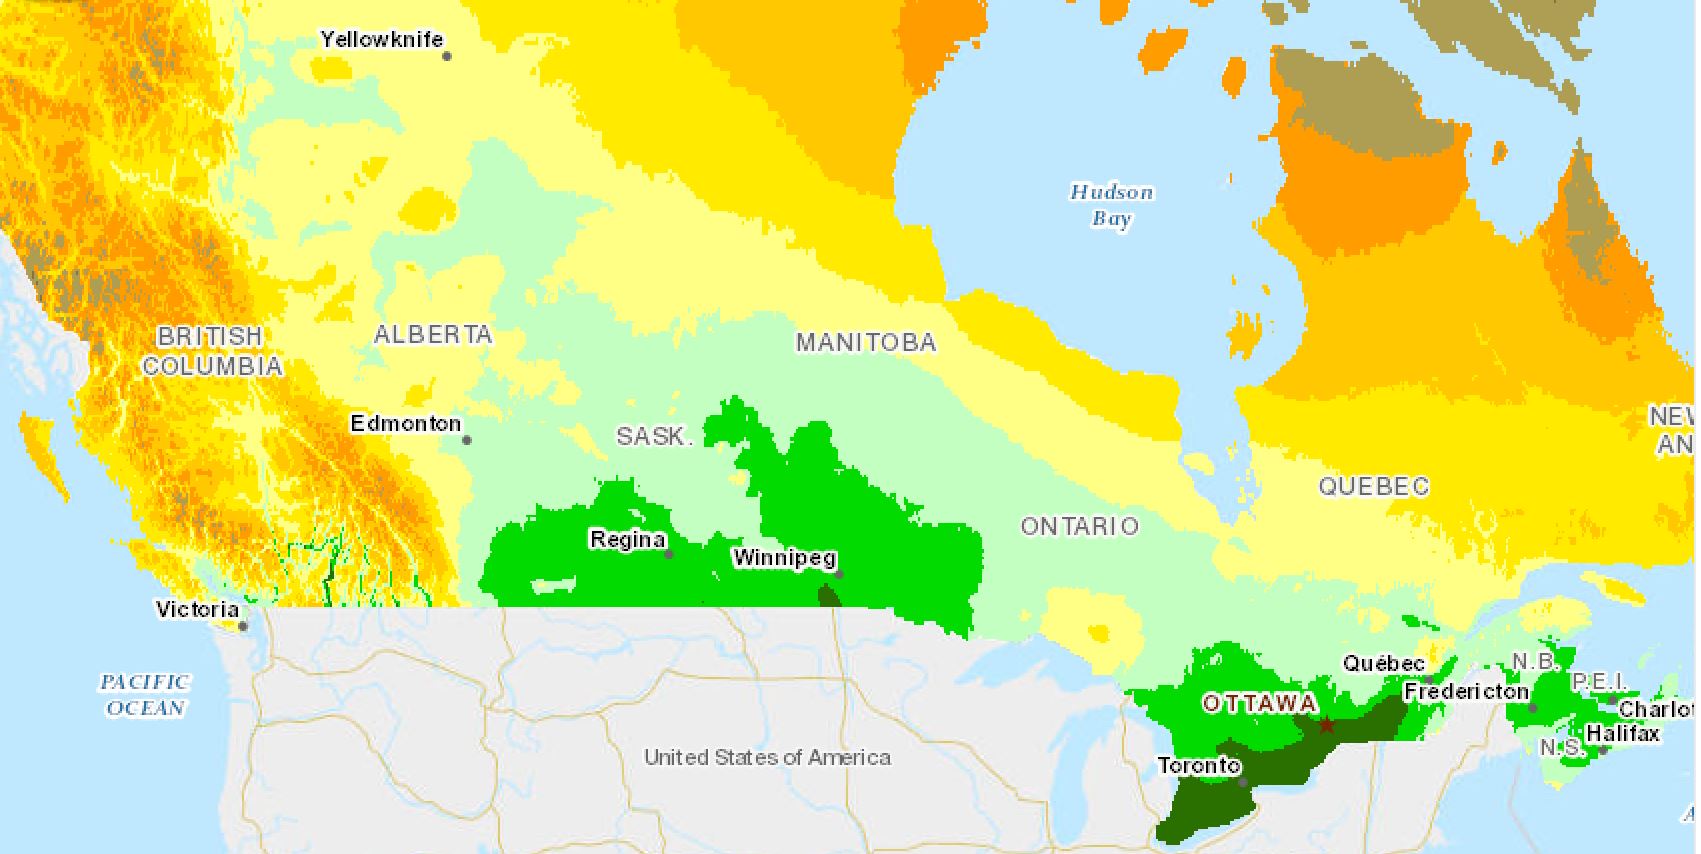
Precipitation
Type of resources
Available actions
Topics
Keywords
Contact for the resource
Provided by
Years
Formats
Representation types
Update frequencies
status
Service types
-
The Drought Impact Label dataset is used on all drought polygons from D1 to D4 to specify the longitude and magnitude of impacts. Impact labels are often used in association with the Drought Impact Line dataset. The impact labels are classified as follows: S – Short-Term, typically less than 6 months. L – Long-Term, typically more than 6 months. SL – A combination of Short and Long-Term impacts.
-
This series of datasets has been created by AAFC’s National Agroclimate Information Service (NAIS) of the Agro-Climate, Geomatics and Earth Observations (ACGEO) Division of the Science and Technology Branch. The Canadian Drought Monitor (CDM) is a composite product developed from a wide assortment of information such as the Normalized Difference Vegetation Index (NDVI), streamflow values, Palmer Drought Index, and drought indicators used by the agriculture, forest and water management sectors. Drought prone regions are analyzed based on precipitation, temperature, drought model index maps, and climate data and are interpreted by federal, provincial and academic scientists. Once a consensus is reached, a monthly map showing drought designations for Canada is digitized. AAFC’s National Agroclimate Information Service (NAIS) updates this dataset on a monthly basis, usually by the 10th of every month to correspond to the end of the previous month, and subsequent Canadian input into the larger North American Drought Monitor (NA-DM). The drought areas are classified as follows: D0 (Abnormally Dry) – represents an event that occurs once every 3-5 years; D1 (Moderate Drought) – represents an event that occurs every 5-10 years; D2 (Severe Drought) – represents an event that occurs every 10-20 years; D3 (Extreme Drought) – represents an event that occurs every 20-25 years; and D4 (Exceptional Drought) – represents an event that occurs every 50 years. Impact lines highlight areas that have been physically impacted by drought. Impact labels specify the longitude and magnitude of impacts. The impact labels are classified as follows: S – Short-Term, typically less than 6 months (e.g. agriculture, grasslands). L – Long-Term, typically more than 6 months (e.g. hydrology, ecology).
-
The Drought Impact Lines dataset highlights areas that have been physically impacted by drought. All drought impact lines have a drought impact label inside of them to express the longevity of the impact. The impact lines are classified using impact labels as follows: S – Short-Term, typically less than 6 months. L – Long-Term, typically more than 6 months. SL – A combination of Short and Long-Term impacts.
-
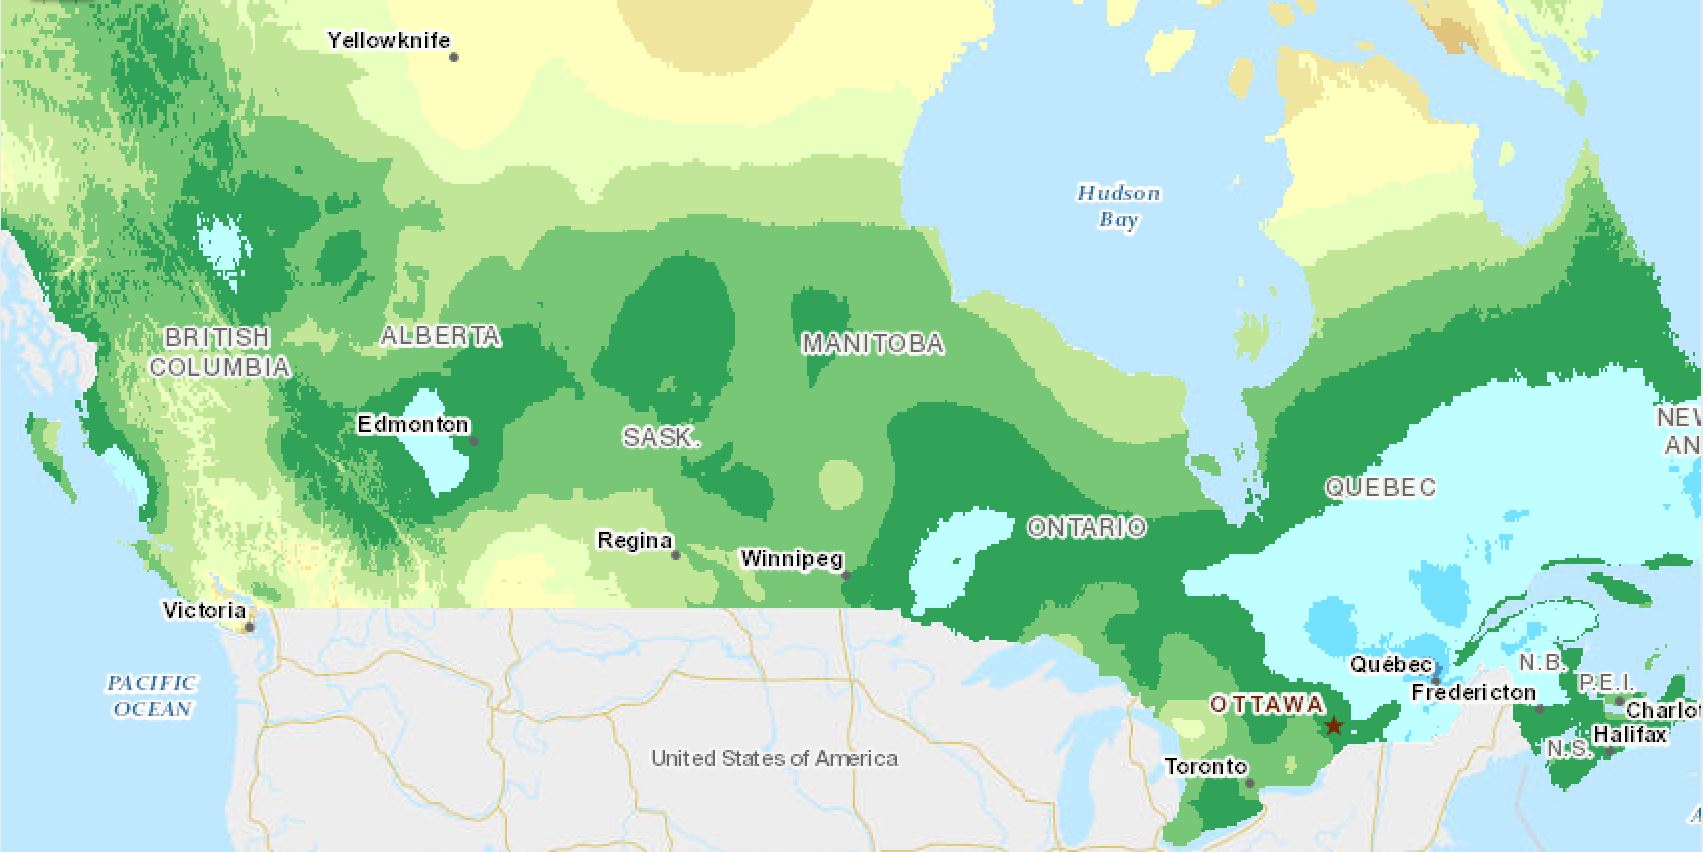
30-year Average precipitation represents the average amount (mm) of precipitation received in a month across a 30 year period (1961-1991, 1971-2000, 1981-2010, 1991-2020). These values are calculated across Canada in 10x10 km cells.
-
This data represents the dryness of the land surface based on vegetation conditions. The data is created weekly and uses weekly information on precipitation anomalies (namely the Standardized Precipitation Index or SPI) and satellite vegetation condition derived from Normalized Difference Vegetation Index (NDVI) from the MODIS Satellite. These dynamic data sets along with static data sets on land cover, soil water holding capacity, irrigation, ecozones and land surface elevation are used to model the drought severity, based on the Palmer Drought Severity Index (PDSI). The mapcubist model was trained on historical data and applied in real time to the dynamic inputs to produce drought severity ratings. The model is run at a 1km resolution and was developed by the AAFC, the United States Geological Survey and the United States Drought Monitor at the University of Nebraska Lincoln.
-
The Standardized Precipitation Index (SPI) is widely regarded as one of the most accessible tools for quantifying and reporting meteorological drought. At shorter timescales, SPI values are highly correlated with soil moisture, while at extended timescales, they reflect variations in groundwater and reservoir storage. The SPI model derives probability distributions from historical precipitation records, which are then normalized using an incomplete gamma function across multiple timescales. SPI values indicate the number of standard deviations the observed anomaly departs from the long-term period of record, with positive values corresponding to wetter-than-average conditions. Time periods calculated for monthly precipitation percentiles are 1, 2, 3, 6, 9, 12, 18, 24 months. Each ISO week is numbered from 1 to 52 (sometimes 53) within a year. An ISO week starts on Monday and ends on Sunday. Historical record goes back to 1980 Indices values were calculated using the xclim python package The National Agroclimate Series of Derived Indicators (NASDI) products provide a collection of comprehensive and regularly updated datasets on key agroclimatic variables, including accumulated precipitation, standardized precipitation index, and difference from normal temperature, among others. These datasets incorporate both real-time and historical climate information, offering enhanced insight into conditions and trends across Canada’s diverse agricultural regions.
-
The Nova Scotia Detailed Soil Survey dataset series at a scale of 1:50 000 consists of geo-referenced soil polygons with linkages to attribute data found in the associated Component File (CMP), Soil Names File (SNF) and Soil Layer File (SLF). Together, these Version 1 datasets describe the spatial distribution of soils and associated landscapes in Pictou County.
-
Growing Degree Days (GDDs) are used to estimate the growth and development of plants and insects during the growing season. Insect and plant development are very dependent on temperature and the daily accumulation of heat. The amount of heat required to move a plant or pest to the next development stage remains constant from year to year. However, the actual amount of time (days) can vary considerably from year to year because of weather conditions. Base temperatures are a point below which development does not occur for the organism in question. Base 10 temperatures are commonly used for grasshoppers and beans. These values are calculated across Canada in 10x10 km cells.
-

The “Soil Landscapes of Canada (SLC) Version 2.2” dataset series provides a set of geo-referenced soil areas (polygons) that are linked to attribute data found in the associated Component Table (CMP), Landscape Table (LAT), Carbon Layer Table (CLYR), and Dom/Sub File (DOM_SUB). Together, these datasets describe the spatial distribution of soils and associated landscapes for Canada.
-
Climatic variability plays a critical role in shaping Canada’s agricultural sector, influencing essential factors such as water availability, soil health, and both the yield and quality of crops. Shifts in temperature, distribution of rainfall, and increases in extreme weather events can severely disrupt agricultural operations, making continual environmental monitoring crucial. Canada’s vast and diverse agricultural regions require specialized, localized data to enable effective preparedness and resilience planning for farmers, policymakers, and rural communities; particularly in anticipating and managing drought and other climate-related risks. To address this need, National Agroclimate Series of Derived Indicators (NASDI) products provide a collection of comprehensive and regularly updated datasets on key agroclimatic variables, including accumulated precipitation, standardized precipitation index, and difference from normal temperature, among others. These datasets incorporate both real-time and historical climate information, offering enhanced insight into conditions and trends across Canada’s diverse agricultural regions.