 Arctic SDI catalogue
Océanographie
Type of resources
Keywords
Contact for the resource
Provided by
Years
Formats
Representation types
Update frequencies
status
Service types
-

CHS offers 500-metre bathymetric gridded data for users interested in the topography of the seafloor. This data provides seafloor depth in metres and is accessible for download as predefined areas.
-
CHS offers 500-metre bathymetric gridded data for users interested in the topography of the seafloor. This data provides seafloor depth in metres and is accessible for download as predefined areas.
-

PURPOSE: Freshwater discharge is used to force eastern Canadian ocean models DESCRIPTION: Neural network post-processed WRF-Hydro streamflow timeseries at 477 oceanic river outlets, where lat/lon are proxy position, riverlat/lon are outlet position, and oceanlat/lon are ocean pour points that are displaced slightly into the ocean (next to outlet position on the WRF-Hydro grid). The 477 eastern Canadian rivers were modelled using WRF-Hydro, which was forced by four CMIP models subject to WRF downscaling of atmospheric forcing. The four models are an NCAR Community Climate System Model (CCSM-4 SSP5 8.5) simulation (Meehl et al., 2012), two Met Office Hadley Centre Global Environmental Model (HadGEM2 SSP2 4.5 and SSP5 8.5) simulations (Collins et al., 2011), and a Max Planck Institute for Meteorology Earth System Model (MPI-ESM1.2-LR SSP5 8.5) simulation (Mauritsen et al., 2019). Variables and their descriptions are included in the NetCDF file. USE LIMITATION: To ensure scientific integrity and appropriate use of the data, we would encourage you to contact the data custodian.
-
Canadian Hydrographic Service (CHS) offers 500-metre bathymetric gridded data for users interested in the topography of the seafloor. This data provides seafloor depth in metres and is accessible for download as predefined areas. Le Service hydrographique du Canada offre des données bathymétriques carroyées de 500 mètres aux utilisateurs qui s’intéressent à la topographie des fonds marins. Ces données, qui peuvent être téléchargées, fournissent la profondeur en mètres de zones prédéfinies.
-
(La version française suit.) Canadian Hydrographic Service (CHS) offers 500-metre bathymetric gridded data for users interested in the topography of the seafloor. This data provides seafloor depth in metres and is accessible for download as predefined areas. Notice for your safety: Please note that data obtained from this site is not suitable for navigation. Only official charts issued by or on the authority of the Canadian Hydrographic Service meet the requirements of the Charts and Nautical Publications Regulations, 1995. Le Service hydrographique du Canada offre des données bathymétriques carroyées de 500 mètres aux utilisateurs qui s’intéressent à la topographie des fonds marins. Ces données, qui peuvent être téléchargées, fournissent la profondeur en mètres de zones prédéfinies. Pour votre sécurité : veuillez prendre note que les données obtenues depuis ce site ne conviennent pas à la navigation. Seules les cartes marines officielles diffusées par le Service hydrographique du Canada répondent aux exigences du Règlement sur les cartes marines et les publications nautiques (1995).
-
Canadian Hydrographic Service (CHS) offers 500-metre bathymetric gridded data for users interested in the topography of the seafloor. This data provides seafloor depth in metres and is accessible for download as predefined areas. Le Service hydrographique du Canada offre des données bathymétriques carroyées de 500 mètres aux utilisateurs qui s’intéressent à la topographie des fonds marins. Ces données, qui peuvent être téléchargées, fournissent la profondeur en mètres de zones prédéfinies.
-
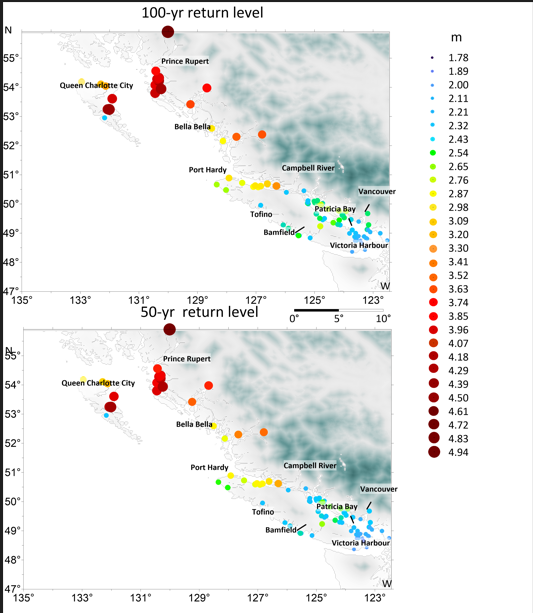
This dataset provides 30-year, 50-year, and 100 year return levels for small craft harbours in British Columbia, relative to the mean sea level over 1993-2020. The return levels are derived from coastal sea levels for the period from 1993 to 2020, simulated using a high-resolution Northeast Pacific Ocean Model (NEPOM).
-

A systematic oceanographic monitoring program was initiated in September 1989 at twenty-five monitoring stations in the Passamaquoddy Bay area and approaches by Dr. Shawn Robinson based out of the St. Andrews Biological Station (SABS). Stations were established in a uniform grid pattern of two arcminutes latitude and longitude over the study area in order to develop a database on the spatial patterns of water properties. Monthly measurements of the water column for the temperatures and salinity at all stations was completed using a Seacat SBE 19 internally recording CTD from Sea-bird Electronics Inc. The CTD was programmed to record conductivity, temperature, and depth at a frequency of 2 hz, corresponding to 2 measurements per meter of water depth. CTD casts were recorded for each of the 25 stations in the study area monthly using the R/V Pandalus, and later the CCGS Viola M. Davidson based out of SABS. The CTD was configured such that the sensors were oriented towards the benthos and the CTD was then attached to a hydraulic winch on the deck of the ship by a stainless steel cable one meter above a weight, and lowered 1 m below the water's surface in order for the CTD to equilibrate for one minute. The CTD was then lowered at 1 m/s to the benthos using a metered block on the winch to determine when the CTD had reached the maximum depth at that station. Once the weight had touched the bottom, the CTD was retrieved from the water, turned off, and placed in a bucket of fresh seawater in order to minimize equilibration time at the next station. Initially, the CTD measured salinity via water forced through the salinity cell with the drop rate of 1 m/s, but in August 1992, a pump was mounted on the CTD in order to provide a more consistent flow of water across the salinity cell. Surface temperatures were measured from bucket samples collected upon arriving at each station using a hand-held mercury thermometer at each station, and Secchi disk measurements were recorded. All data were downloaded from the CTD upon return to SABS using a DFO computer and the proprietary Sea-Soft software. Downcast data from each profile was retained, binned into 1 m intervals, and processed to remove data spikes, density inversions, and anomalies due to inadequate instrument equilibration. Processed data was then stored in the DFO's Oracle database (PTRAN) under the IMTA_SABS schema in the INVHYD and INVINF tables. Station numbers and locations are recorded in the CTD_STATIONS table in the IMTA_SABS schema. Cite this data: Robinson, S. Data of: Passamaquoddy Bay monthly Conductivity Temperature and Depth (CTD) sampling (1989 - 2018). Published: October 2019. Coastal Ecosystems Science Division, Fisheries and Oceans Canada, St. Andrews, NB. https://open.canada.ca/data/en/dataset/12184962-7879-4214-aef0-b31162f04a27
-

The Canadian Weathership Program collected meteorological data at Station Papa (50N, 145W) in the North Pacific Ocean between 1949 and 1981. In 2014, researchers at the University of Washington (UW) Applied Physics Laboratory (APL) and the National Oceanic and Atmospheric Administration (NOAA) Pacific Marine Environmental Laboratory (PMEL) analyzed this historic data to determine its efficacy as a scientific tool. The data available here are the Government of Canada data files that were utilized for this analysis. The "OWSP Full Data (1949-1981)" file contains the entire Canadian Weathership Program record of data collected from Station Papa and the "OWSP Daily Averaged Wind Speed and Wave Height Data (1949-1981)" file contains daily averaged values of wind speed and wave height generated by the UW APL and NOAA PMEL researchers. The Data Dictionary for each data file contains notes on any quality controls that were applied to the data by the UW APL and NOAA PMEL researchers. The UW documents titled, "Data Documentation for Dataset 1170 (DSI-1170), Surface Marine Data, National Climatic Data Center" (https://digital.lib.washington.edu/researchworks/bitstream/handle/1773/25570/td1170.pdf?sequence=6&isAllowed=y) and "Table detailing units of data values in each file" (https://digital.lib.washington.edu/researchworks/handle/1773/25570), provide further information on the key values, point scales, and other units that were used in these datasets.