 Arctic SDI catalogue
Eau
Type of resources
Available actions
Keywords
Contact for the resource
Provided by
Years
Formats
Representation types
Update frequencies
status
Service types
Scale
-

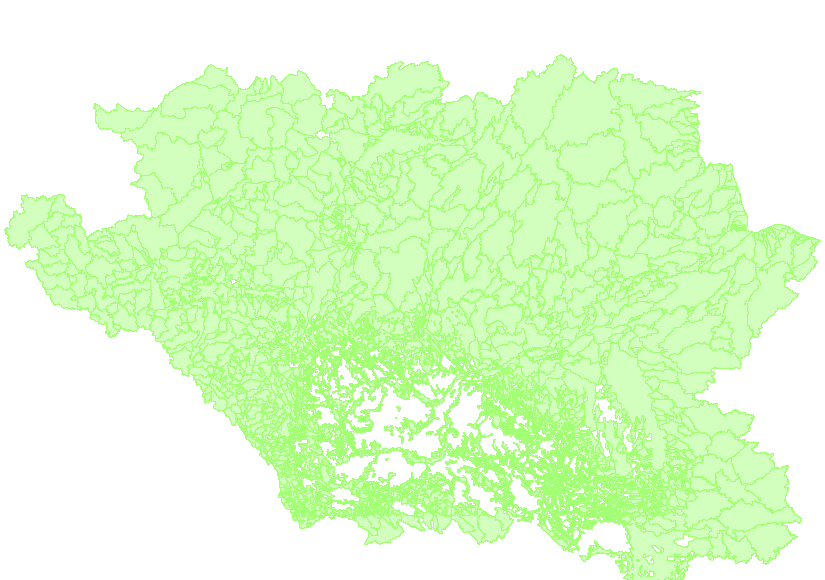
Mapping of linear watercourses in the territory of Quebec City.**This third party metadata element was translated using an automated translation tool (Amazon Translate).**
-
Mapping of open water courses located inside the islands of the Laval territory.**This third party metadata element was translated using an automated translation tool (Amazon Translate).**
-

The National Ecological Framework for Canada's "Land and Water Area by Province/Territory and Ecoprovince” dataset provides land and water area values by province or territory for the Ecoprovince framework polygon, in hectares. It includes codes and their English and French descriptions for a polygon’s province or territory, total area, land-only area and large water body area.
-
Ce produit fournit les données sur les eaux de ruissellement où chaque ligne de contour correspond à une quantité annuelle moyenne d’eau de ruissellement (en millimètres). Les données sur les eaux de ruissellement ont été dérivées des valeurs de débit provenant des stations hydrométriques ayant un débit naturel. Pour des raisons liées à la qualité ou à l’accessibilité des données, les données de certaines régions du pays ne sont pas offertes pour toutes les années. Les données couvrent la période de 1971 à 2013 pour le sud et de 1971 à 2004 pour le nord. Ces fichiers ont été produits par Statistique Canada, Division de la statistique de l’environnement, de l’énergie et des transports, 2017, basés sur des données d’Environnement et Changement climatique Canada, 2015, Relevés hydrologiques du Canada, Données hydrométriques archivées (HYDAT), www.ec.gc.ca/rhc- wsc/default.asp?lang=Fr&n=4EED50F1-1 (site consulté le 3 décembre 2015); C. Spence et A. Burke, 2008, « Estimates of Canadian Arctic Archipelago runoff from observed hydrometric data », Journal of Hydrology, vol. 362, p. 247 à 259. Pour en savoir plus sur la méthodologie, les résultats et les limites, veuillez consulter l’annexe D dans le document Statistique Canada, 2017, « L’eau douce au Canada, » L’activité humaine et l’environnement, Catalogue no 16-201-X. L’objet de l’ensemble de données est de présenter sur une carte nationale à l’échelle du 1 : 32 000 000 les quantités d’eau de ruissellement dérivées du modèle du rendement de l’eau de Statistique Canada. Ce produit est conçu pour être utilisé à des fins de référence ou de cartographie. Sa couverture est délimitée par les littoraux canadiens, tels qu’ils sont définis par les limites des régions de drainage fournies dans la carte 1.1 Régions de drainage du Canada. Le produit ne couvre pas les îles de l’Arctique. Il incombe aux utilisateurs de vérifier que le produit convient à l’utilisation prévue.
-

This set presents the geolocation as well as general information [of retention basins] (https://montreal.ca/articles/ouvrages-de-retention-limiter-les-rejets-deaux-usees-14459) on the Montreal territory whose construction has been completed.**This third party metadata element was translated using an automated translation tool (Amazon Translate).**
-

The "Hydrometric Gauging Stations of the AAFC Watersheds Project - 2013" dataset is a geospatial data layer containing point features representing the hydrometric gauging stations of the Agriculture and Agri-Food Canada (AAFC) Watersheds Project. The gauging stations are sourced from Environment Canada, the United States and Canadian provinces. Additional virtual stations have been generated to address hydrometric structural issues, like river confluences or lake inlets. Attribute information includes station identification, location and associated catchments/basins.
-

The “Sub-basins of the AAFC Watersheds Project – 2013” dataset is a geospatial data layer containing polygon features representing the Standard Drainage Area Classification (SDAC) 2003 defined sub-drainages of the Agriculture and Agri-Food Canada (AAFC) Watersheds Project. Canada has eleven major drainage areas which are divided into 164 sub-drainage areas. All drainage areas and sub-drainage areas are named and have an identifying ‘number’. Sub-drainage areas have ‘numbers’ that share a common ‘three-character’ designation. For example, the 05A sub-basin contains stations ‘numbered’ 05AB006 and 05AC007.
-

The “Gross and Effective Drainage Area Boundaries of the AAFC Watersheds Project - 2013” dataset is a geospatial data layer containing line features representing boundaries associated with the ‘incremental gross drainage areas’ of the Agriculture and Agri-Food Canada (AAFC) Watersheds Project. The project is subdivided by hydrometric gauging station. The maximum area that could contribute runoff to each station, less that of its upstream neighbour(s) is called its ‘incremental gross drainage area’. Two types of boundary are provided: ‘gross’ and ‘effective’. ‘Gross’ boundaries separate adjacent incremental gross drainage areas. ‘Effective’ boundaries delimit, within each incremental gross drainage area, the separation between areas that supply runoff, based on average runoff, from those that don’t.
-
The “Incremental Effective Drainage Areas of the AAFC Watersheds Project– 2013” dataset is a geospatial data layer containing polygon features representing the portions of each incremental gross drainage area of the Agriculture and Agri-Food Canada (AAFC) Watersheds Project that could be expected to contribute to surface runoff under average runoff conditions. An ‘incremental gross drainage area’ is a hydrometric gauging station's drainage basin, less that of the next upstream gauging station(s)’. ‘Effective drainage’ occurs in areas that are expected to supply surface runoff in an average runoff.