 Arctic SDI catalogue
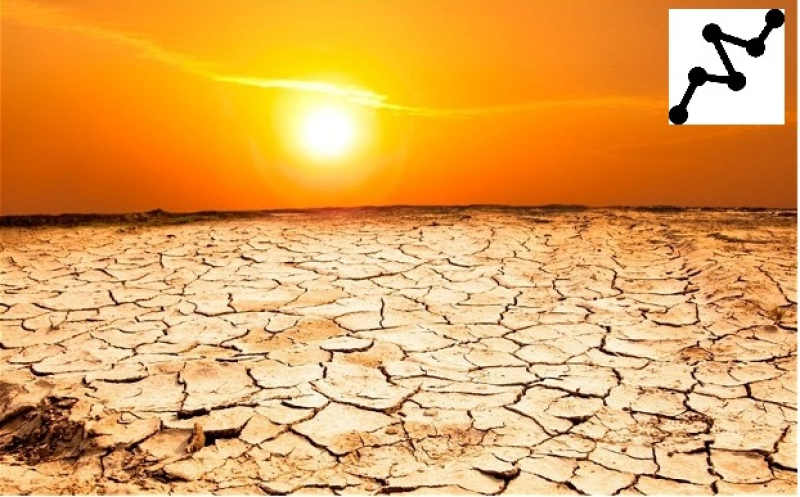
Précipitation
Type of resources
Available actions
Keywords
Contact for the resource
Provided by
Years
Representation types
Update frequencies
status
Service types
-
The Drought Impact Lines dataset highlights areas that have been physically impacted by drought. All drought impact lines have a drought impact label inside of them to express the longevity of the impact. The impact lines are classified using impact labels as follows: S – Short-Term, typically less than 6 months. L – Long-Term, typically more than 6 months. SL – A combination of Short and Long-Term impacts.
-
This series of datasets has been created by AAFC’s National Agroclimate Information Service (NAIS) of the Agro-Climate, Geomatics and Earth Observations (ACGEO) Division of the Science and Technology Branch. The Canadian Drought Monitor (CDM) is a composite product developed from a wide assortment of information such as the Normalized Difference Vegetation Index (NDVI), streamflow values, Palmer Drought Index, and drought indicators used by the agriculture, forest and water management sectors. Drought prone regions are analyzed based on precipitation, temperature, drought model index maps, and climate data and are interpreted by federal, provincial and academic scientists. Once a consensus is reached, a monthly map showing drought designations for Canada is digitized. AAFC’s National Agroclimate Information Service (NAIS) updates this dataset on a monthly basis, usually by the 10th of every month to correspond to the end of the previous month, and subsequent Canadian input into the larger North American Drought Monitor (NA-DM). The drought areas are classified as follows: D0 (Abnormally Dry) – represents an event that occurs once every 3-5 years; D1 (Moderate Drought) – represents an event that occurs every 5-10 years; D2 (Severe Drought) – represents an event that occurs every 10-20 years; D3 (Extreme Drought) – represents an event that occurs every 20-25 years; and D4 (Exceptional Drought) – represents an event that occurs every 50 years. Impact lines highlight areas that have been physically impacted by drought. Impact labels specify the longitude and magnitude of impacts. The impact labels are classified as follows: S – Short-Term, typically less than 6 months (e.g. agriculture, grasslands). L – Long-Term, typically more than 6 months (e.g. hydrology, ecology).
-
The Drought Impact Label dataset is used on all drought polygons from D1 to D4 to specify the longitude and magnitude of impacts. Impact labels are often used in association with the Drought Impact Line dataset. The impact labels are classified as follows: S – Short-Term, typically less than 6 months. L – Long-Term, typically more than 6 months. SL – A combination of Short and Long-Term impacts.
-
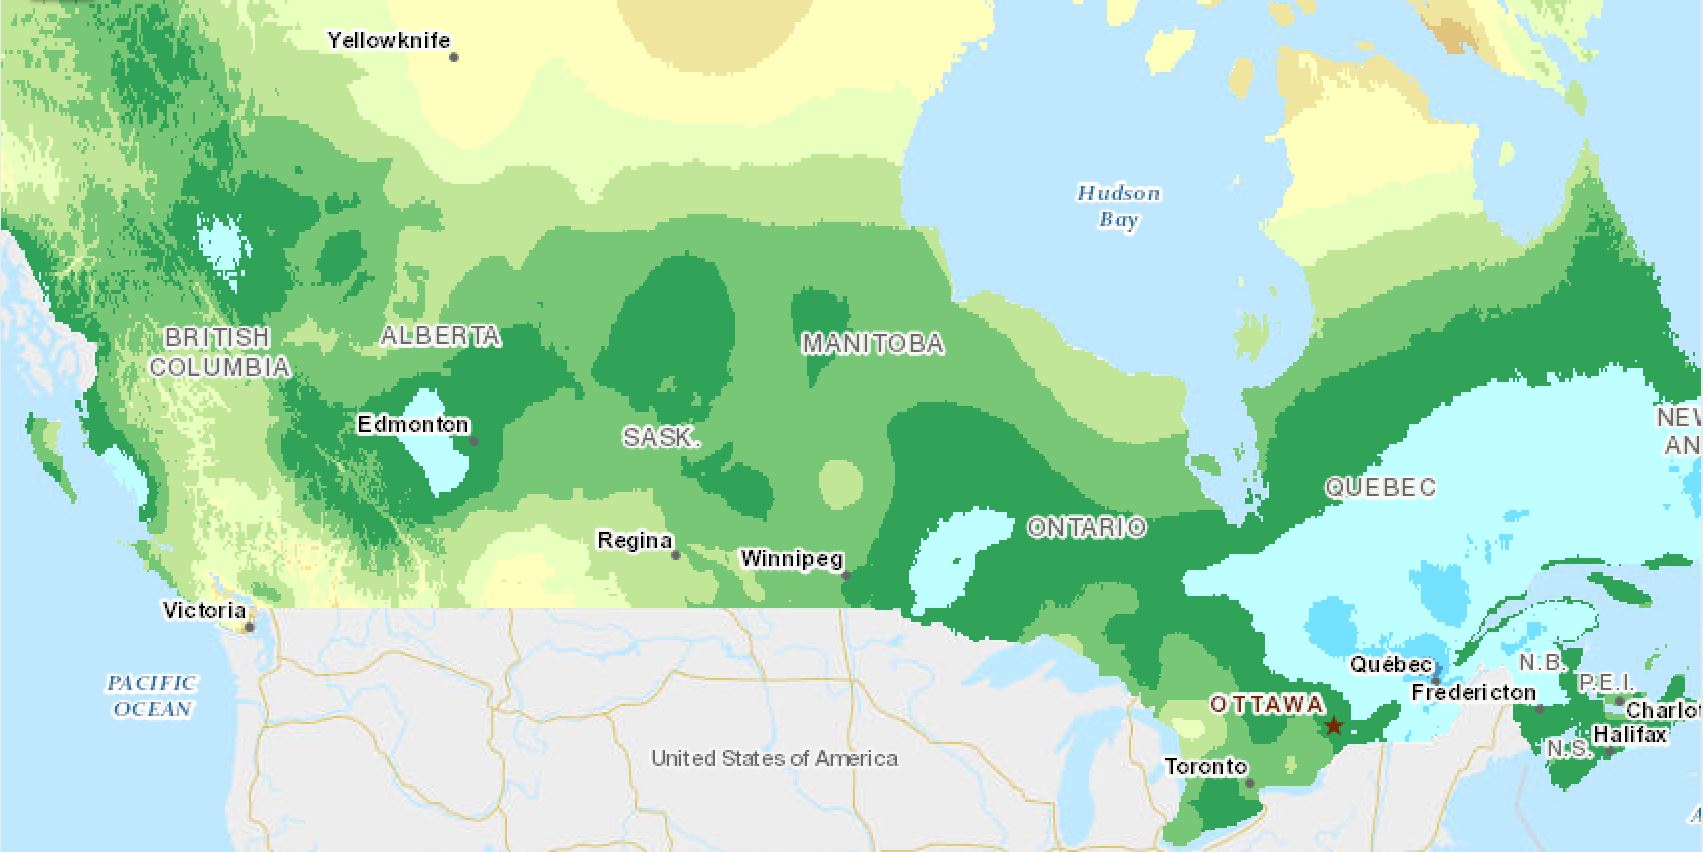
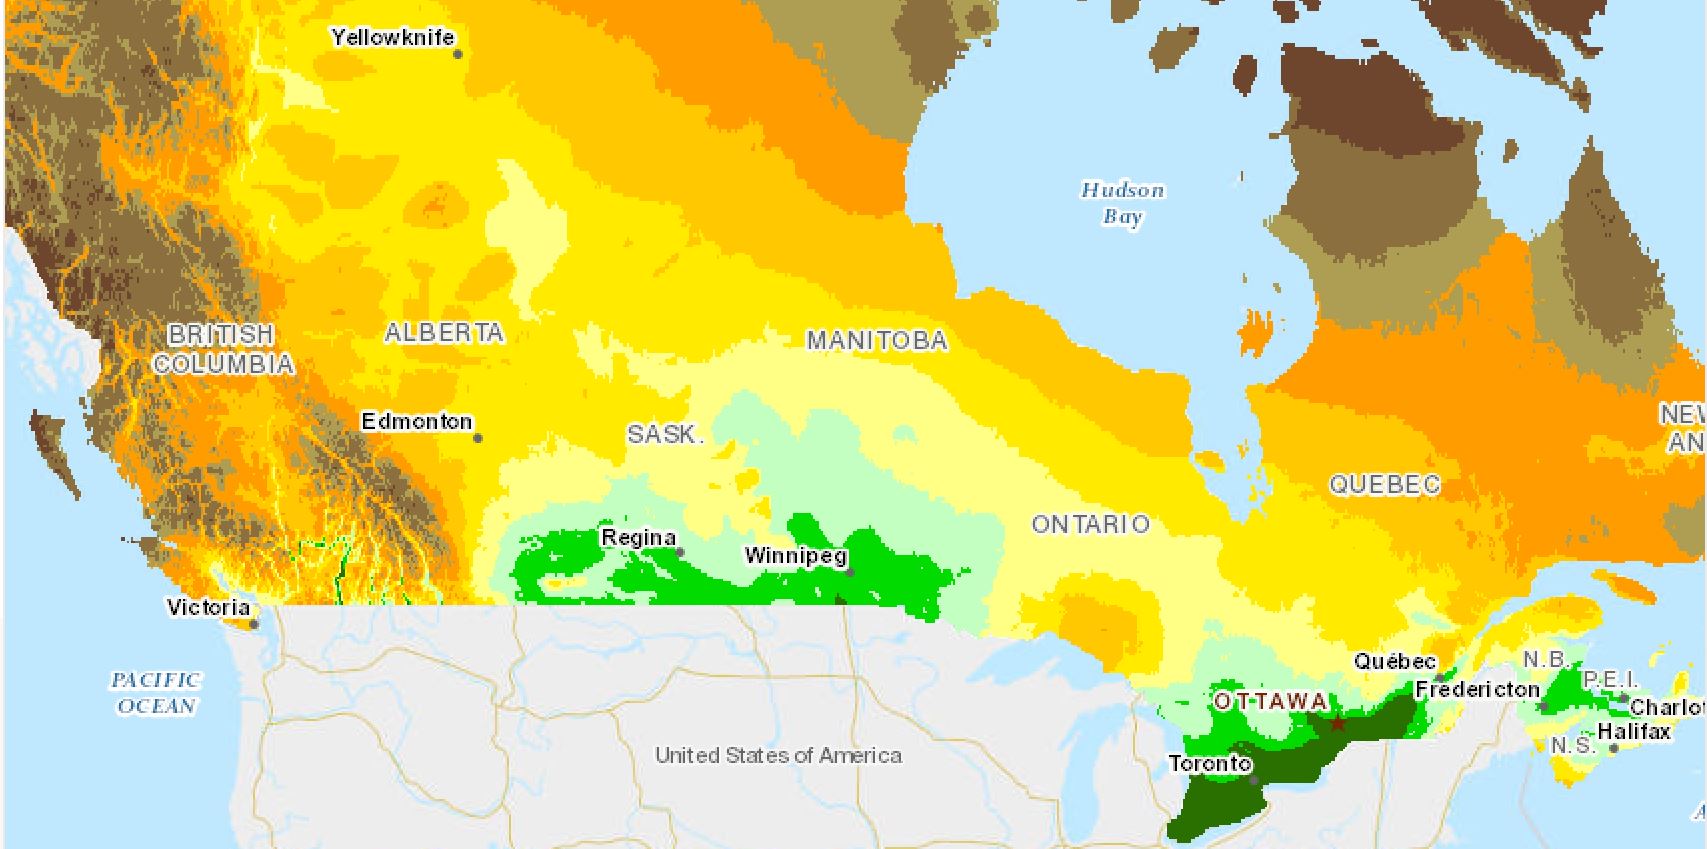
30-year Average precipitation represents the average amount (mm) of precipitation received in a month across a 30 year period (1961-1991, 1971-2000, 1981-2010, 1991-2020). These values are calculated across Canada in 10x10 km cells.
-
This data represents the dryness of the land surface based on vegetation conditions. The data is created weekly and uses weekly information on precipitation anomalies (namely the Standardized Precipitation Index or SPI) and satellite vegetation condition derived from Normalized Difference Vegetation Index (NDVI) from the MODIS Satellite. These dynamic data sets along with static data sets on land cover, soil water holding capacity, irrigation, ecozones and land surface elevation are used to model the drought severity, based on the Palmer Drought Severity Index (PDSI). The mapcubist model was trained on historical data and applied in real time to the dynamic inputs to produce drought severity ratings. The model is run at a 1km resolution and was developed by the AAFC, the United States Geological Survey and the United States Drought Monitor at the University of Nebraska Lincoln.
-
Ce produit fournit les données sur les eaux de ruissellement où chaque ligne de contour correspond à une quantité annuelle moyenne d’eau de ruissellement (en millimètres). Les données sur les eaux de ruissellement ont été dérivées des valeurs de débit provenant des stations hydrométriques ayant un débit naturel. Pour des raisons liées à la qualité ou à l’accessibilité des données, les données de certaines régions du pays ne sont pas offertes pour toutes les années. Les données couvrent la période de 1971 à 2013 pour le sud et de 1971 à 2004 pour le nord. Ces fichiers ont été produits par Statistique Canada, Division de la statistique de l’environnement, de l’énergie et des transports, 2017, basés sur des données d’Environnement et Changement climatique Canada, 2015, Relevés hydrologiques du Canada, Données hydrométriques archivées (HYDAT), www.ec.gc.ca/rhc- wsc/default.asp?lang=Fr&n=4EED50F1-1 (site consulté le 3 décembre 2015); C. Spence et A. Burke, 2008, « Estimates of Canadian Arctic Archipelago runoff from observed hydrometric data », Journal of Hydrology, vol. 362, p. 247 à 259. Pour en savoir plus sur la méthodologie, les résultats et les limites, veuillez consulter l’annexe D dans le document Statistique Canada, 2017, « L’eau douce au Canada, » L’activité humaine et l’environnement, Catalogue no 16-201-X. L’objet de l’ensemble de données est de présenter sur une carte nationale à l’échelle du 1 : 32 000 000 les quantités d’eau de ruissellement dérivées du modèle du rendement de l’eau de Statistique Canada. Ce produit est conçu pour être utilisé à des fins de référence ou de cartographie. Sa couverture est délimitée par les littoraux canadiens, tels qu’ils sont définis par les limites des régions de drainage fournies dans la carte 1.1 Régions de drainage du Canada. Le produit ne couvre pas les îles de l’Arctique. Il incombe aux utilisateurs de vérifier que le produit convient à l’utilisation prévue.
-

The Versatile Soil Moisture Budget (VSMB) is a soil water budget model that is continuous and deterministic in nature and was developed by AAFC. It is based on the premise that the water available for plant growth is gained by precipitation or irrigation, and lost through evapotranspiration and runoff as well as lateral and deep drainage. The daily net loss or gain is added or subtracted from the water already present in the rooting zone. Water is withdrawn simultaneously, but at different rates, from different soil depths, depending on the potential evapotranspiration, the stage of crop development, the water release characteristics of each soil layer and the available water.
-
The Prince Edward Island Detailed Soil Survey is a dataset series describing the spatial distribution of soils and associated landscapes in the Canadian province of Prince Edward Island. Soil landscape information compiled and published over the previous several decades provided the basis for the development of this relational database. The graphic soil landscape polygons are intended to be represented at a scale of 1:75,000. The associated soil landscape information and soil characteristics are described in a standard format in the Component (CMP), Soil Name File (SNF) and Soil Layer File (SLF) tables.
-
Growing Degree Days (GDDs) are used to estimate the growth and development of plants and insects during the growing season. Insect and plant development are very dependent on temperature and the daily accumulation of heat. The amount of heat required to move a plant or pest to the next development stage remains constant from year to year. However, the actual amount of time (days) can vary considerably from year to year because of weather conditions. Base temperatures are a point below which development does not occur for the organism in question. Base 15 temperatures are commonly used for general insect development. These values are calculated across Canada in 10x10 km cells.