 Arctic SDI catalogue
RI_533
Type of resources
Available actions
Topics
Keywords
Contact for the resource
Provided by
Formats
Representation types
Update frequencies
status
-
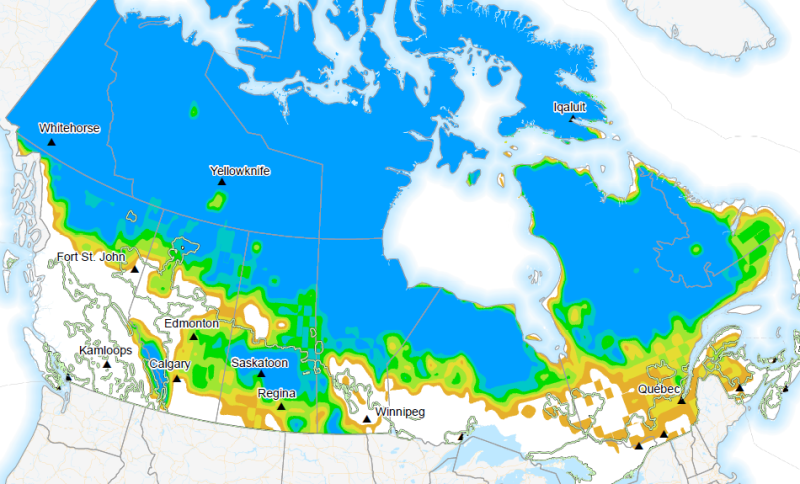
Cool Wave Days are the number of days in the forecast period with a minimum temperature below the cardinal minimum temperature, the lowest temperature at which crop growth will begin (dcw-warm). This temperature is 10°C for warm season crops. Week 1 and week 2 forecasted index is available daily from April 1 to October 31. Week 3 and week 4 forecasted index is available weekly (Thursday) from April 1 to October 31. Warm season crops require a relatively warm temperature condition. Typical examples include bean, soybean, corn and sweet potato. They normally grow during the summer season and early fall, then ripen in late fall in southern Canada only. Other agricultural regions in Canada do not always experience sufficiently long growing seasons for these plants to achieve maturity. The optimum temperature for such crops is 30°C. Agriculture and Agri-Food Canada (AAFC) and Environment and Climate Change Canada (ECCC) have together developed a suite of extreme agrometeorological indices based on four main categories of weather factors: temperature, precipitation, heat, and wind. The extreme weather indices are intended as short-term prediction tools and generated using ECCC’s medium range forecasts to create a weekly index product on a daily and weekly basis.
-

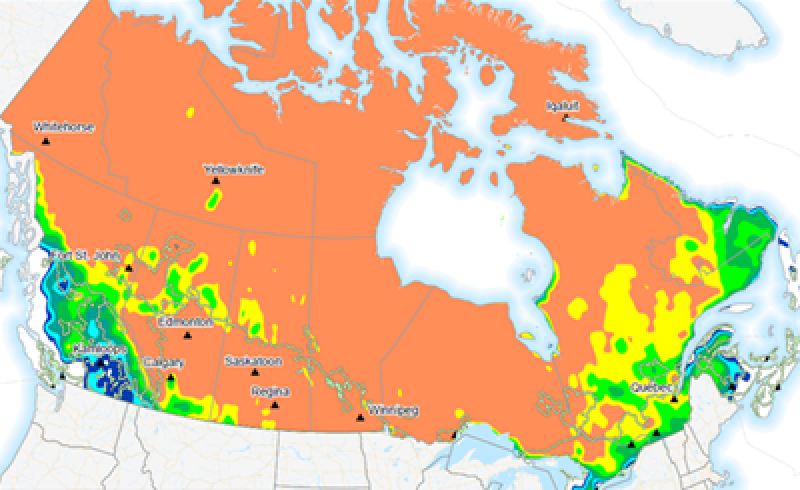
The number of days during the forecast period with an average wind speed greater than 30 km/h (nswd_prob). Week 1 and week 2 forecasted probability is available daily from September 1 to August 31. Week 3 and week 4 forecasted probability is available weekly (Thursday) from September 1 to August 31. Winds can significantly influence crop growth and yield mainly due to mechanical damage of plant vegetative and reproductive organs, an imbalance of plant-soil-atmosphere water relationships, and pest and disease distributions in agricultural fields. The maximum wind speed and the number of strong wind days over the forecast period represent short term and extended strong wind events respectively. Agriculture and Agri-Food Canada (AAFC) and Environment and Climate Change Canada (ECCC) have together developed a suite of extreme agrometeorological indices based on four main categories of weather factors: temperature, precipitation, heat, and wind. The extreme weather indices are intended as short-term prediction tools and generated using ECCC’s medium range forecasts to create a weekly index product on a daily and weekly basis.
-
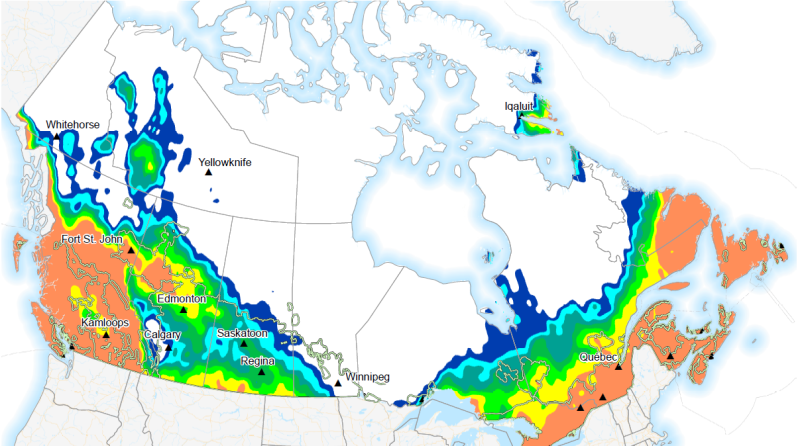
The Probability (likelihood) of cool wave days for warm season crops occurring. Cool Wave Days are the number of days in the forecast period with a minimum temperature below the cardinal minimum temperature, the lowest temperature at which crop growth will begin (dcw_warm_prob). This temperature is 10°C for warm season crops. Week 1 and week 2 forecasted probability is available daily from April 1 to October 31. Week 3 and week 4 forecasted probability is available weekly (Thursday) from April 1 to October 31. Warm season crops require a relatively warm temperature condition. Typical examples include bean, soybean, corn and sweet potato. They normally grow during the summer season and early fall, then ripen in late fall in southern Canada only. Other agricultural regions in Canada do not always experience sufficiently long growing seasons for these plants to achieve maturity. The optimum temperature for such crops is 30°C. Agriculture and Agri-Food Canada (AAFC) and Environment and Climate Change Canada (ECCC) have together developed a suite of extreme agrometeorological indices based on four main categories of weather factors: temperature, precipitation, heat, and wind. The extreme weather indices are intended as short-term prediction tools and generated using ECCC’s medium range forecasts to create a weekly index product on a daily and weekly basis.
-

Punctual location of structures under the management of MTMD (various types of: bridge, culvert (over 4.5 meters), gantry, wall and tunnel).**This third party metadata element was translated using an automated translation tool (Amazon Translate).**
-

Frost free days are the number of days in the forecast period with a minimum temperature above the frost temperature; the temperature at which frost damage occurs. This temperature is 0°C for warm season crops (ffd_warm). Week 1 and week 2 forecasted index is available daily from April 1 to October 31. Week 3 and week 4 forecasted index is available weekly (Thursday) from April 1 to October 31. Warm season crops require a relatively warm temperature condition. Typical examples include bean, soybean, corn and sweet potato. They normally grow during the summer season and early fall, then ripen in late fall in southern Canada only. Other agricultural regions in Canada do not always experience sufficiently long growing seasons for these plants to achieve maturity. The optimum temperature for such crops is 30°C. Agriculture and Agri-Food Canada (AAFC) and Environment and Climate Change Canada (ECCC) have together developed a suite of extreme agrometeorological indices based on four main categories of weather factors: temperature, precipitation, heat, and wind. The extreme weather indices are intended as short-term prediction tools and generated using ECCC’s medium range forecasts to create a weekly index product on a daily and weekly basis.
-
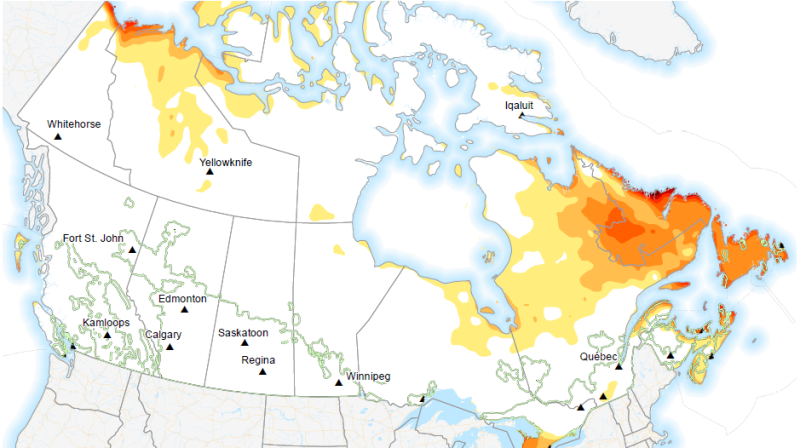
Probability of total precipitation above 50mm over the forecast period (pweek50_prob). Week 1 and week 2 forecasted probability is available daily from September 1 to August 31. Week 3 and week 4 forecasted probability is available weekly (Thursday) from September 1 to August 31. Precipitation (moisture availability) establishes the economic yield potential and product quality of field crops. Both dry and wet precipitation extremes have the ability to inhibit proper crop growth. The greatest daily precipitation index covers the risk of excessive precipitation in the short term, while the other indices pertain to longer term moisture availability. Agriculture and Agri-Food Canada (AAFC) and Environment and Climate Change Canada (ECCC) have together developed a suite of extreme agrometeorological indices based on four main categories of weather factors: temperature, precipitation, heat, and wind. The extreme weather indices are intended as short-term prediction tools and generated using ECCC’s medium range forecasts to create a weekly index product on a daily and weekly basis.
-

The probability (likelihood) of ice freeze days, the number of days in the forecast period with a minimum temperature below the frost temperature, -10°C for woody crops over the non-growing season (ifd_wood_nogrow_prob). Week 1 and week 2 forecasted probability is available daily from November 1 to March 31. Week 3 and week 4 forecasted probability is available weekly (Thursday) from November 1 to March 31. Over-wintering crops are biennial and perennial field crops such as herbaceous plants (strawberry, alfalfa, timothy, and many other forage crops) and woody fruit trees (apple, pear, peach, cherry, plum, apricot, chestnut, pecan, grape, etc.). These crops normally grow and develop in the growing season and become dormant in the non-growing season. However, extreme weather and climate events such as cold waves in the growing season and ice freezing events during the winter are a major constraint for their success of production and survival in Canada. The winter survival of these plants depends largely on agrometeorological conditions from late autumn to early spring, especially ice-freezing damage during the winter season. Agriculture and Agri-Food Canada (AAFC) and Environment and Climate Change Canada (ECCC) have together developed a suite of extreme agrometeorological indices based on four main categories of weather factors: temperature, precipitation, heat, and wind. The extreme weather indices are intended as short-term prediction tools and generated using ECCC’s medium range forecasts to create a weekly index product on a daily and weekly basis.
-

This data set shows the notices and alerts published on [the City of Montreal's website] (https://montreal.ca/avis-et-alertes). Advisories and alerts provide important information to the public in case of emergency and in situations that may have an impact on daily life (boil water advisory, construction, pool closure, etc.).**This third party metadata element was translated using an automated translation tool (Amazon Translate).**
-

Inventory of sports and recreational equipment located on the territory of the City of Longueuil and its positioning.**This third party metadata element was translated using an automated translation tool (Amazon Translate).**
-
Winds can significantly influence crop growth and yield mainly due to mechanical damage of plant vegetative and reproductive organs, an imbalance of plant-soil-atmosphere water relationships such as evapotranspiration, and pest and disease distributions in agricultural fields. The maximum wind speed and the number of strong wind days over the forecast period represent short term and extended strong wind events respectively. Agriculture is an important primary production sector in Canada. Agricultural production, profitability, sustainability and food security depend on many agrometeorological factors. Extreme weather events in Canada, such as drought, floods, heat waves, frosts and high intensity storms, have the ability to significantly impact field crop production. Agriculture and Agri-Food Canada (AAFC) and Environment and Climate Change Canada (ECCC) have together developed a suite of extreme agrometeorological indices based on four main categories of weather factors: temperature, precipitation, heat, and wind. The extreme weather indices are intended as short-term prediction tools and generated using ECCC’s medium range forecasts to create a weekly index product on a daily basis.