 Arctic SDI catalogue
Sea Surface Temperature
Type of resources
Topics
Keywords
Contact for the resource
Provided by
Formats
Representation types
Update frequencies
status
-

Wang, Z., Greenan, B.J.W., Hannah, C.G., and Layton, C. 2025. Past and future sea surface temperature changes in the oceans surrounding Canada. Can. Tech. Rep. Hydrogr. Ocean. Sci. 404: v + 44 p This study presents changes in the sea surface temperature (SST) in the oceans surrounding Canada using past observations and model projections of future scenarios. The past changes are derived using an SST product, HadISST, in which a recent period (2012-2022) was referenced to a 26-year climatology (1955- 1980). The future changes in SST are estimated using a 22-member ensemble of CMIP6 models. The SST changes for overlapping periods from the CMIP6 ensemble and the HadISST in the 10 regions of the Canadian shelf waters are in general agreement, although the CMIP6 results tend to overestimate the observed changes by about 0.1 oC. One exception to this is the Scotian Shelf where the CMIP6 models underestimate the observed SST change. The Gulf of Maine, Scotian Shelf, Gulf of St. Lawrence and southern Newfoundland shelf are the regions with the largest observed SST increases around Canada. The Gulf of St. Lawrence has the highest correlation (r=0.65) with the Atlantic Multi-decadal Oscillation (AMO) among the subregions in the North Atlantic Ocean, and the British Columbia Shelf is correlated with the Pacific Decadal Oscillation (r=0.58). Under the four climate scenarios (SSP1-2.6 to SSP5-8.5), among the mid-century (2040-2059) annual mean SST changes (reference period of 1990-2014) in the 10 regions, the Gulf of St. Lawrence is projected to have the largest increases in temperature (1.8 – 2.5oC), and Baffin Bay has the smallest increases (0.5 – 0.9oC), However, for the summer means, the southern Beaufort Sea has the largest SST increase (2.4 - 3.1oC) with Baffin Bay having the smallest changes (1.3-2.1oC). Cite this data as: Wang, Z., Greenan, B.J.W., Hannah, C.G., and Layton, C. (2025) Data of: Past and Future Sea Surface Temperature Changes in the Oceans Surrounding Canada. Published: October 2025. Ocean Ecosystems Science Division, Fisheries and Oceans Canada, Dartmouth, N.S. https://open.canada.ca/data/en/dataset/3c336e55-4266-406a-922d-bbf8e717558c
-

The data were collected during two research projects: Development of community-based monitoring for aquatic invasive species in the Canadian Arctic - preparing for increased shipping related to resource development and climate change; Diversity of pelagic primary producers in coastal habitats and the potential for harmful blooms in Eastern Canadian Arctic, with a focus near Iqaluit, Nunavut. Funding was provided by Polar Knowledge Canada, Fisheries and Oceans Canada (Strategic Program for Ecosystem-based Research and Advice, Aquatic Invasive Species Program and Oceans Ocean Protection Plan) and the Nunavik Marine Region Wildlife Board. These data are the abundance, richness and diversity of dinoflagellate communities in Canadian Arctic seaports to provide baseline data and to verify the presence of potential non-indigenous species and harmful taxa. These data can be used as a reference source for monitoring the introduction of potentially non-native species introduced into Arctic ports where shipping activities are high. SAMPLING Dinoflagellate samples were collected using a 20 μm (30 cm diameter) Nitex® plankton net during August in Churchill (MB) (2007 and 2015), in Deception Bay (QC ) (2016), in Iqaluit (NU) (2015 and 2019) and in Milne Inlet (2017). Samples were collected from 1 m of the surface to 1 m above the bottom. PREPARATION : Samples were stored in 4% formaldehyde. Sample preparation and counting were performed using the Utermöhl method. OBSERVATION : Samples were observed using an inverted microscope (NIKON Eclipse TE-2000-U) under a magnification of 200x. ABUNDANCE : The calculation of the abundance of dinoflagellates (cell / liter) was carried out as follows: Number of cells X Volume of the bottle / Volume of the Utermöhl chamber / (pi X Radius^2 X Depth) X 1000 ENVIRONMENTAL VARIABLES Environmental data were measured using a CTD and a Secchi disk. The time between sea ice melt and sampling was calculated by subtracting the sampling day from the breakup dates (ice concentration <1/10) which were extracted from the Canadian Ice Service records. For further information, please consult the following paper: Dhifallah F, Rochon A, Simard N, McKindsey CW, Gosselin M, Howland KL. 2022. Dinoflagellate communities in high-risk Canadian Arctic ports. Estuarine, Coastal and Shelf Science 266:107731
-

This dataset contains the surface temperature and salinity data of the enlarged coastal thermograph network of the St. Lawrence river, estuary and gulf system. It includes data from the Canadian Hydrographic Service water level network (SINECO), the Department of Fisheries and Oceans (DFO)-Quebec long-termed thermograph monitoring program network and the oceanographic buoy network. Each station is linked with a .png file showing the temperature and salinity time series and with a .csv file containing the surface temperature and salinity data themselves (columns : Station,Latitude,Longitude,Date(UTC),Depth/Profondeur(m),Temperature/Température(ºC),Salinity/Salinité(psu)). Supplemental Information A detailed description of the networks (SINECO, oceanographic buoys and the DFO-Quebec thermograph monitoring program) is available at the St. Lawrence Global Observatory (SLGO) portal : SINECO : https://ogsl.ca/en/tide-gauges-dfo-chs/ Oceanographic buoys : https://ogsl.ca/en/marine-conditions-buoys-dfo/ Thermographs: https://ogsl.ca/en/marine-conditions-thermographs-dfo/ Technical Reports related to the Thermograph Network (the last one is also available at the same hypertext link mentionned above) : Pettigrew, B., Gilbert, D. and Desmarais R. 2016. Thermograph network in the Gulf of St. Lawrence. Can. Tech. Rep. Hydrogr. Ocean Sci. 311: vi + 77 p. Pettigrew, B., Gilbert, D. and Desmarais R. 2017. Thermograph network in the Gulf of St. Lawrence: 2014-2016 update. Can. Tech. Rep. Hydrogr. Ocean Sci. 317: vii + 54 p.
-

Daily sea surface temperature and salinity observations have been carried out at several locations on the coast of British Columbia since the early part of the 20th century. Observations started at the Pacific Biological Station (Departure Bay) in 1914; 11 stations were added in the mid-1930s and several more in the 1960s. The number of stations reporting at any given time has varied as sampling has been discontinued at some stations and started or resumed at others. Presently termed the British Columbia Shore Station Oceanographic Program (BCSOP), there are 12 active participating stations. Most of the stations are at lighthouses staffed by Fisheries and Oceans Canada, but three (Race Rocks, Amphitrite Point, and Active Pass) are sampled by contracted observers. Observations are made daily using seawater collected in a bucket lowered into the surface water at or near the daytime high tide. This sampling method was designed long ago by Dr. John P. Tully and has not been changed in the interests of a homogeneous data set. This means, for example, that if an observer starts sampling one day at 6 a.m., and continues to sample at the daytime high tide on the second day the sample will be taken at about 06:50 the next day, 07:40 the day after etc. When the daytime high-tide gets close to 6 p.m. the observer will then begin again to sample early in the morning, and the cycle continues. Since there is a day/night variation in the sea surface temperatures the daily time series will show a signal that varies with the14-day tidal cycle. This artifact does not affect the monthly sea surface temperature data.
-
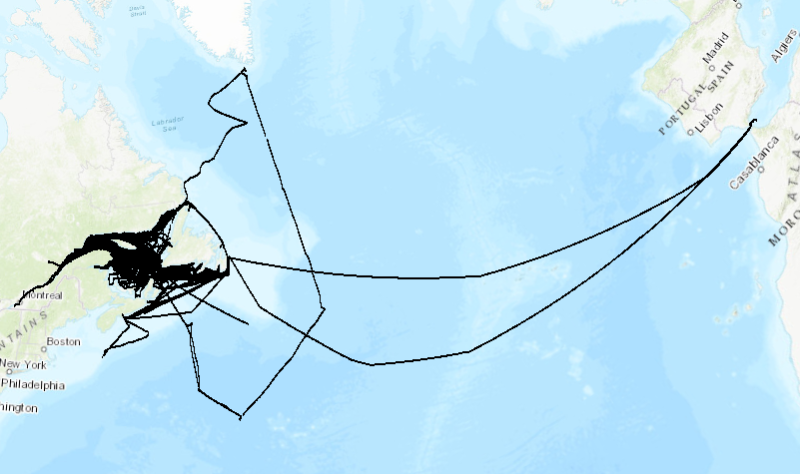
1999 to 2023 surface temperature and salinity measured along the track of commercial ships, mostly between Montreal (Quebec) and St. John's (Newfoundland). Monitoring of surface water conditions in the Estuary and Gulf of St. Lawrence is carried out with different complementary methods such as thermosalinographs (TSG) installed on commercial ships. These ships are sailing all year long from Montreal to St. John’s, one round trip per week, and are sampling water near the surface (3 to 8 meters deep) to determine the temperature and salinity all along the route. Purpose The recorded data are used as input to numerical forecasting models for sea ice conditions and as a monitoring tool for the Gulf of St. Lawrence. Annual reports are available at the Canadian Science Advisory Secretariat (CSAS), (http://www.dfo-mpo.gc.ca/csas-sccs/index-eng.htm). Galbraith, P.S., Chassé, J., Caverhill, C., Nicot, P., Gilbert, D., Lefaivre, D. and Lafleur, C. 2018. Physical Oceanographic Conditions in the Gulf of St. Lawrence during 2017. DFO Can. Sci. Advis. Sec. Res. Doc. 2018/050. v + 79 p.
-

Mean 2014 to 2023 winter surface conditions in the Estuary and Gulf of St. Lawrence. The survey has been taking place every year in March. Surface conditions are described by temperature, salinity and nutrient concentration (mmol/m3) interpolated on a 10km x 10km grid. Purpose Since many years, the Department of Fisheries and Oceans Canada (DFO) has been conducting annual surveys, at different periods of the year, in the Estuary and Gulf of St. Lawrence, each having many objectives including assessment of environmental conditions. However, these surveys, carried out on vessels, did not cover the winter period. Since 1996, a regional monitoring program, conducted by Maurice-Lamontagne Institute scientists, is taking place in order to fill this gap. The annual helicopter survey is undertaken in the beginning of March to evaluate physical oceanographic conditions of waters up to 200 m and surface water nutrient contains. These surveys are usually sampled from a Canadian Coast Guard helicopter but from an icebreaker in 2016 and 2017. Data from regional monitoring programs are combined with the ones from the Atlantic Zone Monitoring Program (AZMP) to produce annual reports (physical, biological and a Zonal Scientific Advice) which are available at the Canadian Science Advisory Secretariat (CSAS), (http://www.dfo-mpo.gc.ca/csas-sccs/index-eng.htm). Galbraith, P.S., Chassé, J., Caverhill, C., Nicot, P., Gilbert, D., Pettigrew, B., Lefaivre, D., Brickman, D., Devine, L., and Lafleur, C. 2017. Physical Oceanographic Conditions in the Gulf of St. Lawrence in 2016. DFO Can. Sci. Advis. Sec. Res. Doc. 2017/044. v + 91 p. Devine, L., Scarratt, M., Plourde, S., Galbraith, P.S., Michaud, S., and Lehoux, C. 2017. Chemical and Biological Oceanographic Conditions in the Estuary and Gulf of St. Lawrence during 2015. DFO Can. Sci. Advis. Sec. Res. Doc. 2017/034. v + 48 pp. Additional Information Water sampling for nutrient analysis is done from Niskin bottles according to AZMP sampling protocol: Mitchell, M. R., Harrison, G., Pauley, K., Gagné, A., Maillet, G., and Strain, P. 2002. Atlantic Zonal Monitoring Program sampling protocol. Can. Tech. Rep. Hydrogr. Ocean Sci. 223: iv + 23 pp. Nitrate titration is carried out according to the following method ((nitrite + nitrate) – nitrite): Nitrite + nitrate: Armstrong, FAJ, CR Stearns, JDH Strickland (1967) The measurement of upwelling and subsequent biological processes by means of the Technicon Autoanalyzer and associated equipment. Deep-Sea Res 14(3) 381-389. Nitrite: American Public Health Assoc. (1971) Standard Methods for the examination of water and wastewater. 13th edition, pp. 240-243, Washington D.C. Phosphate: Murphy, J, JP Riley (1962) A modified single solution method for the determination of phosphate in natural waters. Anal Chim. Acta 27 : 30. Silicate: Strickland, JDH, TR Parsons (1972) A Practical Handbook of Seawater Analysis, second edition. Fish Res Board Can, Bulletin 167, 310 pp. The surface water temperature and salinity are determined from CTD profiles.
-

Mean 2013 to 2022 summer surface conditions in the Estuary and Gulf of St. Lawrence. Data come from the August and the September multidisciplinary surveys. Surface conditions are described by temperature, salinity and nutrient concentration (mmol/m³) interpolated on a 10 km x 10 km grid. Purpose Since 1990, the Department of Fisheries and Oceans has been conducting an annual multidisciplinary survey in the Estuary and northern Gulf of St. Lawrence using a standardized protocol. In the southern Gulf of St. Lawrence, these bottom trawl surveys has been carrying out each September since 1971. These missions are an important source of information about the status of the marine ressources. The objectives of the surveys are multiple: to estimate the abundance and biomass of groundfish and invertebrates, to identify the spatial distribution and biological characteristics of these species, to monitor the biodiversity of the Estuary and Gulf and finally, to describe the environmental conditions observed in the area at the moment of the sampling. The southern Gulf surveys are realized using the following standardized protocol: Hurlbut,T. and D.Clay (eds) 1990. Protocols for Research Vessel Cruises within the Gulf Region (Demersal Fish) (1970-1987). Can. MS Rep. Fish. Aquat. Sci. No. 2082: 143p. The sampling protocols used for the Estuary and northern Gulf surveys are described in details in the following publications: Bourdages, H., Archambault, D., Bernier, B., Fréchet, A., Gauthier, J., Grégoire, F., Lambert, J., et Savard, L. 2010. Résultats préliminaires du relevé multidisciplinaire de poissons de fond et de crevette d’août 2009 dans le nord du golfe du Saint-Laurent. Rapp. stat. can. sci. halieut. aquat. 1226 : xii+ 72 p. Bourdages, H., Archambault, D., Morin, B., Fréchet, A., Savard, L., Grégoire, F., et Bérubé, M. 2003. Résultats préliminaires du relevé multidisciplinaire de poissons de fond et de crevette d’août 2003 dans le nord du golfe du Saint-Laurent. Secr. can. consult. sci. du MPO. Doc. rech. 2003/078. vi + 68 p. Annual reports are available at the Canadian Science Advisory Secretariat (CSAS), (http://www.dfo-mpo.gc.ca/csas-sccs/index-eng.htm). Bourdages, H., Brassard, C., Desgagnés, M., Galbraith, P., Gauthier, J., Légaré, B., Nozères, C. and Parent, E. 2017. Preliminary results from the groundfish and shrimp multidisciplinary survey in August 2016 in the Estuary and northern Gulf of St. Lawrence. DFO Can. Sci. Advis. Sec. Res. Doc. 2017/002. v + 87 p.