 Arctic SDI catalogue
Salinity
Type of resources
Available actions
Topics
Keywords
Contact for the resource
Provided by
Years
Formats
Representation types
Update frequencies
status
Service types
-

Description: Seasonal climatologies for salinity of the Northeast Pacific Ocean were computed to cover the period 2001 to 2020. Historibal observations included all available conductivity-temperature_depth (CTD), bottle and profiling floats in the NODC World Ocean Database, Marine Environmental Data Services (MEDS), Institute of Ocean Sciences Water Properties website and the Canadian Integrated Ocean Observing System (CIOOS Pacific). Methods: Interpolation was carried out in up to fifty-two vertical levels from surface to 5000m. Data-Interpolating Variational Analysis (DIVA) was used for spatial interpolation for all years within each season and estimates projected onto a consistent grid. The average of the grid nodes was calculated to obtain the seasonal climatology. DIVA was used again on the final climatology followed by a median filter and a 5-point smoother. Spring months were defined as April to June, summer months were defined as July to September, fall months were defined as October to December, and winter months were defined as January to March. The data available here contain raster layers of seasonal salinity climatology for the Canadian Pacific Exclusive Economic Zone (EEZ), a subset of seasonal climatology of the Northeast Pacific Ocean, with high spatial resolution of 1/300 degree. Data Sources: NODC, MEDS, IOS and CIOOS Pacific Data. Uncertainties: Uncertainties are introduced when quality controlled observational data are spatially interpolated to varying distances from the observation point. Climatological averages are calculated from these interpolated values.
-

Description: Seasonal salinity climatology of the Northeast Pacific Ocean were computed from historical observations including all available conductivity-temperature-depth (CTD), bottle, expendable bathy-thermograph (XBT), and Argo data in NOAA (http://www.argo.ucsd.edu/), Marine Environmental Data Service (MEDS), and Institute of Ocean Sciences archives over 1980 to 2010 period. Methods: Calculations, including smooth and interpolation, were carried out in sixty-five subregions and up to fifty-two vertical levels from surface to 5000m. Seasonal averages were computed as the median of yearly seasonal values. Spring months were defined as April to June, summer months were defined as July to September, fall months were defined as October to December, and winter months were defined as January to March. The data available here contain raster layers of seasonal salinity climatology for the Canadian Pacific Exclusive Economic Zone (EEZ), a subset of seasonal climatology of the Northeast Pacific Ocean, with high spatial resolution of 1/300 degree. References: Foreman, M. G. G., W. R. Crawford, J. Y. Cherniawsky, and J. Galbraith (2008). Dynamic ocean topography for the northeast Pacific and its continental margins, Geophys. Res. Lett., 35, L22606, doi: 10.1029/2008GL035152. Data Sources: NOAA, MEDS and IOS observational data Uncertainties: Uncertainties are introduced when quality controlled observational data are spatially interpolated to varying distances from the observation point. Climatological averages are calculated from these interpolated values.
-

This dataset contains the modelled and observed data used in the publication "Fjord circulation permits persistent subsurface water mass in a long, deep mid-latitude inlet" by Laura Bianucci et al., DFO Ocean Sciences Division, Pacific Region (published in the journal Ocean Science in 2024). An application of the Finite Volume Community Ocean Model (FVCOM v4.1) was run from May 24 to June 27, 2019 in the Discovery Islands region of British Columbia, Canada. Observed temperature and salinity profiles available in this area during this time period are included in the dataset, along with the modelled values at the same times and locations.
-

Bottom salinity time series at the 3 fixed stations and 46 stations, grouped into transects, of the Atlantic Zonal Monitoring Program (AZMP) under the Quebec region responsibility. The mean bottom salinity of the last ten years are displayed as 2 layers, one for the June survey (2014-2023, 2020 not sampled), another for the autumn survey (2014-2023). A third layer shows the positions of the fixed stations of the program (Anticosti Gyre, Gaspé Current and Rimouski). Each station is linked with a .png file showing the bottom salinity time series and with a .csv file containing all the bottom salinity data acquired at those stations since the beginning of the program sampling (columns : Station, Latitude, Longitude, Date(UTC), Sounding(m), Depth/Profondeur(m), Salinity/Salinité). Purpose The Atlantic Zone Monitoring Program (AZMP) was implemented in 1998 with the aim of increasing the Department of Fisheries and Oceans Canada’s (DFO) capacity to detect, track and predict changes in the state and productivity of the marine environment. The AZMP collects data from a network of stations composed of high-frequency monitoring sites and cross-shelf sections in each following DFO region: Québec, Gulf, Maritimes and Newfoundland. The sampling design provides basic information on the natural variability in physical, chemical, and biological properties of the Northwest Atlantic continental shelf. Cross-shelf sections sampling provides detailed geographic information but is limited in a seasonal coverage while critically placed high-frequency monitoring sites complement the geography-based sampling by providing more detailed information on temporal changes in ecosystem properties. In Quebec region, two surveys (46 stations grouped into transects) are conducted every year, one in June and the other in autumn in the Estuary and Gulf of St. Lawrence. Historically, 3 fixed stations were sampled more frequently. One of these is the Rimouski station that still takes part of the program and is sampled about weekly throughout the summer and occasionally in the winter period. Annual reports (physical, biological and a Zonal Scientific Advice) are available from the Canadian Science Advisory Secretariat (CSAS), (http://www.dfo-mpo.gc.ca/csas-sccs/index-eng.htm). Devine, L., Scarratt, M., Plourde, S., Galbraith, P.S., Michaud, S., and Lehoux, C. 2017. Chemical and Biological Oceanographic Conditions in the Estuary and Gulf of St. Lawrence during 2015. DFO Can. Sci. Advis. Sec. Res. Doc. 2017/034. v + 48 pp. Supplemental Information The bottom salinity is determined from CTD profile in the water column according to AZMP sampling protocol: Mitchell, M. R., Harrison, G., Pauley, K., Gagné, A., Maillet, G., and Strain, P. 2002. Atlantic Zonal Monitoring Program sampling protocol. Can. Tech. Rep. Hydrogr. Ocean Sci. 223: iv + 23 pp.
-

This dataset contains the outputs for Bute Inlet from two simulations shown in the publication "Fjord circulation permits persistent subsurface water mass in a long, deep mid-latitude inlet" by Laura Bianucci et al., DFO Ocean Sciences Division, Pacific Region (published in the journal Ocean Science in 2024). The Finite Volume Community Ocean Model (FVCOM v4.1) was run with two different sets of initial conditions for the Discovery Islands region of British Columbia, Canada, from May 24 to June 27, 2019. The "Baseline" simulation used observed initial conditions, while the "Sensitivity" simulation removed the observed cold subsurface water mass from the initial profiles. Here in this dataset, we provide 29-day averages of the following variables in a transect along Bute Inlet: potential temperature, density, along-inlet velocity, and Brunt-Väisälä frequency (N^2). The averaging properly removes the tidal effects.
-

This dataset was compiled as part of a multiyear effort lead by Fisheries and Oceans Canada (DFO) to support sustainable aquaculture regulation in the Coast of Bays, an area of the south coast of Newfoundland. It is the second of a series aiming to provide an oceanographic knowledge baseline of the Coast of Bays. This dataset includes temperature, salinity, and dissolved oxygen concentration profiles collected during CTD surveys, each survey containing a varying number of casts/profiles taken within the area of interest. In total, 760 profiles from 11 surveys, executed over 276 stations, were collected from June 2009 to November 2013. Data were processed and quality controlled using the instrumentation manufacturer guidelines, custom tools as well as visual inspection. Data are provided in tab-delimited text-based format compatible with most data processing language and tools (e.g. MS. Excel) as well as with the Ocean Data View software (https://odv.awi.de/) for rapid visualisation. A summary of the CTD profiles and stations surveyed is also provided as a comma separated values (CSV) file. A full description of the data and of its use in the context of the motivating project can be found in http://www.dfo-mpo.gc.ca/csas-sccs/Publications/ResDocs-DocRech/2017/2017_077-eng.html. Analyses from this dataset were presented during a Canadian Science Advisory Secretariat (CSAS) meeting which took place in St John’s in March 2015 (http://www.dfo-mpo.gc.ca/csas-sccs/schedule-horraire/2015/03_25-26b-eng.html) and from which a Science Advisory Report (http://www.dfo-mpo.gc.ca/csas-sccs/Publications/SAR-AS/2016/2016_039-eng.html) and Proceedings (http://www.dfo-mpo.gc.ca/csas-sccs/Publications/Pro-Cr/2017/2017_043-eng.html) were published.
-

This data report provides information on temperature and salinity in the Godbout region of the St. Lawrence Estuary. Sampling was carried out from 2019 to 2021 over an area of <5 km2. The databases provide information on temperature and salinity at an hourly rate for 2 years. The aim of this project is to analyze telemetry data from sea urchins (Strongylocentrotus droebachiensis), snow crabs (Chionoecetes opilio), rock crabs (Cancer irroratus), spider crabs (Hyas spp.) and whelks (Buccinum undatum). This report focuses on the presentation of benthic environmental data collected throughout the study with high spatial and temporal resolution. All reported variables were collected at the seafloor, as the aim of the project was to study the movement of epibenthic species. Temperature data were collected from three devices: telemetry receivers with integrated temperature sensors (InnovaseaTM), HoboTM and Star-OddiTM probes. Temperature data processing involved cleaning up extreme values (below 2°C and above 20°C) and homogenizing the data to fit the bathymetry matrix (1m x 1m cells) of the study site. Temperature data are provided in a NetCDF file with a matrix of the entire study site, where there is a stratum for each hour between August 2019 and October 2021 and in each file, a temperature value for each pixel of the raster. Salinity data were collected from Star-OddiTM probes only. Salinity values were averaged hourly for the entire study area. Salinity data is provided as a CSV file with one salinity value per hour for the entire study area.
-
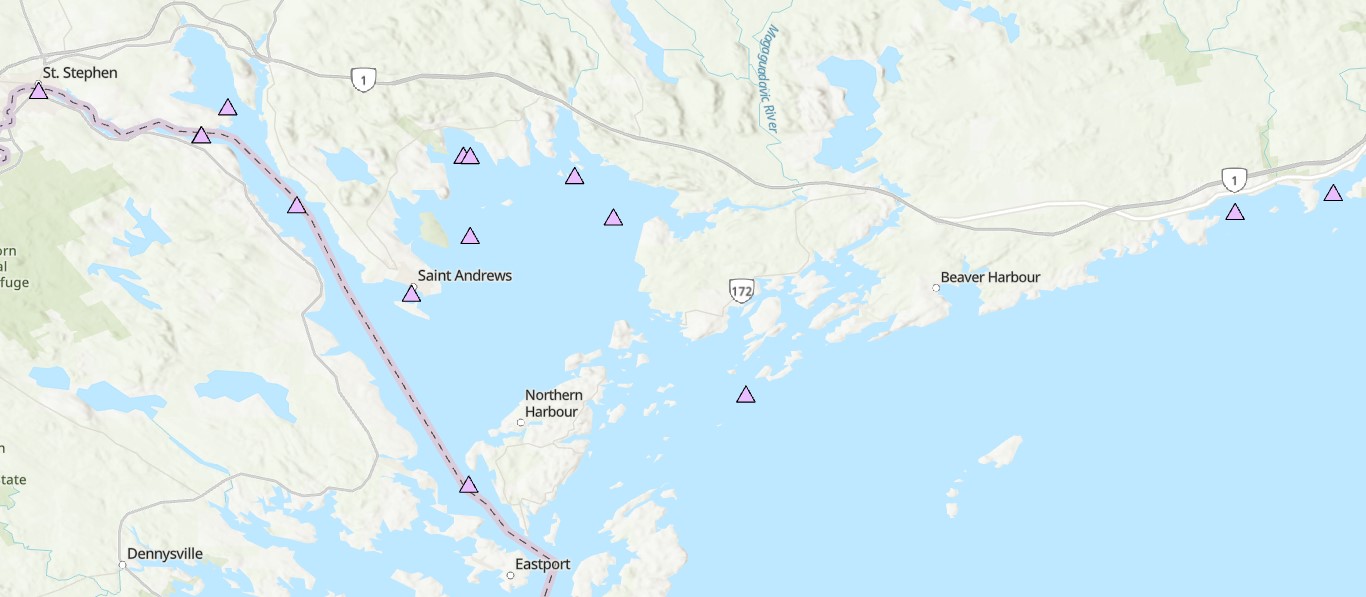
The Coastal Environmental Baseline Program is a multi-year Fisheries and Oceans Canada initiative designed to work with Indigenous and local communities and other key parties to collect coastal environmental data at a series of sites across Canada, to build a better understanding of existing marine ecological conditions. The program began data collection in 2019, and with the onset of Phase 2 in 2023, the Maritimes region study area was expanded and renamed ‘Northwest Fundy Shores’. A physical oceanography program was designed to align with the oceanographic interests and data needs of local interest holders. Starting in 2023, oceanographic parameters including water temperature, salinity, depth and turbidity have been monitored at a series of locations in Passamaquoddy Bay, the St. Croix River, and along the Bay of Fundy coast, including the Musquash estuary Marine Protected Area (MPA). This dataset includes seasonal CTD (conductivity, temperature and depth) and turbidity data starting in spring 2023. Instruments are maintained through the winter months at a limited number of sites. Data collection methods are primarily moored instruments on the bottom in water depths of 5-90 meters, and a few buoyant surface floats. Overall, this dataset captures seasonal dynamics in near-shore marine environments in Passamaquoddy Bay, the St Croix River, the Bay of Fundy and the Musquash MPA. Cite this data as: Coastal Environmental Baseline Program (Maritimes Region), Northwest Fundy Shores conductivity, temperature and depth data. Published in May 2025. Coastal Environmental Baseline Program. Coastal Ecosystems Science Division, Fisheries and Oceans Canada, St. Andrews, N.B. 14-02-2025
-
The Department of Fisheries and Oceans (DFO) holds discrete oceanographic, biological, and chemical data collected throughout the St. Lawrence Estuary, the Gulf of St. Lawrence, and the Saguenay Fjord, as well as data gathered outside of these zones during non-routine surveys (collected by the Quebec region). These data come from samples taken at different depths in the water column (surface, bottom, and intermediate depths), mainly during annual scientific missions such as: - weekly monitoring at fixed stations (Rimouski, Shediac Valley) - annual multispecies surveys (Northern and Southern Gulf) - spring and fall missions of the Atlantic Zone Monitoring Program This dataset presents the variables most frequently sampled for the period 1990 to two years prior to the present, namely, salinity, dissolved oxygen concentration, chlorophyll-a concentration, nutrient concentrations (nitrite, nitrate, silicate, phosphate), pH and alkalinity. These measurements are often accompanied by data from CTD profiles (Conductivity, Temperature, Depth/Pressure) and auxiliary sensors (fluorescence, turbidity, pH). Annual synthesis of the chemical and biological oceanographic conditions of the study area have been published since 2011, and reports on zonal conditions of the four Atlantic regions of DFO are also available for certain years: https://www.dfo-mpo.gc.ca/science/data-donnees/azmp-pmza/index-eng.html This record is updated annually as new data become available. To obtain access to earlier data, less frequently sampled variables, or specifications regarding laboratory analyses (analytical methods, preservation, and storage), please contact the data management team at: gddaiss-dmsaisb@dfo-mpo.gc.ca. Notes: This publication contains data extracted from the national BioChem database (Biological and Chemical Marine Data: DFO.BioChemDatabase-BasededonneesBioChem.MPO@DFO-MPO.GC.CA). When replicate samples were present, the values were averaged, and values were grouped by variable regardless of the analysis method, preservation method, or storage method. The grouping of variables collected at the same station is based on spatial and temporal metadata: LATITUDE, LONGITUDE, DATE, and TIME.
-

The objective of this project was to locate the mixing zones in the coastal environment on the north shore of the lower estuary, which are caused by the friction of the waters on the bottom and measure the effects of these mixing zones on the modification of the water bodies and the productivity potential of adjacent areas, using phytoplankton biomass and size structure as an indicator of productivity. Temperature and salinity profiles were measured using CTD and water sampling was done with a Niskin bottle to try to detect the signature of the mixture and to determine if nutrient salts and/or productivity are greater in adjacent areas. Sampling took place in 3 outings from 3 stations organized in a 100 NN transect which were carried out at the start of the season (June 30), mid-season (August 16) and end of the season (October 9). The transects were each composed of three stations ranging from 10 m depth near the coast to 50 and 75 m, depending on the transect, moving away from the coast. Samples were collected for nutrients and phytoplankton biomass (> 0.7 µm and > 5 µm) analysis at depths of 1, 10, 25 and 50 m. The optical transparency of water was also measured by Secchi disk. The first file provided “donnees_profils_data” is a summary of the CTD profils of every station. The second file “donnees_discretes_discret_data” contains the results of the water sample analysis. The file “Identification_station_identification” describe the repartition of consecutives among stations. This project was funded by DFO Coastal Environmental Baseline Program under Canada’s Oceans Protection Plan. This initiative aims to acquire environmental baseline data contributing to the characterization of important coastal areas and to support evidence-based assessments and management decisions for preserving marine ecosystems.