 Arctic SDI catalogue
Government of Canada;Natural Resources Canada;Canadian Forest Service
Type of resources
Available actions
Topics
Keywords
Contact for the resource
Provided by
Formats
Representation types
Update frequencies
status
Resolution
-

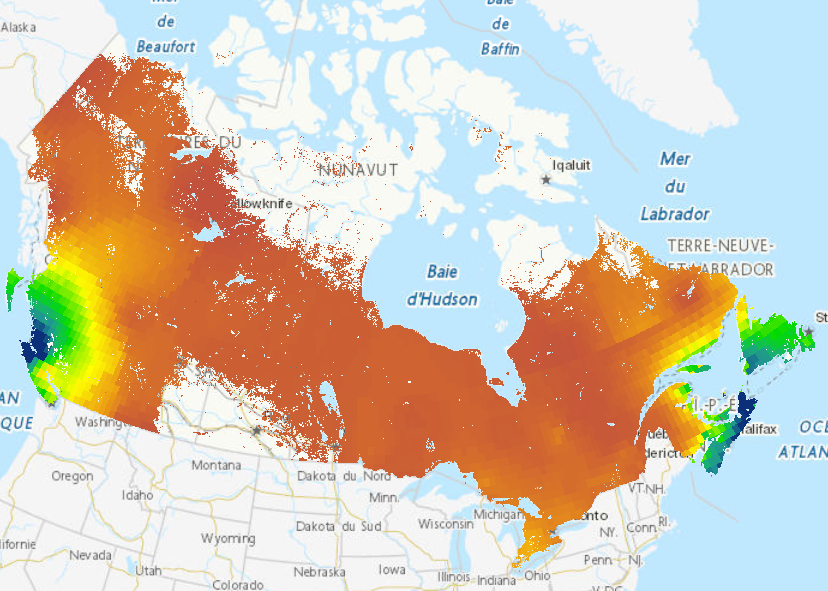
Wildfire ignition density rasters separated by cause (human, natural (lightning)) for mean and normalized mean summaries from 1980 to 2023.
-
This publication contains thirteen (13) maps of different biogeochemical and soil properties of forest ecosystems of Canada’s managed forest. A scientific article gives additional details on the methodology: Paré, D., Manka, F., Barrette, J., Augustin, F., Beguin, J. 2021. Indicators of site sensitivity to the removal of forest harvest residues at the sub-continental scale: mapping, comparisons, and challenges. Ecol. Indicators. https://dx.doi.org/10.1016/j.ecolind.2021.107516
-

CanLaBS v2 is an update to the Canada Landsat Burned Severity (CanLaBS) data product, available at https://doi.org/10.23687/b1f61b7e-4ba6-4244-bc79-c1174f2f92cd, builds upon the methodology originally described in Guindon et al. (2021), entitled “Trends in wildfire burn severity across Canada, 1985 to 2015” and published in the Canadian Journal of Forest Research (https://doi.org/10.1139/cjfr-2020-0353). CanLaBS v2 introduces several important improvements to input data sources, temporal coverage, and modeling approaches. **1. Key Updates in CanLaBS v2** **1.1 Transition to Landsat Collection 2** All Landsat inputs used to derive burn severity metrics have been updated from Landsat Collection 1 to Landsat Collection 2 (Earth Resources Observation and Science (EROS) Center, 2020a, 2020b, 2020c). Landsat Collection 2 provides improved radiometric calibration, refined atmospheric correction, and enhanced geometric accuracy, resulting in greater temporal consistency and more reliable spectral change detection across sensors and years. **1.2. Expanded fire perimeter coverage (NBAC 1986–2024)** The updated product now covers all fire perimeters included in the National Burn Area Composite (NBAC; Skakun et al., 2022) from 1986 to 2024. This substantially extends the temporal range of the dataset relative to the original release and ensures consistency with the most up-to-date national fire perimeter record used in Canada-wide disturbance analyses. **1.3. Improved random forest model for salvage logging detection** Salvage logging detection has been updated using an improved random forest (RF) classification model trained on 3614 photo-interpreted reference points. The model uses a refined set of spectral predictors derived from Landsat imagery, including pre- and post-fire band 3, post-fire bands 4, 5 and 7 (according to the Landsat 7 nomenclature), inter-annual spectral differences (ΔB3, ΔB4, ΔB5), and pre- and post-fire Normalized Difference Vegetation Index (NDVI). Model performance was evaluated using a train-test split (80%, 20%, respectively). This analysis revealed an overall accuracy of 90.6% and Cohen’s kappa of 0.87 (See **Table 1 in the update report**, available in the download section). Some confusion occurred between low-vegetation fires and salvage logging (the primary class of interest), but overall performance was strong, with 95.49% precision, 75.6% recall, and an F1-score of 84.39%. **1.4. Revised gapfilling strategy** As in the original product, gapfilling of pre-fire Landsat data is retained to ensure complete characterization of pre-disturbance conditions. However, post-fire Landsat gapfilling is no longer applied in this version. This results in some missing data but avoids the introduction of uncertainty associated with radiometric regression-based gapfilling. A total of 6.9% of all NBAC burnt pixels are missing data. This proportion decreased over time due to improved Landsat data coverage, from 12.7% for fires before 2000 (pre-Landsat 7) to 2.59% for fires after 2012 (post-Landsat 8 launch). **1.5. Removal of pre-fire forest attribute layers** Pre-fire forest attribute layers (e.g., canopy density, biomass, species composition) are no longer included in this version of CanLaBS. These attributes are now provided through the Spatialized Canadian National Forest Inventory (SCANFI v2; Guindon et al., 2026 ), which offers a more comprehensive, internally consistent, and regularly updated source of pre-disturbance forest information. Users are encouraged to combine CanLaBS with SCANFI v2 (Guindon et al., 2026) for their analyses. Users should use forest attributes from 2 years before the fire to avoid over-smoothed data that artificially underestimate pre-fire forest vegetation when pre-fire year Landsat data are unavailable. The fire start dates can be accessed via NBAC (https://cwfis.cfs.nrcan.gc.ca/datamart). **2. Use limitations** **2.1.** This database is not designed to study a single fire or a limited number of fires but rather to study large areas with several fires. No radiometric correction or change was made per fire such as the offset method, or a mean, or median approach for pixels of the same year (see cjfr-2020-0353supplb at https://doi.org/10.1139/cjfr-2020-0353). Even if surface reflectance images were used, there may be radiometric differences within the same fire due to the use of different Landsat scenes. Differences in atmospheric correction between adjacent scenes may therefore be perceptible. The primary reason for not applying additional corrections in these cases is the insufficient number of pixels available per fire during July and August, particularly in certain regions and specific time periods.To achieve a spatially and temporally consistent database, a uniform processing approach was applied to all pixels. These points are discussed in the article and in the supplementary material (see cjfr-2020-0353supplb at https://doi.org/10.1139/cjfr-2020-0353). **2.2.** Burnt areas that have undergone salvage logging were detected using a classification approach. This is not an exhaustive mapping of all areas that were salvage logged beyond one year after the fire, the goal was to eliminate these areas from the analyses, as the post-fire values (NBRpost) would be biased by the absence of trees and by the presence of soil disturbed by scarification. **2.3.** Fires occurring in forests heavily affected by the mountain pine beetle (Dendroctonus ponderosae), spruce budworm (Choristoneura fumiferana), or other defoliators should ideally be excluded from analyses, as pre-fire NBR values are inherently low, potentially biasing dNBR-based assessments. CanLaD (Perbet et al., 2025) now provides identification of these affected areas (available at https://doi.org/10.23687/902801fd-4d9d-4df4-9e95-319e429545cc). **2.4.** The 1985 and 2024 fires represent the beginning and end years of the time series, it is possible that some fires are incomplete for these years, and perhaps to a lesser extent for the 1986 and 2023 fires. **3. Summary** Overall, this update improves the precision and temporal coverage of the CanLaBS data product by leveraging Landsat Collection 2 with updated national fire perimeter polygons and a refined salvage detection method. These changes enhance the suitability of the dataset for national-scale analyses of fire effects, post-fire management, and long-term disturbance dynamics in Canadian forests. **4. Layers description** There are 3 layers: - CanLaBS_1985_2024_v20260121.tif - dNBR values for all burnt pixels according to NBAC - CanLaBS_salvageMask_1985_2024_v20260121.tif - Binary layer where '1' identifies pixels where salvage logging occurred - NBAC_MRB_1972to2024_reproj.tif - NBAC fire year **5. Data download** The data can be downloaded from the FTP server (ftp.maps.canada.ca/pub/nrcan_rncan/Forest-fires_Incendie-de-foret/CanLaBS_v2-Burned_Severity-Severite_des_feux), referenced in the “Data and Resources” section, using a browser download manager, such as DownThemAll, or an external client such as FileZilla. **6. Dataset citation** - Guindon L., Correia D., Perbet P. 2026. Canada Landsat Burned Severity (CanLaBS v2): a Canada-wide Landsat-based 30-m resolution product of burned severity since 1985. https:/doi.org/10.23687/2af751e7-79f9-4da8-9b45-14688818dca3 **7. References** - Earth Resources Observation and Science (EROS) Center. 2020a. Landsat 4–5 Thematic Mapper Level-2, Collection 2. Dataset. U.S. Geological Survey. https://doi.org/10.5066/P9IAXOVV - Earth Resources Observation and Science (EROS) Center. 2020b. Landsat 7 Enhanced Thematic Mapper Plus Level-2, Collection 2. Dataset. U.S. Geological Survey. https://doi.org/10.5066/P9C7I13B - Earth Resources Observation and Science (EROS) Center. 2020c. Landsat 8–9 Operational Land Imager / Thermal Infrared Sensor Level-2, Collection 2. Dataset. U.S. Geological Survey. https://doi.org/10.5066/P9OGBGM6 - Guindon, L., S. Gauthier, F. Manka, M. A. Parisien, E. Whitman, P. Bernier, A. Beaudoin, P. Villemaire, and R. Skakun. 2021. “Trends in Wildfire Burn Severity across Canada, 1985 to 2015.” Canadian Journal of Forest Research 51 (9): 1230–1244. https://doi.org/10.1139/cjfr-2020-0353 - Guindon, L., P. Villemaire, D. L. P. Correia, F. Manka, S. Lacarte, and B. Smiley. 2023. SCANFI: Spatialized CAnadian National Forest Inventory Data Product. Natural Resources Canada, Canadian Forest Service, Laurentian Forestry Centre, Quebec, Canada. https://doi.org/10.23687/18e6a919-53fd-41ce-b4e2-44a9707c52dc - Guindon, L., D. L. P. Correia, F. Manka, and B. Smiley. 2026. SCANFI v2: Spatialized Canadian National Forest Inventory Data Product. Quebec, Canada: Natural Resources Canada, Canadian Forest Service, Laurentian Forestry Centre. https://doi.org/10.23687/07653869-f303-46c2-a04e-9ab479b73cbf - Perbet, P., L. Guindon, D. L. P. Correia, et al. 2025. “Historical Insect Disturbance Maps from 1985 Onwards for Canadian Forests Derived Using Earth Observation Data.” Scientific Data 12: 2012. https://doi.org/10.1038/s41597-025-06269-x - Perbet, P., L. Guindon, D. L. P. Correia, P. Villemaire, O. Reisi Gahrouei, and R. St-Amant. Canada Landsat Disturbance with Pest (CanLaD): A Canada-Wide Landsat-Based 30-m Resolution Product of Fire, Harvest and Pest Outbreak Detection and Attribution since 1987. https://doi.org/10.23687/902801fd-4d9d-4df4-9e95-319e429545cc - Skakun, R., G. Castilla, J. Metsaranta, E. Whitman, S. Rodrigue, J. Little, K. Groenewegen, and M. Coyle. 2022. “Extending the National Burned Area Composite Time Series of Wildfires in Canada.” Remote Sensing 14 (13): 3050.
-

A national map of Canadian Fire Behaviour Prediction (FBP) Fuel Types (FT) developed from public data sources. The resolution of the raster grid is 30m, classified from the Spatialized Canadian National Forest Inventory (SCANFI) dataset, ecozones of Canada, and the National Burned Area Composite (NBAC). The purpose of the dataset is to characterize Canadian forests into fuel types for use in Fire Behaviour Prediction calculations as well as for situational awareness of national fire potential.
-

The SMTC map and database provides the location of, and information about completed, under construction, or planned mass timber projects and manufacturing facilities in Canada. Project information includes building size, height, occupancy, mass timber materials used, year of construction, and other criteria. Manufacturer information includes facility location, materials produced, and production capacity.
-
**Attention: there is a new version of this product (CanLaBS v2)** CanLaBS v2 can be found here: https:/doi.org/10.23687/2af751e7-79f9-4da8-9b45-14688818dca3 This data publication contains a set of files in which different variables related to fire burned severity (Canada Landsat Burned Severity, CanLaBS) were computed for all events in Canada between 1985 and 2015 as detected by the Canada Landsat Disturbance (CanLaD (Guindon et al. 2017 and 2018) product. Details on the creation of this product are available in Guindon et al. 2020 (https://doi.org/10.1139/cjfr-2020-0353) and in supplementary materials accompanying the publication. The current document is therefore a complement to the article and supplementary materials. The supplementary materials are referenced in the publication (cjfr-2020-0353suppla, cjfr-2020-0353supplb etc.). This is the first Canada-wide product that aims to promote nationwide research on fire severity by making available the data used in the article. The data is in the form of grids composed of pixels at a resolution of 30m. To simplify the distribution and manipulation of the data and considering that two or three fire occurrences within a given location is rare (respectively 2.3% and less than 0.01%), only the most recent fire data are considered in the final product. For these very rare cases, from 2015 to 1985, the most recent burned areas overlap the older data. Overlapping fire count can be found in layer “CanLaBS_Nbdisturb_v0”, multiple fire events in same areas have values equal to or greater than two. Landsat radiometric values for calculating the NBR index were derived from summer Landsat mosaics (July and August), for years 1984 to 2015 (Guindon et al. 2018). These mosaics were developed from individual USGS Landsat scenes with surface reflectance correction (Masek et al., 2006; Vermote et al., 2006). For each annual compound, the pixel with the less atmospheric opacity was selected. An algorithm was also developed to remove clouds that were not detected by the cloud masks provided with the USGS data. Here is a general description of the layers provided and a more technical description can be found in Table 1 (see "Ressources" section below): 1. NBR and dNBR. All these values are multiplied by 1000. The value of dNBR represents the value obtained for NBRpre - NBRpost. It is calculated for each pixel that was classified as a fire in CanLaD, according to the corrected year (see cjfr-2020-0353suppla). 2. Year of fire. The fire years detected in CanLaD (Guindon et al. 2018) was corrected using different fire databases, this layer contains the correct year. (see cjfr-2020-0353suppla) 3. Julian Days of the Fire, based on various high-resolution products. However, this variable is only available from 1989 onwards. 4. Presence of salvage logging one year after the fire. Classification of satellite images detecting scarified soils (see cjfr-2020-0353suppld). 5. Pre-fire forest attributes: Pre-fire forest attributes values were calculated for median mosaics, from 1985 to 2000. These attributes values were derived from NFI (national forest inventory) photo-plot attributes and were spatialized. Pre-fire attribute values were created to stratify the analyses (see cjfr-2020-0353supplc). The predicted variables are as follows: • Canopy density in percent. • Predicted living biomass in tonnes per hectare. • Percentage coniferous biomass proportion of total biomass. • Percentage hardwood biomass proportion of total biomass. • Percentage unknown species biomass proportion of total biomass. Note, as unknown species are found especially in northern areas, they are considered coniferous for the purpose of the article. 6. Missing remote sensing data, one year after the fire. The estimation of burned severity needs NBR data (NBRpost) in the next year after fire occurrences. NBRpost is available for 91% of the cases, but for the remaining 9%, no data were available due to the presence of clouds. For these cases, satellite data from the years following the fire were used with a regression radiometry correction. This gives values to missing data for year following the fire. This layer flags the areas that have derived data. The values of 1= one year after the fire (no regression), 2= two years after the fire (regression), 3= three years after the fire (regression) and 4= four years after the fire (no regression, set as missing data). (see cjfr-2020-0353supplb). 7. Areas with more than one fire disturbance between 1985 and 2015 (1=one single disturbance, 2=two or more, 3=three or more). ## Data citation: 1. Guindon, L., Villemaire P., Manka F., Dorion H. , Skakun R., St-Amant R., Gauthier S. : Canada Landsat Burned Severity (CanLaBS): a Canada-wide Landsat-based 30-m resolution product of burned severity since 1985 https://doi.org/10.23687/b1f61b7e-4ba6-4244-bc79-c1174f2f92cd 2. The creation, the validation and the limits of the CanLaBS product are describe in the text and supplementary material: Guindon, L., Gauthier, S., Manka, F., Parisien, MA, Whitman, E., Bernier, P., Beaudoin, A., Villemaire P., Skakun R. Trends in wildfire burn severity across Canada, 1985 to 2015 https://doi.org/10.1139/cjfr-2020-0353 ## References cited: 1. Guindon, L., Villemaire, P., St-Amant, R., Bernier, P.Y., Beaudoin, A., Caron, F., Bonucelli, M., and Dorion, H. 2017. Canada Landsat Disturbance (CanLaD): a Canada-wide Landsat-based 30m resolution product of fire and harvest detection and attribution since 1984. https://doi.org/10.23687/add1346b-f632-4eb9-a83d-a662b38655ad 2. Guindon, L., Bernier, P., Gauthier, S., Stinson, G., Villemaire, P., & Beaudoin, A. (2018). Missing forest cover gains in boreal forests explained. Ecosphere, 9(1), e02094. https://doi.org//10.1002/ecs2.2094 3. Masek, J.G., Vermote, E.F., Saleous N.E., Wolfe, R., Hall, F.G., Huemmrich, K.F., Gao, F., Kutler, J., and Lim, T-K. (2006). A Landsat surface reflectance dataset for North America, 1990–2000. IEEE Geoscience and Remote Sensing Letters 3(1):68-72. http://dx.doi.org/10.1109/LGRS.2005.857030. 4. Vermote, E., Justice, C., Claverie, M., & Franch, B. (2016). Preliminary analysis of the performance of the Landsat 8/OLI land surface reflectance product. Remote Sensing of Environment. http://dx.doi.org/10.1016/j.rse.2016.04.008.
-

**Attention: there is a new version of this product (Pre-CanLaD v2)** Pre-CanLaD v2 can be found here: https://doi.org/10.23687/8d49698f-40f9-40da-b097-a3f4c90adf5a This data product aimed to extend the existing pre-1985 disturbance history record by mapping wildfire, harvest, and insect outbreaks in Canadian forests between 1965 and 1984. Our geospatial data processing methodology relied on multi-layer perceptrons (MLP) trained on spectral recovery signatures to map and age these disturbances. Specific years were not assigned to insect outbreaks due to the lack of dependable training and validation data. In order to provide a more accurate data product that is compatible with existing datasets (e.g. provincial forest inventories), we used these reliable, but incomplete datasets to correct our predictions of disturbance type and year whenever they were available. Coupled with the updated Canada Landsat Disturbance (CanLaD) data product (Guindon et al. 2017), we are thus able to obtain a pan-Canadian 30m resolution disturbance history record from 1965 until 2023. The full description of the methodology and the exhaustive validation analyses are described in detail in Correia et al. (2024). The following limitations should be taken into account when using this dataset: • It is recommended to group disturbance age predictions into age classes, as this should reduce the noise present in the disturbance age estimation models. • Fire-harvest misclassification seems to be particularly common in transition zones like the southern edge of the Boreal Shield, where fires and harvest are both relatively common. • There seems to be an overestimation of 1965 fires due to a misclassification of burnt areas older than 1965 in northern, less productive areas as belonging to the beginning of our time series. • We likely detected mostly high-severity burnt areas that depict complete mortality, since the faster recovery of low-severity burns makes them more challenging to detect. • Insect outbreak detections were mostly associated with the historic eastern spruce budworm outbreak of the 1970s. Even though pixel-level insect disturbance year was not predicted, realistic estimates can be obtained by cross-checking our data product with historic reports. The following raster layers are available: • canlad_1965_1984_disturbanceType: Estimated disturbance type o 2 = Fire o 3 = Harvest o 4 = Insect • canlad_1965_1984_disturbanceYear: Estimated disturbance year o Numeric value from 1965 to 1984 • canlad_1965_1984_correctionMask: Raster indicating which predictions have been corrected with external datasets o 0 = Unconfirmed disturbance o 1 = Confirmed fire o 2 = Confirmed harvest Please cite this data product as: Correia, D. L. P., L. Guindon, and M. A. Parisien. 2024. Canada-wide Landsat-based 30-m resolution product of disturbance detection prior to 1984. https://doi.org/10.23687/660b7c6a-cdec-4c02-90c7-d63e91825c42 References: Correia, D. L. P., L. Guindon, and M. A. Parisien. 2024. Extending Canadian forest disturbance history maps prior to 1985. Ecosphere [in press]. Guindon, L., P. Villemaire, R. St-Amant, P.Y. Bernier, A. Beaudoin, F. Caron, M. Bonucelli and H. Dorion. 2017. Canada Landsat Disturbance (CanLaD): a Canada-wide Landsat-based 30-m resolution product of fire and harvest detection and attribution since 1984. https://doi.org/10.23687/add1346b-f632-4eb9-a83d-a662b38655ad
-
Deforestation in Canada is estimated with the National Deforestation Monitoring System (NDMS). Details describing this process are published here: https://cfs.nrcan.gc.ca/publications?id=36042. Deforestation is the direct human-induced conversion of forested land to non-forested land use. Canada’s National Deforestation Monitoring System (NDMS) was designed and implemented to provide information needed by Canada to meet its obligation under the United Nations Framework Convention on Climate Change (UNFCCC) to report the areas affected annually by deforestation. It also provides important information for the public, government policy makers, and scientists. To provide information about the amount of deforestation and why, where, and when it occurred in Canada, the NDMS uses deforestation mapped on a system of sample areas. The mapping is based on visual interpretation of satellite imagery supported by available ancillary information, such as high resolution imagery, forest inventory, and industrial databases, and informed by records-based information and expert knowledge. Accurate detection and mapping of deforestation events involves manual interpretation of satellite remote sensing imagery by specialized analysts. A key factor in the mapping is to distinguish deforestation from other forest cover losses that occur in Canada. The NDMS was designed to make use of all available lines of evidence and be flexible to accommodate variable resourcing levels. This system has been producing national deforestation monitoring results annually since 2006. The flexibility of the NDMS’s design makes it possible to adapt to future changes in data and resource availability, and positions the program well for sustained operational delivery into the future.
-

This data publication contains a set of 30m resolution raster files representing Canadian wall-to-wall maps, at 5-year intervals from 1985 to 2025, of broad landcover type, forest canopy height, degree of crown closure and aboveground tree biomass, along with species composition of several major tree species. The Spatialized CAnadian National Forest Inventory data product (SCANFI) was developed using the newly updated National Forest Inventory photo-plot dataset, which consists of a regular sample grid of photo-interpreted high-resolution imagery covering all of Canada’s non-arctic landmass. SCANFI was produced using temporally harmonized summer and winter Landsat spectral imagery along with hundreds of tile-level regional models based on a novel k-nearest neighbours (k-NN) and random forest imputation method. SCANFI is not meant to replace nor ignore provincial inventories which could include better and more regularly updated inputs, training data and local knowledge. Instead, SCANFI was developed to provide a current, spatially-explicit estimate of forest attributes, using a consistent data source and methodology across all provincial boundaries and territories. SCANFI is the first coherent 30m Canadian wall-to-wall map of tree structure and species composition and opens novel opportunities for a wide range of studies in a number of areas, such as forest economics, fire science and ecology. SCANFI v2 is described here. The main methodological and performance differences between SCANFI v1 (https://doi.org/10.23687/18e6a919-53fd-41ce-b4e2-44a9707c52dc) and SCANFI v2 are briefly outlined below. For a more detailed description of these changes, please consult the accompanying report. For the scientific publication about SCANFI v1, see Guindon et al. (2024). **SCANFI version 2 main updates** 1. Transition to Landsat Collection 2 Updated all Landsat time series inputs from Collection 1 to Collection 2, providing improved radiometric calibration and geometric consistency across sensors and years. 2. SCANFI time series with LandTrendr-smoothed winter imagery Introduced LandTrendr-smoothed winter imagery, enabling a full 5-year interval time series from 1985 to 2025 with dual-season inputs. 3. Updated climate normals Replaced previous climate layers with smoother 1991–2020 normals (MacDonald et al. 2024), eliminating tiling artifacts. 4. Increased sample selection density of NFI training data Shifted from a photoplot-level 250m systematic grid to a denser sampling strategy: 4 pixels/hectare per polygon (max 100 points, excluding border pixels). This sampling strategy greatly increased the number of training points available, improving representation of inter- and intra-polygon variability and strengthening model performance. 5. More accurate water prediction and delineation of urban areas and croplands Water and cropland prediction is now done using a soon-to-be-published landcover time series layer in order to: (i) prevent the misclassification of recently disturbed areas as water in SCANFI v1; and (ii) convert urban areas and croplands to forested land before 2020 when the Agriculture and Agri-Food Canada (AAFC) land use map used in the original study is not available (Agriculture and Agri-Food Canada, 2022). 6. Forest age map SCANFI v2 introduces new national forest age maps by combining recent disturbance history data with spatialized NFI age estimates for undisturbed stands, producing consistent stand age attribution across Canada from 1985 to 2025, at 5-year intervals. The resulting approach reduces noise relative to single-year estimates and yields spatially complete, temporally stable forest age maps. 7. Modified response and target variable sets Water is no longer used as a target variable, whereas land position (alpine, wetland or upland) was added to the target variable list and is now an output layer. The selection of Landsat bands and indices used in modeling was also refined, improving sensitivity to forest structure, composition, and disturbance. Finally, SCANFI now relies on the recently published Canadian Medium Resolution Digital Elevation Model (Government of Canada, Natural Resources Canada, Strategic Policy and Innovation Sector, 2025). See update report for more details. 8. Improved extrapolation of arctic ecozones The tile-level approach used to extrapolate arctic ecozones outside the sampling range of the NFI photoplots was replaced by the use of two training sets to predict two distinct geographical northern areas: (1) northern Quebec; and (2) northern Northwest Territories and Nunavut. This approach considerably improved model reliability and consistency in the arctic ecozones. 9. Updated time-since-disturbance layers Integrated complete 1965-2025 harvest and fire records (Correia et al. 2024; Perbet et al. 2025), improving disturbance history initialization and enhancing stand-structure attribution. 10. Modified tree species cover layers In order to avoid interpretation errors and facilitate user analyses, SCANFI v2 tree species layers now represent the corresponding tree species crown closure, instead of the proportion of the overall crown closure that is represented by that species. Unlike SCANFI v1, users no longer need to multiply overall crown closure by tree species proportion (and divide by 100) to obtain tree species crown closure. Examples include: - A pixel with 30% total crown closure composed of 50% black spruce and 50% jack pine will have 15% black spruce crown closure and 15% jack pine crown closure in SCANFI v2. - A pixel with 40% total crown closure entirely dominated by balsam fir will have 40% balsam fir crown closure in SCANFI v2. - A pixel with 100% total crown closure composed of 60% black spruce and 40% balsam fir will have 60% black spruce and 40% balsam fir crown closure in both SCANFI v1 and SCANFI v2. Tree species aboveground biomass can still be obtained by estimating the proportion of the corresponding tree species relative to pixel-level crown closure and multiplying that value by pixel-level biomass. **Validation summary and comparison with version 1** External validation results show that SCANFI v2 consistently outperforms SCANFI v1 across all independent datasets used in Guindon et al. (2024). Structural attributes validated with Global Ecosystem Dynamics Investigation (GEDI), Potapov et al. (2021), and airborne lidar exhibit R² gains of approximately 2-3 points and modest reductions in RMSE and MAE, indicating improved estimates of height and crown closure. Species composition shows the largest improvements, with R² increases of roughly 4 to more than 15 points for key species such as black spruce, jack pine, tamarack, and the broadleaf grouping (see the update report for more details). Biomass estimates also improve, with smaller but consistent gains in explained variance and reduced error across ground-plot datasets. In contrast, internal cross-validation metrics are slightly lower for v2, reflecting the effect of a complex training dataset with much more forested samples rather than reduced real-world predictive performance. **SCANFI time series** SCANFI v2 provides a publicly available 5-year interval national time series (1985–2025) based on LandTrendr-smoothed summer and winter Landsat imagery with cross-sensor harmonization. Pixel-level temporal inconsistencies remain by design to preserve traceability and consistency across attributes, making the time series unsuitable for plot-level analyses but reliable for large-scale regional and national assessments where noise averages out. Although not intended for detailed biomass trend analysis, the estimated national biomass increase of approximately 4.8% between 1985 and 2025 suggests ecologically plausible values, pending further evaluation. **Limitations** 1. The spectral disturbances of some areas disturbed by pests are not comprehensively represented in the training set, thus making it impossible to predict all defoliation cases. One such area, severely impacted by the recent eastern spruce budworm outbreak, is located on the North Shore of the St. Lawrence River. These forests are misrepresented in our training data; therefore, our estimates in these areas are imprecise. 2. Attributes of open stand classes, namely shrub, herb, rock and bryoid, are more difficult to estimate through the photointerpretation of aerial images. Therefore, these estimates could be less reliable than the forest attribute estimates. 3. As reported in the manuscript, the uncertainty of tree species cover predictions is relatively high. This is particularly true for less abundant tree species, such as ponderosa pine and tamarack. The tree species layers are therefore suitable for regional and coarser scale studies. 4. Our validation indicates that the areas in Yukon exhibit a notably lower R² value. Consequently, estimates within these regions are less dependable. 5. Urban areas and roads are classified as rock, according to the 2020 Agriculture and Agri-Food Canada land-use classification map (Agriculture and Agri-Food Canada, 2022). Even though those areas contain mostly buildings and infrastructure, they may also contain trees. Forested urban parks are usually classified as forested areas. Vegetation attributes are also predicted for forested areas in agricultural regions. **Data download** The data can be downloaded from the FTP server (ftp.maps.canada.ca/pub/nrcan_rncan/Forests_Foret/SCANFI/v2/), referenced in the “Data and Resources” section, using a browser download manager or an external client such as FileZilla. **Dataset citation** - Guindon L., Correia D.L.P, Manka F. and Smiley B. 2026. SCANFI v2: Spatialized CAnadian National Forest Inventory data product v2. Natural Resources Canada, Canadian Forest Service, Laurentian Forestry Centre, Quebec, Canada. https://doi.org/10.23687/07653869-f303-46c2-a04e-9ab479b73cbf **References** - Agriculture and Agri-Food Canada. (2022). 2020 AAFC Land Use [Map]. Retrieved from https://open.canada.ca/data/en/dataset/7a098ea9-cc31-4d79-b326-89f6cd1fbb7d. - Correia, D.L., Guindon, L. and Parisien, M.A., 2024. Extending Canadian forest disturbance history maps prior to 1985. Ecosphere, 15(8), p.e4956. - Guindon, L., Manka, F., Correia, D.L., Villemaire, P., Smiley, B., Bernier, P., Gauthier, S., Beaudoin, A., Boucher, J. and Boulanger, Y., 2024. A new approach for Spatializing the Canadian National Forest Inventory (SCANFI) using Landsat dense time series. Canadian Journal of Forest Research, 54(7), pp.793-815. - MacDonald, H., McKenney, D.W., Pedlar, J., Lawrence, K., de Boer, K. and Hutchinson, M.F., 2024. Spatial datasets of 30-year (1991–2020) average monthly total precipitation and minimum/maximum temperature for Canada and the United States. Data in Brief, 55, p.110561. - Government of Canada, Natural Resources Canada, Strategic Policy and Innovation Sector. (2025, August 28). Medium Resolution Digital Elevation Model (MRDEM) - CanElevation Series. Natural Resources Canada, Federal Geospatial Platform. https://osdp-psdo.canada.ca/dp/en/search/metadata/NRCAN-FGP-1-18752265-bda3-498c-a4ba-9dfe68cb98da - Perbet, P., Guindon, L., Correia, D.L., Gahrouei, O.R., Côté, J.F. and Béland, M., 2025. Historical insect disturbance maps from 1985 onwards for Canadian forests derived using earth observation data. Scientific Data. - Potapov, P., Li, X., Hernandez-Serna, A., Tyukavina, A., Hansen, M.C., Kommareddy, A., Pickens, A., Turubanova, S., Tang, H., Silva, C.E. and Armston, J., 2021. Mapping global forest canopy height through integration of GEDI and Landsat data. Remote Sensing of Environment, 253, p.112165.
-
**1. Overview** Pre-CanLaD v2 updates Canada's 1965-1984 forest disturbance history dataset initially published by Correia et al. (2024) with enhanced detection methods and improved temporal accuracy and coverage. **2. Key Updates in pre-CanLaD v2** **2.1. Enhanced Detection** - Fractional land-cover change analysis identifies post-disturbance forest regeneration using 1985-2020 vegetation cover differences - Dual detection approach combines automated polygon-based classification with manual photo-interpretation - Incorporates National Burn Area Composite (NBAC; Skakun et al., 2022) 1972-1984 fire perimeters for improved fire year attribution **2.2. Detection Results** See **Table 1 in the update report**, available in the download section below. This table presents the total disturbed areas, by disturbance type, for the periods 1950–1964 and 1965–1984. The “New detection” column represents disturbed areas for which no reliable previous data were available. The “Previously recorded” column represents disturbed areas already documented in the datasets described in Table 3 of Correia et al. (2024) and NBAC, for which the predicted disturbance year was subsequently adjusted. **3. Dataset description** Four raster layers available: - preCanLaD_disturbanceType_v2_20251126.tif - Pixel values are disturbance type: - 2 = Fire - 3 = Harvest - 4 = Insect - preCanLaD_disturbanceYear_v2_20251126.tif - Pixel values are disturbance year: - 1950-1984 = years - 999 = unknown (user should convert this value to 1955) - preCanLaD_correctionMask_v2_20251126.tif - Pixel values are data provenance codes: - 0 = Pre-CanLaD-only disturbance - 1 = Confirmed fire (manual or confirmed by pre-CanLaD v1 in the original publication) - 11 = Canadian National Fire Database (CNFDB) corrected fire - 12 = NBAC-corrected fire - 2 = Confirmed harvest - preCanLaD_updateMask_v2_20251126.tif - Pixel values are version change indicator: - 1 = v1 retained - 2 = v2 new/updated **4. Key Improvements** - Improved fire-harvest discrimination through provincial harvest polygon integration - Hierarchical dating system prioritizes NBAC > CNFDB polygons > CNFDB points > model-based dates > manual interpretation and unknown dates - Better harmonization with current historic disturbance records - Quality controls: 11-pixel minimum patch size, 1985-2020 disturbance masking **5. Known Limitations** - Some temporal uncertainty remains; grouping disturbance years into age classes can help mitigate its effects.High-severity burns preferentially detected; low-severity fires may be missed, along with fires in non-forested and open forest areas with low forest recovery rates - Some fire-harvest confusion in transition zones - Harvest detections may be biased toward provinces with publicly available forest inventories because the pre-CanLaD v2 method relies on these inventories to identify additional harvested areas - No pixel-level dates for insect outbreaks **6. Data download** The data can be downloaded from the FTP server (ftp.maps.canada.ca/pub/nrcan_rncan/Forests_Foret/canada_disturbances_1965to1984/v2/), referenced in the “Data and Resources” section, using a browser download manager, such as DownThemAll, or an external client such as FileZilla. **7. Dataset citation** - Guindon L., Correia D.L.P. and S. Brisson. 2026. Pre-CanLaD v2: Canada Landsat Disturbance (CanLaD) 30-m resolution disturbance detection prior to 1984. https://doi.org/10.23687/8d49698f-40f9-40da-b097-a3f4c90adf5a **8. Reference** - Correia, David L., Luc Guindon, and Marc-André Parisien. 2024. “Extending Canadian Forest Disturbance History Maps Prior to 1985.” Ecosphere 15 (8): e4956. - Natural Resources Canada. 2023. Canadian National Fire Database Natural Resources Canada. Edmonton: Canadian Forest Service, Northern Forestry Centre. https://cwfis.cfs.nrcan.gc.ca. - Skakun, R., G. Castilla, J. Metsaranta, E. Whitman, S. Rodrigue, J. Little, K. Groenewegen, and M. Coyle. 2022. “Extending the National Burned Area Composite Time Series of Wildfires in Canada.” Remote Sensing 14: 3050. ___ For detailed methodology, see download links, file “Pre-CanLaD_v2_Update_report_EN.pdf”