Forestry
Type of resources
Available actions
Topics
Keywords
Contact for the resource
Provided by
Formats
Representation types
Update frequencies
status
Resolution
-

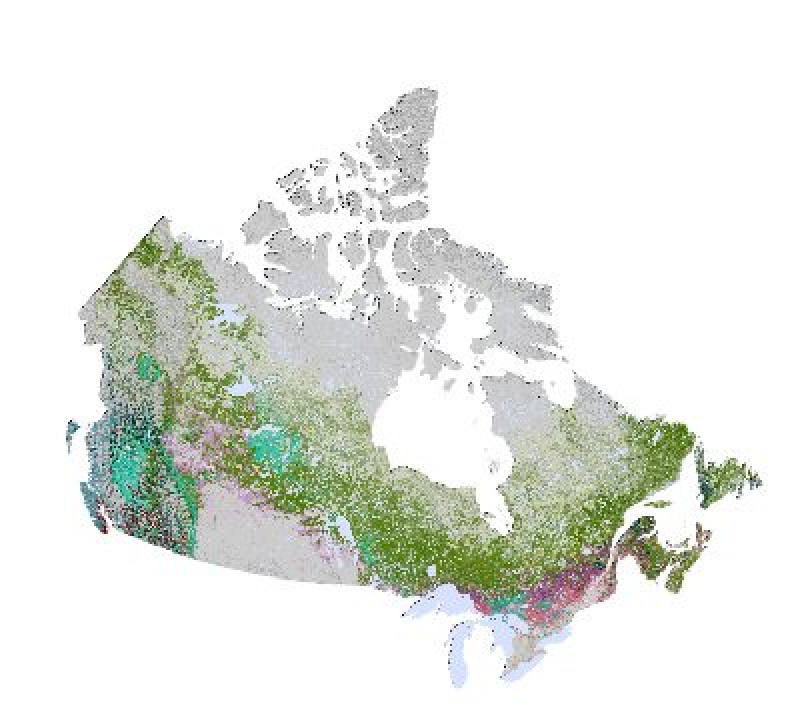
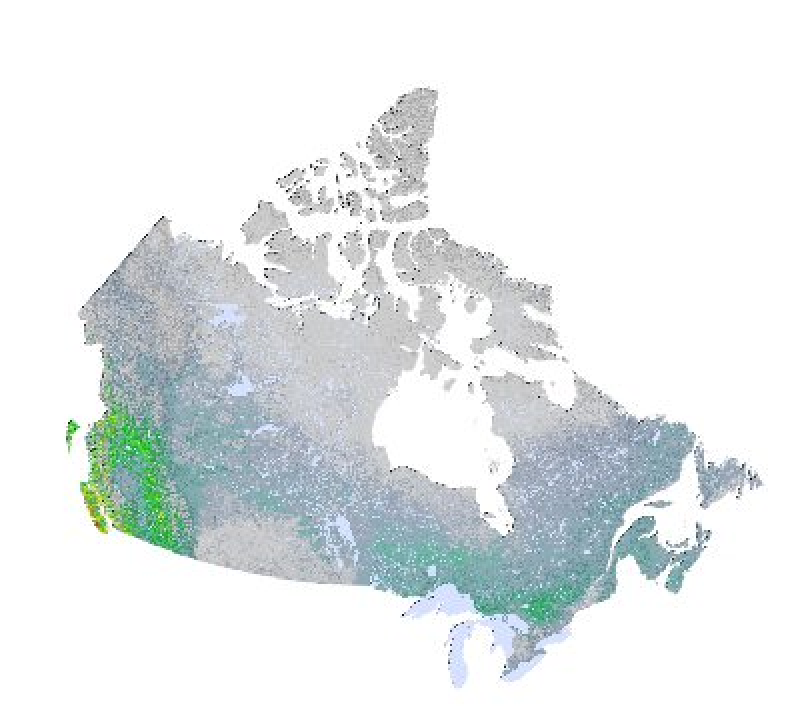
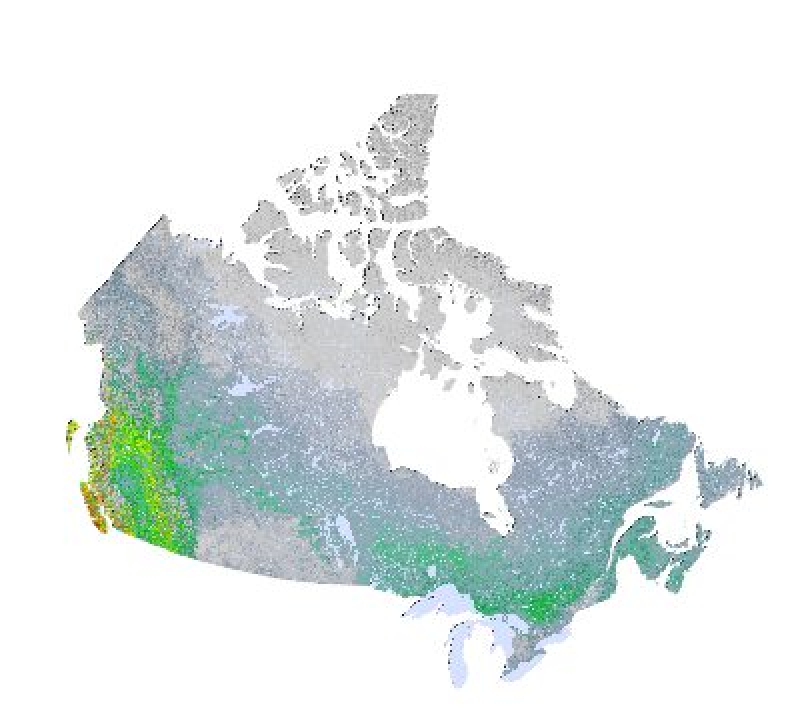
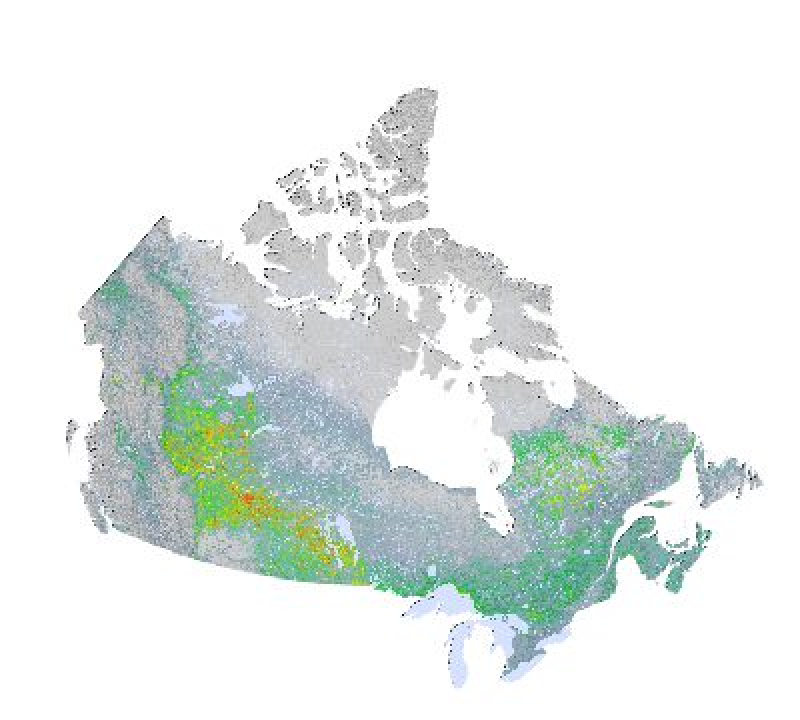
The raster maps depict a suite of forest attributes in 2001* and 2011 at 250 m by 250 m spatial resolution. The maps were produced using the k nearest neighbours method applied to MODIS imagery and trained from National Forest Inventory photo plot data. For detailed information about map production methods please refer to Beaudoin et al. (2018) "Tracking forest attributes across Canada between 2001 and 2011 using the k nearest neighbours mapping approach applied to MODIS imagery." Canadian Journal of Forest Research 48, 85-93. https://cfs.nrcan.gc.ca/publications?id=38979 The map datasets may be downloaded from https://nfi.nfis.org/downloads/nfi_knn2011.zip or https://open.canada.ca/data/en/dataset/ec9e2659-1c29-4ddb-87a2-6aced147a990 * Note: the forest composition (leading tree genus) map depicts forest attributes in 2001. How can this data be used? The resolution and accuracy of these map products are best suited for strategic-level forest reporting and informing policy and decision making at regional to national scales. As these maps also offer a coherent set of quantitative values for a large suite of forest attributes, they can be used as baseline information for modelling and in calculations such as merchantable forest volume or percentage of tree species. It is also possible to overlay these maps with other maps produced on the same pixel grid to make assessments of disturbance impacts, such as fire and harvests.
-

Canada’s NFI survey was designed to provide an unbiased probability sample of Canada’s forests for long-term strategic monitoring purposes. The target population is Canada’s entire non-Arctic land area. A National Terrestrial Monitoring Framework (NTMF) was created by establishing a systematic 4 km by 4 km sampling grid over all of Canada from a random offshore point. Prior to T0, NFI partners determined that the NFI program would be able to affordably achieve its mission by establishing a 2 km by 2 km (400 ha) “photo plot” at every fifth sampling point on the NTMF (i.e. every 20 km), thereby providing a one percent sample of the target population. This sampling intensity was considered sufficient for national reporting and possible to sustain over the long term with anticipated funding. Photo plots were established across Canada during 2000-2006 (T0). There are 26,139 photo plot survey locations on the 20 km by 20 km grid, of which 18,570 lie inside the target population area. For each photo plot, information is collected on land cover, land use, ownership and protection status. NFI photo plot survey data are stratified by “NFI Unit” for standard estimation and reporting purposes. NFI Units were created by the geographic intersection of Canada’s 10 provinces, 3 territories and 12 non-Arctic terrestrial ecozones. Estimates produced for NFI Units are rolled up to produce standard reports for ecozones, jurisdictions (provinces and territories) and Canada. Some NFI Units are too small to produce robust estimates for with the current sampling intensity, so NFI Unit estimates are not publicly reported. Prince Edward Island (PEI) Atlantic Maritime, for example, is PEI’s only NFI Unit and it is small (1% sampling intensity achieved with only 19 photo plots), so the NFI avoids publishing provincial reports. Information consumers are encouraged to use official statistics produced by provincial and territorial governments for the forests in their jurisdictions. Most provinces are large, however, and the current NFI sampling intensity is sufficient for producing robust NFI reports for those jurisdictions. Special estimation reports can be produced using different ecological or administrative strata, such as the Boreal Zone, or the Managed Forest. NFI photo plots are surveyed on a ten-year cycle. During first re-measurement (T1; 2008-2017), survey intensity was reduced to one photo plot every 40 km across northern Canada (Figure 3) because of budget limitations. The T2 survey (2018-2027) is currently underway.
-

Canada's National Forest Inventory (NFI) sampling program is designed to support reporting on forests at the national scale. On the other hand, continuous maps of forest attributes are required to support strategic analyses of regional policy and management issues. We have therefore produced maps covering 4.03 × 10⁶ km2 of inventoried forest area for the 2001 base year using standardised observations from the NFI photo plots (PP) as reference data. We used the k nearest neighbours (kNN) method with 26 geospatial data layers including MODIS spectral data and climatic and topographic variables to produce maps of 127 forest attributes at a 250 × 250 m resolution. The stand-level attributes include land cover, structure, and tree species relative abundance. In this article, we report only on total live aboveground tree biomass, with all other attributes covered in the supplementary data (http://nrcresearchpress.com/doi/suppl/10.1139/cjfr-2013-0401). In general, deviations in predicted pixel-level values from those in a PP validation set are greater in mountainous regions and in areas with either low biomass or sparse PP sampling. Predicted pixel-level values are overestimated at small observed values and underestimated at large ones. Accuracy measures are improved through the spatial aggregation of pixels to 1 km2 and beyond. Overall, these new products provide unique baseline information for strategic-level analyses of forests (https://nfi.nfis.org) Collection: - **[Canada's National Forest Inventory (NFI) 2006](https://open.canada.ca/data/en/dataset/e2fadaeb-3106-4111-9d1c-f9791d83fbf4)**
-

Canada's National Forest Inventory (NFI) sampling program is designed to support reporting on forests at the national scale. On the other hand, continuous maps of forest attributes are required to support strategic analyses of regional policy and management issues. We have therefore produced maps covering 4.03 × 10⁶ km2 of inventoried forest area for the 2001 base year using standardised observations from the NFI photo plots (PP) as reference data. We used the k nearest neighbours (kNN) method with 26 geospatial data layers including MODIS spectral data and climatic and topographic variables to produce maps of 127 forest attributes at a 250 × 250 m resolution. The stand-level attributes include land cover, structure, and tree species relative abundance. In this article, we report only on total live aboveground tree biomass, with all other attributes covered in the supplementary data (http://nrcresearchpress.com/doi/suppl/10.1139/cjfr-2013-0401). In general, deviations in predicted pixel-level values from those in a PP validation set are greater in mountainous regions and in areas with either low biomass or sparse PP sampling. Predicted pixel-level values are overestimated at small observed values and underestimated at large ones. Accuracy measures are improved through the spatial aggregation of pixels to 1 km2 and beyond. Overall, these new products provide unique baseline information for strategic-level analyses of forests (https://nfi.nfis.org) Collection: - **[Canada's National Forest Inventory (NFI) 2006](https://open.canada.ca/data/en/dataset/e2fadaeb-3106-4111-9d1c-f9791d83fbf4)**
-

Canada's National Forest Inventory (NFI) sampling program is designed to support reporting on forests at the national scale. On the other hand, continuous maps of forest attributes are required to support strategic analyses of regional policy and management issues. We have therefore produced maps covering 4.03 × 10⁶ km2 of inventoried forest area for the 2001 base year using standardised observations from the NFI photo plots (PP) as reference data. We used the k nearest neighbours (kNN) method with 26 geospatial data layers including MODIS spectral data and climatic and topographic variables to produce maps of 127 forest attributes at a 250 × 250 m resolution. The stand-level attributes include land cover, structure, and tree species relative abundance. In this article, we report only on total live aboveground tree biomass, with all other attributes covered in the supplementary data (http://nrcresearchpress.com/doi/suppl/10.1139/cjfr-2013-0401). In general, deviations in predicted pixel-level values from those in a PP validation set are greater in mountainous regions and in areas with either low biomass or sparse PP sampling. Predicted pixel-level values are overestimated at small observed values and underestimated at large ones. Accuracy measures are improved through the spatial aggregation of pixels to 1 km2 and beyond. Overall, these new products provide unique baseline information for strategic-level analyses of forests (https://nfi.nfis.org) Collection: - **[Canada's National Forest Inventory (NFI) 2006](https://open.canada.ca/data/en/dataset/e2fadaeb-3106-4111-9d1c-f9791d83fbf4)**
-

Canada’s NFI survey was designed to provide an unbiased probability sample of Canada’s forests for long-term strategic monitoring purposes. The target population is Canada’s entire non-Arctic land area. A National Terrestrial Monitoring Framework (NTMF) was created by establishing a systematic 4 km by 4 km sampling grid over all of Canada from a random offshore point. Prior to T0, NFI partners determined that the NFI program would be able to affordably achieve its mission by establishing a 2 km by 2 km (400 ha) “photo plot” at every fifth sampling point on the NTMF (i.e. every 20 km), thereby providing a one percent sample of the target population. This sampling intensity was considered sufficient for national reporting and possible to sustain over the long term with anticipated funding. Photo plots were established across Canada during 2000-2006 (T0). There are 26,139 photo plot survey locations on the 20 km by 20 km grid, of which 18,570 lie inside the target population area. For each photo plot, information is collected on land cover, land use, ownership and protection status. NFI photo plot survey data are stratified by “NFI Unit” for standard estimation and reporting purposes. NFI Units were created by the geographic intersection of Canada’s 10 provinces, 3 territories and 12 non-Arctic terrestrial ecozones. Estimates produced for NFI Units are rolled up to produce standard reports for ecozones, jurisdictions (provinces and territories) and Canada. Some NFI Units are too small to produce robust estimates for with the current sampling intensity, so NFI Unit estimates are not publicly reported. Prince Edward Island (PEI) Atlantic Maritime, for example, is PEI’s only NFI Unit and it is small (1% sampling intensity achieved with only 19 photo plots), so the NFI avoids publishing provincial reports. Information consumers are encouraged to use official statistics produced by provincial and territorial governments for the forests in their jurisdictions. Most provinces are large, however, and the current NFI sampling intensity is sufficient for producing robust NFI reports for those jurisdictions. Special estimation reports can be produced using different ecological or administrative strata, such as the Boreal Zone, or the Managed Forest. NFI photo plots are surveyed on a ten-year cycle. During first re-measurement (T1; 2008-2017), survey intensity was reduced to one photo plot every 40 km across northern Canada (Figure 3) because of budget limitations. The T2 survey (2018-2027) is currently underway.
-

Canada's National Forest Inventory (NFI) sampling program is designed to support reporting on forests at the national scale. On the other hand, continuous maps of forest attributes are required to support strategic analyses of regional policy and management issues. We have therefore produced maps covering 4.03 × 10⁶ km2 of inventoried forest area for the 2001 base year using standardised observations from the NFI photo plots (PP) as reference data. We used the k nearest neighbours (kNN) method with 26 geospatial data layers including MODIS spectral data and climatic and topographic variables to produce maps of 127 forest attributes at a 250 × 250 m resolution. The stand-level attributes include land cover, structure, and tree species relative abundance. In this article, we report only on total live aboveground tree biomass, with all other attributes covered in the supplementary data (http://nrcresearchpress.com/doi/suppl/10.1139/cjfr-2013-0401). In general, deviations in predicted pixel-level values from those in a PP validation set are greater in mountainous regions and in areas with either low biomass or sparse PP sampling. Predicted pixel-level values are overestimated at small observed values and underestimated at large ones. Accuracy measures are improved through the spatial aggregation of pixels to 1 km2 and beyond. Overall, these new products provide unique baseline information for strategic-level analyses of forests (https://nfi.nfis.org) Collection: - **[Canada's National Forest Inventory (NFI) 2006](https://open.canada.ca/data/en/dataset/e2fadaeb-3106-4111-9d1c-f9791d83fbf4)**
-

The raster maps depict a suite of forest attributes in 2001* and 2011 at 250 m by 250 m spatial resolution. The maps were produced using the k nearest neighbours method applied to MODIS imagery and trained from National Forest Inventory photo plot data. For detailed information about map production methods please refer to Beaudoin et al. (2018) "Tracking forest attributes across Canada between 2001 and 2011 using the k nearest neighbours mapping approach applied to MODIS imagery." Canadian Journal of Forest Research 48, 85-93. https://cfs.nrcan.gc.ca/publications?id=38979 The map datasets may be downloaded from https://nfi.nfis.org/downloads/nfi_knn2011.zip or https://open.canada.ca/data/en/dataset/ec9e2659-1c29-4ddb-87a2-6aced147a990 * Note: the forest composition (leading tree genus) map depicts forest attributes in 2001. How can this data be used? The resolution and accuracy of these map products are best suited for strategic-level forest reporting and informing policy and decision making at regional to national scales. As these maps also offer a coherent set of quantitative values for a large suite of forest attributes, they can be used as baseline information for modelling and in calculations such as merchantable forest volume or percentage of tree species. It is also possible to overlay these maps with other maps produced on the same pixel grid to make assessments of disturbance impacts, such as fire and harvests.
-

Canada’s NFI survey was designed to provide an unbiased probability sample of Canada’s forests for long-term strategic monitoring purposes. The target population is Canada’s entire non-Arctic land area. A National Terrestrial Monitoring Framework (NTMF) was created by establishing a systematic 4 km by 4 km sampling grid over all of Canada from a random offshore point. Prior to T0, NFI partners determined that the NFI program would be able to affordably achieve its mission by establishing a 2 km by 2 km (400 ha) “photo plot” at every fifth sampling point on the NTMF (i.e. every 20 km), thereby providing a one percent sample of the target population. This sampling intensity was considered sufficient for national reporting and possible to sustain over the long term with anticipated funding. Photo plots were established across Canada during 2000-2006 (T0). There are 26,139 photo plot survey locations on the 20 km by 20 km grid, of which 18,570 lie inside the target population area. For each photo plot, information is collected on land cover, land use, ownership and protection status. NFI photo plot survey data are stratified by “NFI Unit” for standard estimation and reporting purposes. NFI Units were created by the geographic intersection of Canada’s 10 provinces, 3 territories and 12 non-Arctic terrestrial ecozones. Estimates produced for NFI Units are rolled up to produce standard reports for ecozones, jurisdictions (provinces and territories) and Canada. Some NFI Units are too small to produce robust estimates for with the current sampling intensity, so NFI Unit estimates are not publicly reported. Prince Edward Island (PEI) Atlantic Maritime, for example, is PEI’s only NFI Unit and it is small (1% sampling intensity achieved with only 19 photo plots), so the NFI avoids publishing provincial reports. Information consumers are encouraged to use official statistics produced by provincial and territorial governments for the forests in their jurisdictions. Most provinces are large, however, and the current NFI sampling intensity is sufficient for producing robust NFI reports for those jurisdictions. Special estimation reports can be produced using different ecological or administrative strata, such as the Boreal Zone, or the Managed Forest. NFI photo plots are surveyed on a ten-year cycle. During first re-measurement (T1; 2008-2017), survey intensity was reduced to one photo plot every 40 km across northern Canada (Figure 3) because of budget limitations. The T2 survey (2018-2027) is currently underway.
-

Canada's National Forest Inventory (NFI) sampling program is designed to support reporting on forests at the national scale. On the other hand, continuous maps of forest attributes are required to support strategic analyses of regional policy and management issues. We have therefore produced maps covering 4.03 × 10⁶ km2 of inventoried forest area for the 2001 base year using standardised observations from the NFI photo plots (PP) as reference data. We used the k nearest neighbours (kNN) method with 26 geospatial data layers including MODIS spectral data and climatic and topographic variables to produce maps of 127 forest attributes at a 250 × 250 m resolution. The stand-level attributes include land cover, structure, and tree species relative abundance. In this article, we report only on total live aboveground tree biomass, with all other attributes covered in the supplementary data (http://nrcresearchpress.com/doi/suppl/10.1139/cjfr-2013-0401). In general, deviations in predicted pixel-level values from those in a PP validation set are greater in mountainous regions and in areas with either low biomass or sparse PP sampling. Predicted pixel-level values are overestimated at small observed values and underestimated at large ones. Accuracy measures are improved through the spatial aggregation of pixels to 1 km2 and beyond. Overall, these new products provide unique baseline information for strategic-level analyses of forests (https://nfi.nfis.org) Collection: - **[Canada's National Forest Inventory (NFI) 2006](https://open.canada.ca/data/en/dataset/e2fadaeb-3106-4111-9d1c-f9791d83fbf4)**
 Arctic SDI catalogue