 Arctic SDI catalogue
1.1.3. Migratory Birds
Type of resources
Available actions
Topics
Keywords
Contact for the resource
Provided by
Formats
Representation types
Update frequencies
status
-
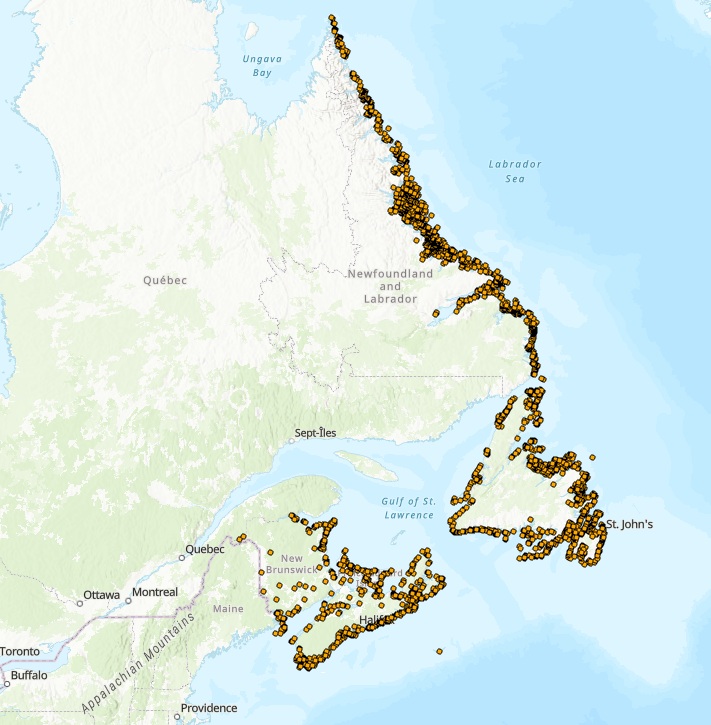
The Atlantic Colonial Waterbird Monitoring database captures geo-referenced data collected under the Atlantic Region’s Canadian Wildlife Service (CWS) Colonial Seabird Monitoring program, and data collected under CWS’ waterfowl and protected areas programs. These programs collectively monitor 22 species of colonial waterbirds breeding in the Atlantic Region of the following groups: fulmars, shearwaters, storm-petrels, gannets, gulls, terns, alcids, eiders, herons and cormorants, with the primary outcome to update information on the distribution, status, and trends of waterbirds breeding in all four Atlantic provinces. Surveys are conducted using one of three platforms: aerial, boat, or ground. Aerial surveys provide the most cost-effective way of conducting a comprehensive population census of diurnal species visible from air, namely gulls (Herring, Great Black-backed, Ring-billed, Glaucous), Black-legged Kittiwakes, Northern Gannets, terns (Arctic, Common, Roseate, Caspian), cormorants (Greater, Double-crested), Black Guillemots, and Common Eiders. Aerial surveys are also effective in identifying new colonies and provide additional information on how to most effectively conduct boat and ground surveys. Boat and ground surveys are conducted at smaller geographic scales and are necessary to obtain complementary information on the species composition of colonies and correction factors to finalize gull, tern and eider estimates obtained from the aerial surveys. Ground and/or boat surveys are also necessary to conduct colony counts of cliff-nesting birds (murres and fulmars), crevice nesting birds (razorbills and guillemots) and burrow-nesting birds (puffins, storm-petrels, shearwaters). Raw data are captured using various survey methods, including:1) visual estimates, 2) direct counts of number of individuals or apparently occupied sites and/or photo counts, 3) sub-sampling the colony through plot counts and extrapolating the estimated occupied densities over the occupied area which in turn is estimated using a variety of geographic information system approaches (e.g., Wilhelm et al. 2015). Important outcomes for how data are used include informing marine spatial planning, emergency preparedness, impact assessment of various anthropogenic threats, and COSEWIC status assessment (e.g., COSEWIC 2020). Further, these data are regularly used internally or in collaboration with partners to form the basis of peer-reviewed publications on regional, national, and/or global population trends for target species (e.g., Langlois Lopez et al. 2022, Iles et al. 2025). This dataset represents a subset of data collected from surveys led by CWS spanning from 1910 to 2024 and summarized to present, at a given colony, the year and count of birds from the most recent survey, the year and maximum count of birds within the last 20 years (if available), and the year and maximum count of birds ever recorded. In addition, CWS works closely with a variety of partners (e.g., provincial, other federal departments, academic, not-for profit organizations) to supplement colonial waterbird data collected in the Atlantic Region. To request additional census or survey data, please contact CWS. COSEWIC. 2020. COSEWIC assessment and status report on the Leach’s Storm-Petrel (Atlantic population) Oceanodroma leucorhoa in Canada. Committee on the Status of Endangered Wildlife in Canada. Ottawa. xii + 70 pp. (https://www.canada.ca/en/environment-climate-change/services/species-risk-public-registry.html). Iles, D.T., S.E. Gutowsky, A.M. Calvert, S.I. Wilhelm, J.-F. Rail, A. Hedd, H.L. Major, A.C. Smith, and G.J. Robertson. 2025. Estimating regional trajectories and trends of seabirds from sparse and inconsistent colony counts: case studies from eastern Canada with Leach’s Storm-Petrel and Atlantic Puffin. Avian Conservation and Ecology 20(2):16. https://doi.org/10.5751/ACE-02931-200216 Langlois Lopez, S., Bond, A.L., O’Hanlon, N.J., Wilson, J.M., Vitz, A., Mostello, C.S., Hamilton, F., Rail, J.-F., Welch, L., Boettcher, R., Wilhelm, S.I., Anker-Nilssen, T., Daunt, F., and Masden, E. 2022. Global population and conservation status of the Great Black-backed Gull Larus marinus. Bird Conservation International, 1–11. https://doi.org/10.1017/S0959270922000181 Wilhelm, S.I., Mailhiot, J., Arany, J., Chardine, J.W., Robertson, G.J., and Ryan, P.C. 2015. Update and trends of three important seabird populations in the western North Atlantic using a geographic information system approach. Marine Ornithology 43: 211-222.
-
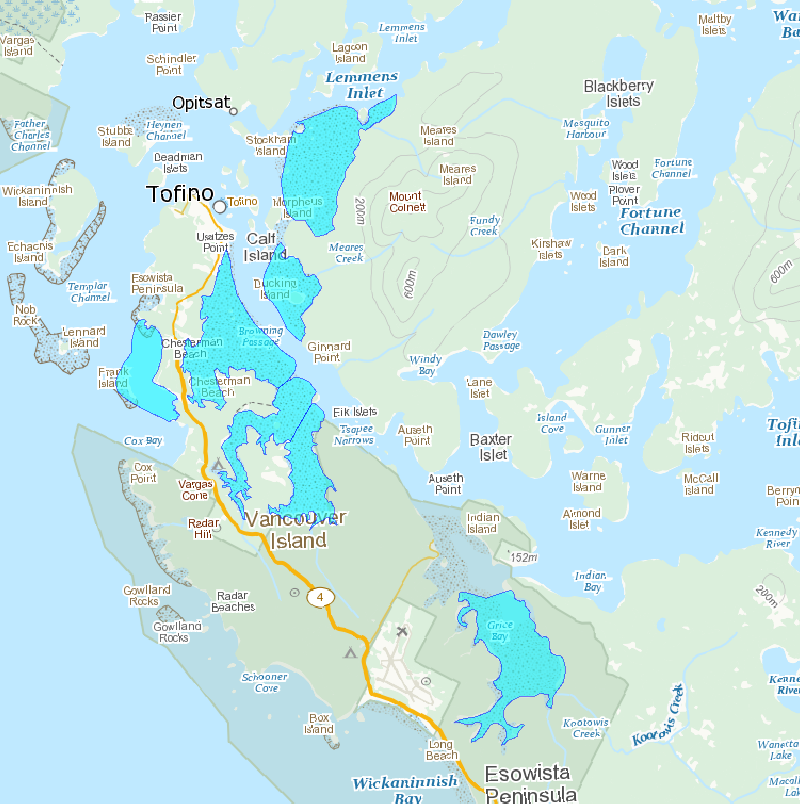
Survey areas is a polygon feature class containing mudflats and staging areas observed for shorebirds.
-

Sidney Island Shorebirds Survey transects line feature.
-
The Canadian Breeding Bird Census (BBC) Database contains data for 928 breeding bird plot censuses representing all known censuses of breeding birds carried out in Canada during the period 1929–1993. The 928 records in the database represent 640 unique census plots located in all provinces and territories, except Prince Edward Island. The BBC, which was replaced by the current Breeding Bird Survey, is one of the longest-running surveys of bird populations in North America, and was designed to help determine abundance and distribution patterns of bird species. An important feature of the BBC Database is the habitat data associated with each census plot. The most prevalent vegetation species in different layers (canopy, shrub and ground cover) were recorded to reflect the assumption that birds respond principally to vegetative structure.
-
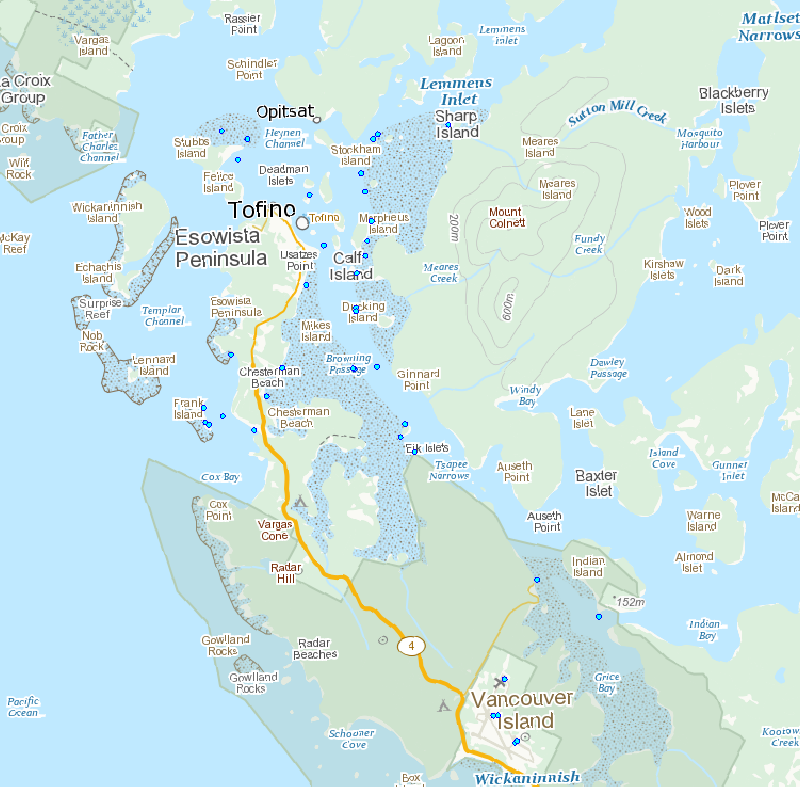
Survey points is a point feature class containing transects and observations completed in 2011.
-
Hunting districts as presented in the Compendium of Migratory Bird Hunting Regulations: Quebec https://www.canada.ca/fr/environnement-changement-climatique/services/chasse-oiseaux-migrateurs-gibier/reglementation-resumes-provinciaux-territoriaux/quebec.html These boundaries are presented for information purposes only and have no legal value.
-

Sidney Island Shorebird Surveys transects area feature.
-

Survey transects is a line feature class containing transects completed in 2011.
-

The atlas provides printable maps, Web Services and downloadable data files representing seabirds at-sea densities in eastern Canada. The information provided on the open data web site can be used to identify areas where seabirds at sea are found in eastern Canada. However, low survey effort or high variation in some areas introduces uncertainty in the density estimates provided. The data and maps found on the open data web site should therefore be interpreted with an understanding of this uncertainty. Data were collected using ships of opportunity surveys and therefore spatial and seasonal coverage varies considerably. Densities are computed using distance sampling to adjust for variation in detection rates among observers and survey conditions. Depending on conditions, seabirds can be difficult to identify to species level. Therefore, densities at higher taxonomic levels are provided. more details in the document: Atlas_SeabirdsAtSea-OiseauxMarinsEnMer.pdf. By clicking on "View on Map" you will visualize a example of the density measured for all species combined from April to July - 2006-2020. ESRI REST or WMS map services can be added to your web maps or opened directly in your desktop mapping applications. These are alternatives to downloading and provide densities for all taxonomical groups and species as well as survey effort.
-
Great Slave Lake in the Northwest Territories is one of the most important areas for inland breeding gulls and terns (larids) in northern Canada. Numerous rocky islands on the North Arm provide breeding habitat for a number of colonially-nesting larid species. Great Slave Lake is the only known breeding site for Caspian Terns in the Northwest Territories and the North Arm is the northernmost known breeding range for the species in North America. Given its importance to a variety of migrating, nesting and staging birds, various portions of the area have been recognized as; a Key Migratory Bird Terrestrial Habitat site, an Important Bird Area, and an International Biological Program site. This dataset contains results from surveys of active larid breeding colonies from between 1986 and 2010 on the portion of the North Arm west of Yellowknife. Most data were collected through ground surveys, with travel by boat, between mid June to early July. Information recorded at each colony included species, numbers of nests, clutch size, presence of chicks, and habitat characteristics (vegetation cover). The majority of larid colonies were located on islands along the northeastern shoreline. The southwest shoreline saw limited use by nesting larids due to the reduced number and different characteristics of the islands in that area. The most regularly occurring species were Herring Gull, Mew Gull, Ring-billed Gull, California Gull, Common Tern, Arctic Tern, and Caspian Tern. Results of these surveys have been published in the report “Gull and Tern Breeding Colonies on the North Arm of Great Slave Lake, Northwest Territories: 1986-2010 (Woodard, Fournier, and Robertson, 2013). Woodard, P.F., M.A. Fournier, and M.O. Wiebe Robertson. 2013. Gull and Tern Breeding Colonies on the North Arm of Great Slave Lake, Northwest Territories: 1986-2010. Technical Report Series No. 526, Canadian Wildlife Service, Yellowknife, NT. More details are available in the metadata document for download. CWS-North DatasetID: 071_0