 Arctic SDI catalogue
Databases
Type of resources
Available actions
Topics
Keywords
Contact for the resource
Provided by
Formats
Representation types
Update frequencies
status
-
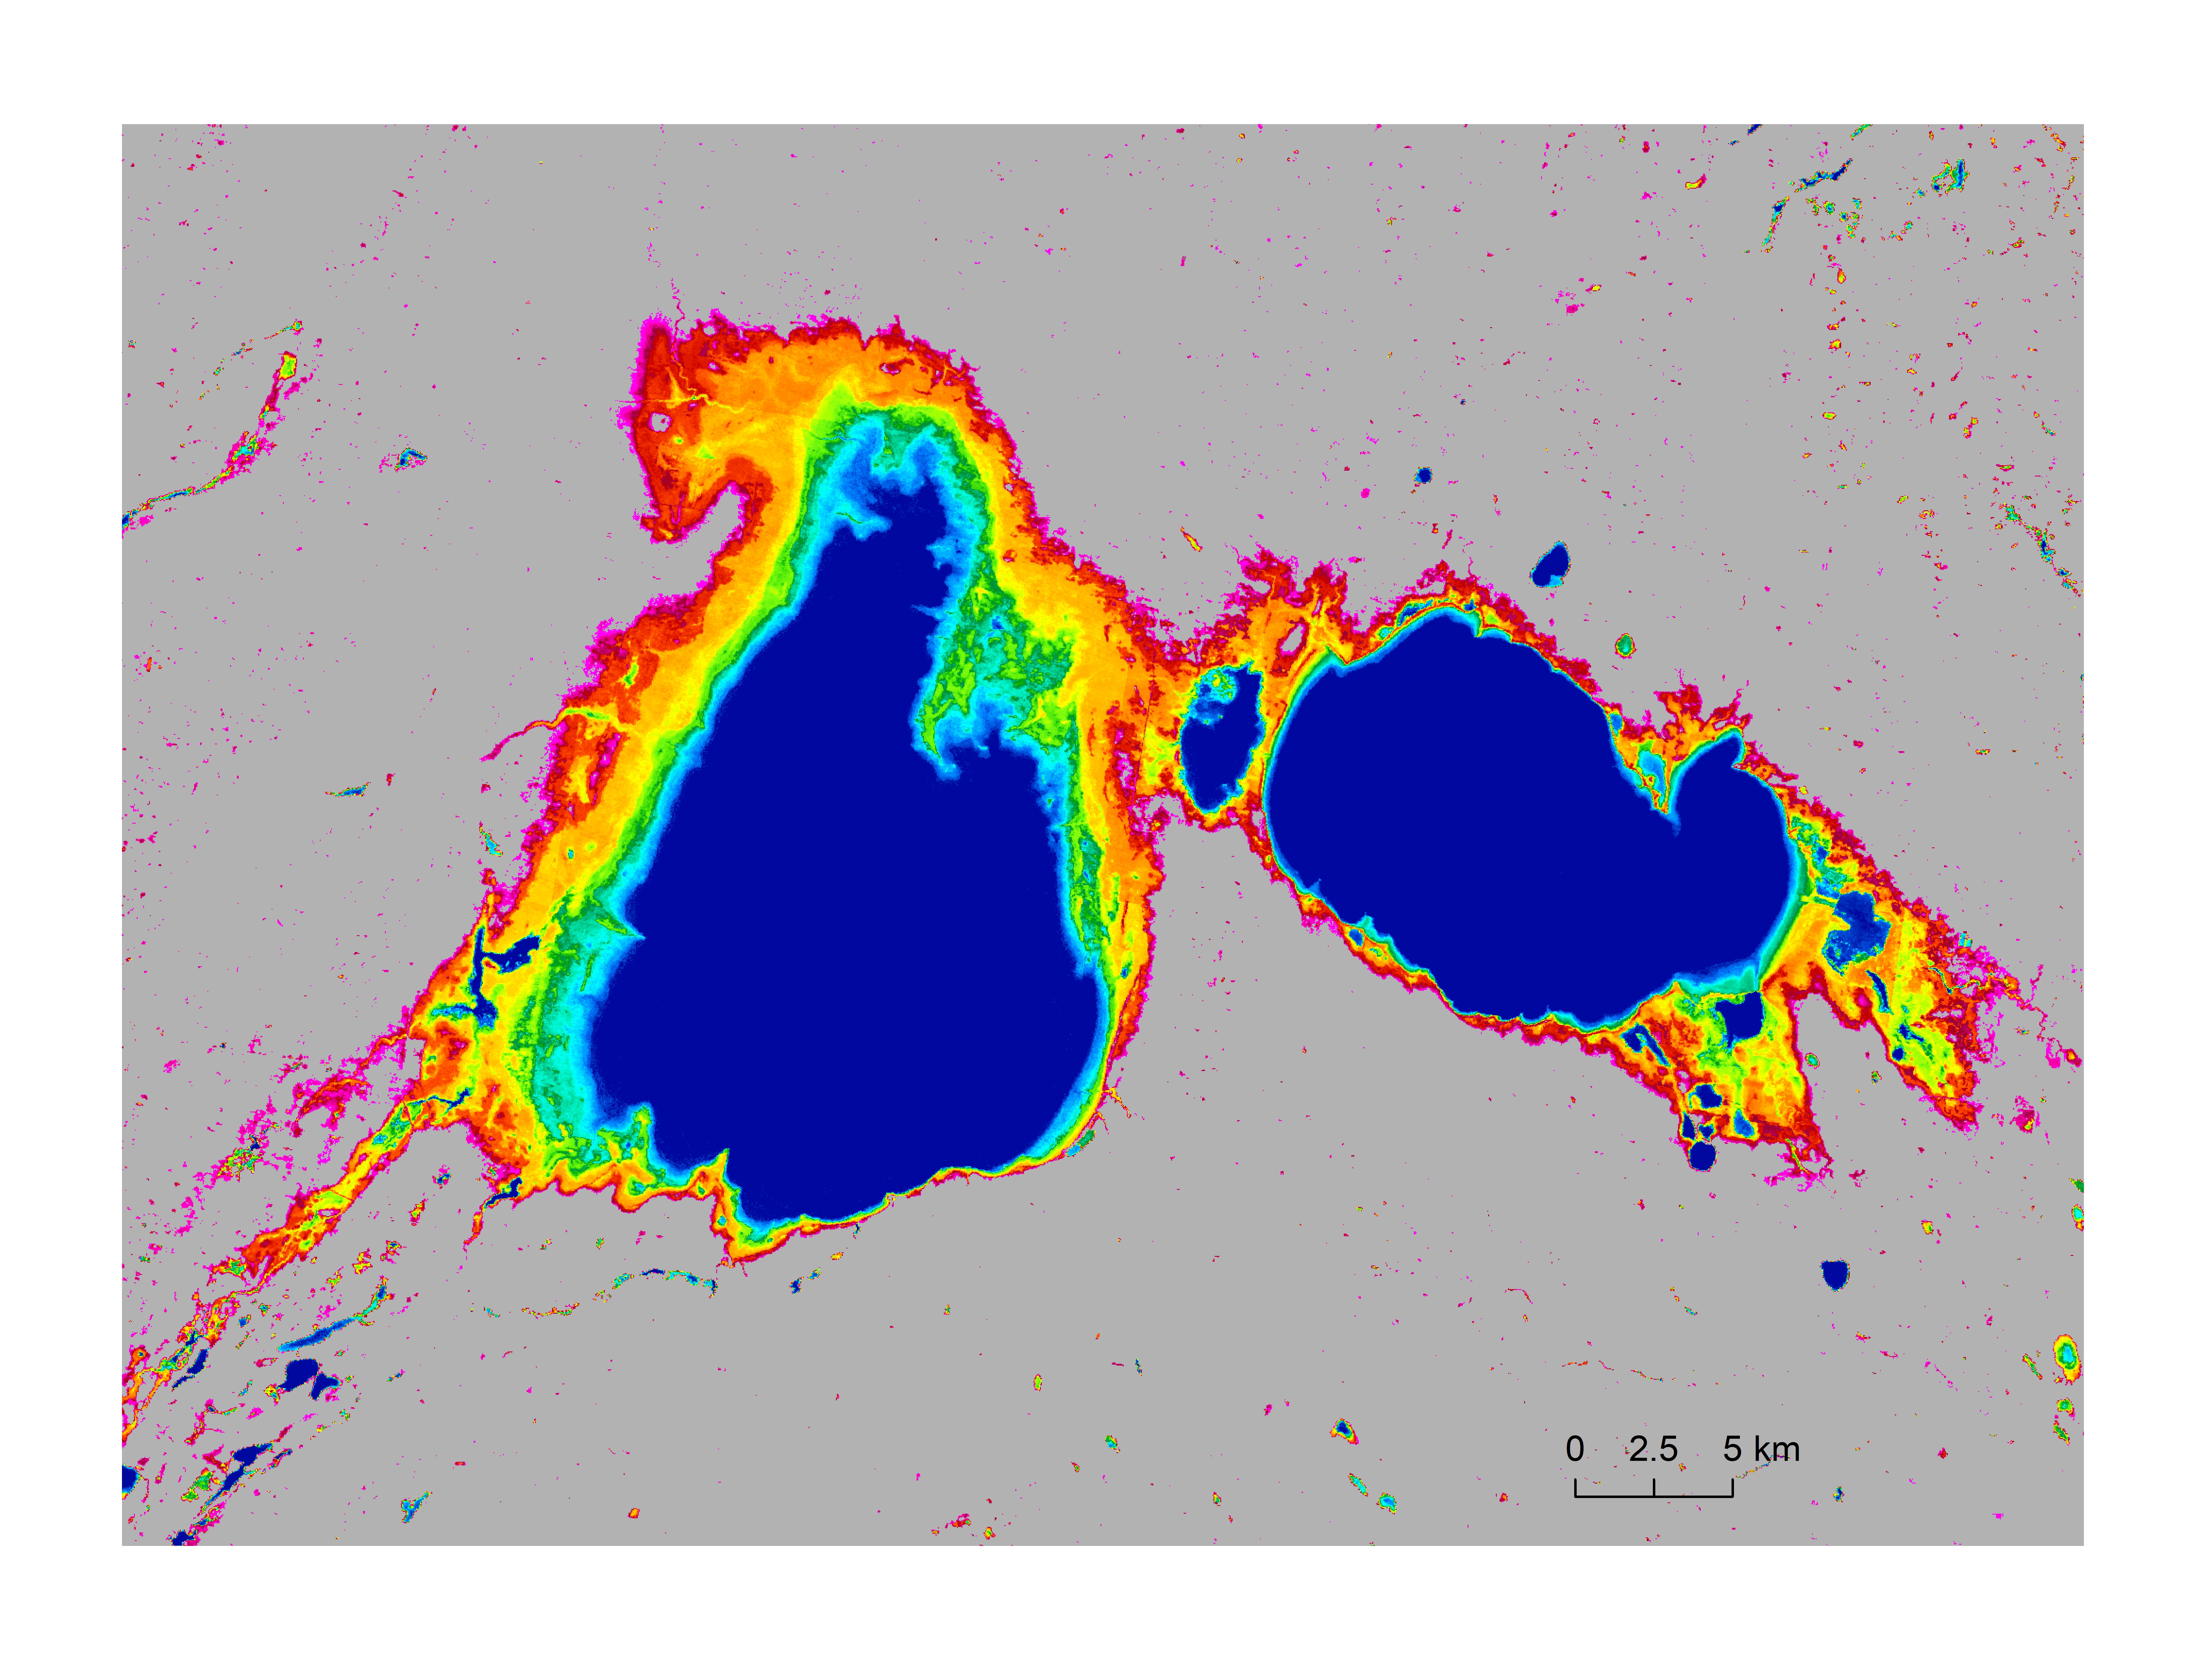
Data represents surface water occurrence frequency (percentage), which describes the frequency for each grid appeared as water in the 30 years time period of 1991 to 2020. The data covers Canada’s entire landmass including all transboundary watersheds, and is at 30-meter spatial resolution. The surface water occurrence frequency is derived using the surface water model of Wang et al. (2023) from all-available monthly water data observed by the Landsat satellites (Pekel et al., 2016). Here, permanent waters are represented by 100%, and permanent land surfaces by 0%, of water occurrence for a 30-meter by 30-meter grid. References: Pekel, J.-F., A. Cottam, N. Gorelick, A.S. Belward, 2016, High-resolution mapping of global surface water and its long-term changes. Nature, 540, 418-422. Wang, S., J. Li, and H. A. J. Russell, 2023, Methods for Estimating Surface Water Storage Changes and Their Evaluations. Journal of Hydrometeorology, DOI: https://doi.org/10.1175/JHM-D-22-0098.1.
-

The datasets contain land surface evapotranspiration (ET, in mm of H2O) for Canada's landmass at a spatial resolution of 5-km and temporal intervals of a month and a year over a 24-year period of 2000-2023. The ET was produced by the Land Surface Model EALCO (Ecological Assimilation of Land and Climate Observations) developed at Natural Resources Canada. The EALCO model was run at a 30-minute time step. The monthly (or annual) ET in the datasets is the sum of the 30-minute ET values in a month (or a year). Dew and frost formations simulated by EALCO are included in the ET as negative values, so the ET represents the net water flux between land surface and the atmosphere. Details of the datasets and the EALCO ET modelling algorithms can be found in Wang (2007, Simulation of Evapotranspiration and Its Response to Plant Water and CO2 Transfer Dynamics. J. Hydrometeorology, 9, 426-443, doi: 10.1175/2007JHM918.1) and Wang et al. (2013, Spatial and seasonal variations in evapotranspiration over Canada’s landmass. Hydrol. Earth Syst. Sci., 17, 3561–3575, doi:10.5194/hess-17-3561-2013).
-

The datasets contain water surface evaporation (PET, in mm of H2O) over Canada's landmass at a spatial resolution of 10-km and temporal intervals of a month and a year over a 24-year period of 2000-2023. The PET was produced by the Land Surface Model EALCO (Ecological Assimilation of Land and Climate Observations) developed at Natural Resources Canada. The PET algorithm in EALCO integrates the dynamic surface evolutions of liquid water, ice, and snow-on-ice for a waterbody into the Penman Equation. The PET was simulated at a daily time step. The monthly (or annual) PET in the datasets is the sum of the daily PET values in a month (or a year). Dew and frost formations simulated by EALCO are included in the PET as negative values, so the PET represents the net water flux between water surface and the atmosphere. Details of the dataset and the EALCO PET modelling algorithms can be found in Li, Wang, and Li (2020, Spatial variations and long‑term trends of potential evaporation in Canada. Scientific Reports, 10: 22089, doi.org/10.1038/s41598-020-78994-9).