 Arctic SDI catalogue
Meteorology
Type of resources
Available actions
Topics
Keywords
Contact for the resource
Provided by
Years
Formats
Representation types
Update frequencies
status
Service types
-
Environment Canada forecasts and analysis layers. Theses web services are available for demo/prototype/pilot purposes only. This is not an operational server.
-
Meteorological Service of Environment Canada forecasts, analysis and observations layers. Theses web services are available for demo/prototype/pilot purposes only. This is not an operational 24/7 service.
-

This table contains quality-controlled weather station data from various sources across Canada since 2006.
-
Numerical Weather Prediction Research forecasts, analysis and observations layers.
-

Cool Wave Days are the number of days in the forecast period with a minimum temperature below the cardinal minimum temperature, the lowest temperature at which crop growth will begin (dcw_cool). This temperature is 5°C for cool season crops. Week 1 and week 2 forecasted index is available daily from April 1 to October 31. Week 3 and week 4 forecasted index is available weekly (Thursday) from April 1 to October 31. Cool season crops require a relatively low temperature condition. Typical examples include wheat, barley, canola, oat, rye, pea, and potato. They normally grow in late spring and summer, and mature between the end of summer and early fall in the southern agricultural areas of Canada. The optimum temperature for such crops is 25°C. Agriculture and Agri-Food Canada (AAFC) and Environment and Climate Change Canada (ECCC) have together developed a suite of extreme agrometeorological indices based on four main categories of weather factors: temperature, precipitation, heat, and wind. The extreme weather indices are intended as short-term prediction tools and generated using ECCC’s medium range forecasts to create a weekly index product on a daily and weekly basis.
-

The number of days in the forecast period with a minimum temperature below the frost temperature. It is -15°C for herbaceous crops over the dormant period (ifd_herb_dorm). Week 1 and week 2 forecasted index is available daily from November 1 to March 31. Week 3 and week 4 forecasted index is available weekly (Thursday) from November 1 to March 31. Over-wintering crops are biennial and perennial field crops such as herbaceous plants (strawberry, alfalfa, timothy, and many other forage crops) and woody fruit trees (apple, pear, peach, cherry, plum, apricot, chestnut, pecan, grape, etc.). These crops normally grow and develop in the growing season and become dormant in the non-growing season. However, extreme weather and climate events such as cold waves in the growing season and ice freezing events during the winter are a major constraint for their success of production and survival in Canada. The winter survival of these plants depends largely on agrometeorological conditions from late autumn to early spring, especially ice-freezing damage during the winter season. Agriculture and Agri-Food Canada (AAFC) and Environment and Climate Change Canada (ECCC) have together developed a suite of extreme agrometeorological indices based on four main categories of weather factors: temperature, precipitation, heat, and wind. The extreme weather indices are intended as short-term prediction tools and generated using ECCC’s medium range forecasts to create a weekly index product on a daily and weekly basis.
-
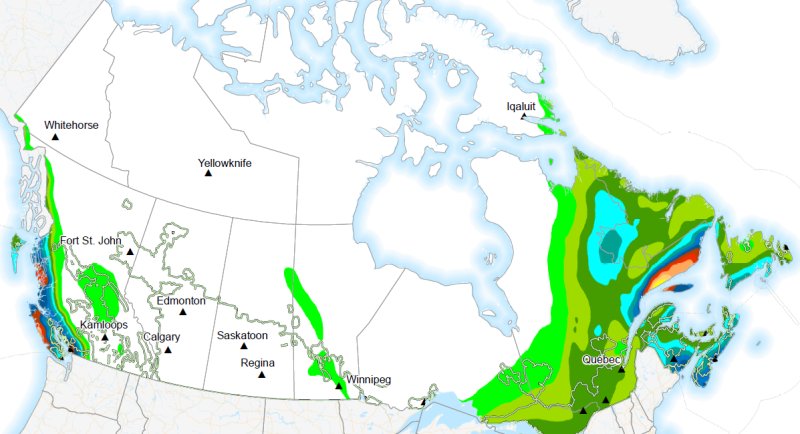
The greatest 10-day precipitation total expected over the next 2 weeks (p10d). Week 1 and week 2 forecasted index is available daily from September 1 to August 31. Week 3 and week 4 forecasted index is available weekly (Thursday) from September 1 to August 31. Units: cm/10 days Precipitation (moisture availability) establishes the economic yield potential and product quality of field crops. Both dry and wet precipitation extremes have the ability to inhibit proper crop growth. The greatest daily precipitation index covers the risk of excessive precipitation in the short term, while the other indices pertain to longer term moisture availability. Agriculture and Agri-Food Canada (AAFC) and Environment and Climate Change Canada (ECCC) have together developed a suite of extreme agrometeorological indices based on four main categories of weather factors: temperature, precipitation, heat, and wind. The extreme weather indices are intended as short-term prediction tools and generated using ECCC’s medium range forecasts to create a weekly index product on a daily and weekly basis.
-
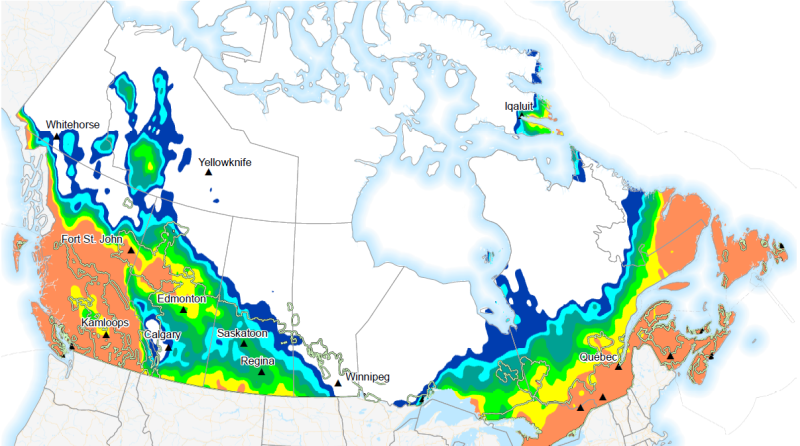
Probability of the daily precipitation above 2mm over the forecast period (p1d2_prob). Week 1 and week 2 forecasted probability is available daily from September 1 to August 31. Week 3 and week 4 forecasted probability is available weekly (Thursday) from September 1 to August 31. Units: mm Precipitation (moisture availability) establishes the economic yield potential and product quality of field crops. Both dry and wet precipitation extremes have the ability to inhibit proper crop growth. The greatest daily precipitation index covers the risk of excessive precipitation in the short term, while the other indices pertain to longer term moisture availability. Agriculture and Agri-Food Canada (AAFC) and Environment and Climate Change Canada (ECCC) have together developed a suite of extreme agrometeorological indices based on four main categories of weather factors: temperature, precipitation, heat, and wind. The extreme weather indices are intended as short-term prediction tools and generated using ECCC’s medium range forecasts to create a weekly index product on a daily and weekly basis.
-
The number of days in the forecast period with a minimum temperature below the frost temperature. It is -15°C for herbaceous crops over the dormant period (ifd_wood_nogrow). Week 1 and week 2 forecasted index is available daily from November 1 to March 31. Week 3 and week 4 forecasted index is available weekly (Thursday) from November 1 to March 31. Over-wintering crops are biennial and perennial field crops such as herbaceous plants (strawberry, alfalfa, timothy, and many other forage crops) and woody fruit trees (apple, pear, peach, cherry, plum, apricot, chestnut, pecan, grape, etc.). These crops normally grow and develop in the growing season and become dormant in the non-growing season. However, extreme weather and climate events such as cold waves in the growing season and ice freezing events during the winter are a major constraint for their success of production and survival in Canada. The winter survival of these plants depends largely on agrometeorological conditions from late autumn to early spring, especially ice-freezing damage during the winter season. Agriculture and Agri-Food Canada (AAFC) and Environment and Climate Change Canada (ECCC) have together developed a suite of extreme agrometeorological indices based on four main categories of weather factors: temperature, precipitation, heat, and wind. The extreme weather indices are intended as short-term prediction tools and generated using ECCC’s medium range forecasts to create a weekly index product on a daily and weekly basis.
-

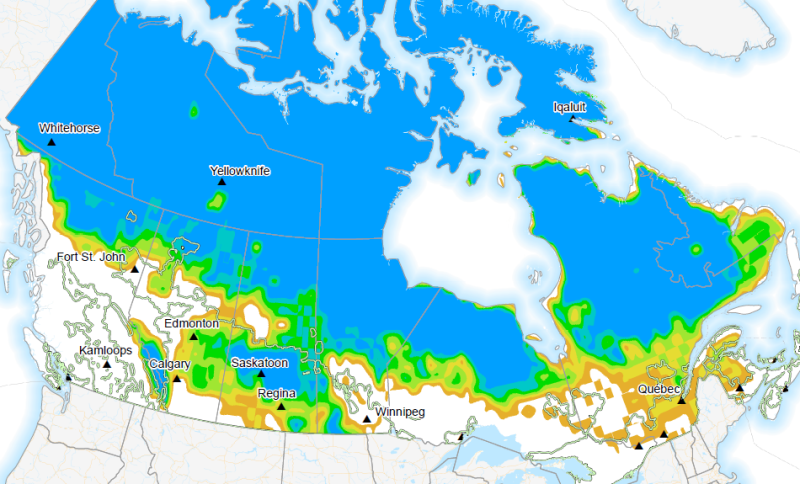
Probability of daily precipitation above 10mm over the forecast period (p1d10_prob). Week 1 and week 2 forecasted probability is available daily from September 1 to August 31. Week 3 and week 4 forecasted probability is available weekly (Thursday) from September 1 to August 31. Units: mm Precipitation (moisture availability) establishes the economic yield potential and product quality of field crops. Both dry and wet precipitation extremes have the ability to inhibit proper crop growth. The greatest daily precipitation index covers the risk of excessive precipitation in the short term, while the other indices pertain to longer term moisture availability. Agriculture and Agri-Food Canada (AAFC) and Environment and Climate Change Canada (ECCC) have together developed a suite of extreme agrometeorological indices based on four main categories of weather factors: temperature, precipitation, heat, and wind. The extreme weather indices are intended as short-term prediction tools and generated using ECCC’s medium range forecasts to create a weekly index product on a daily and weekly basis.