 Arctic SDI catalogue
Lakes
Type of resources
Available actions
Topics
Keywords
Contact for the resource
Provided by
Formats
Representation types
Update frequencies
status
Scale
-

The datasets contain water surface evaporation (PET, in mm of H2O) over Canada's landmass at a spatial resolution of 10-km and temporal intervals of a month and a year over a 24-year period of 2000-2023. The PET was produced by the Land Surface Model EALCO (Ecological Assimilation of Land and Climate Observations) developed at Natural Resources Canada. The PET algorithm in EALCO integrates the dynamic surface evolutions of liquid water, ice, and snow-on-ice for a waterbody into the Penman Equation. The PET was simulated at a daily time step. The monthly (or annual) PET in the datasets is the sum of the daily PET values in a month (or a year). Dew and frost formations simulated by EALCO are included in the PET as negative values, so the PET represents the net water flux between water surface and the atmosphere. Details of the dataset and the EALCO PET modelling algorithms can be found in Li, Wang, and Li (2020, Spatial variations and long‑term trends of potential evaporation in Canada. Scientific Reports, 10: 22089, doi.org/10.1038/s41598-020-78994-9).
-

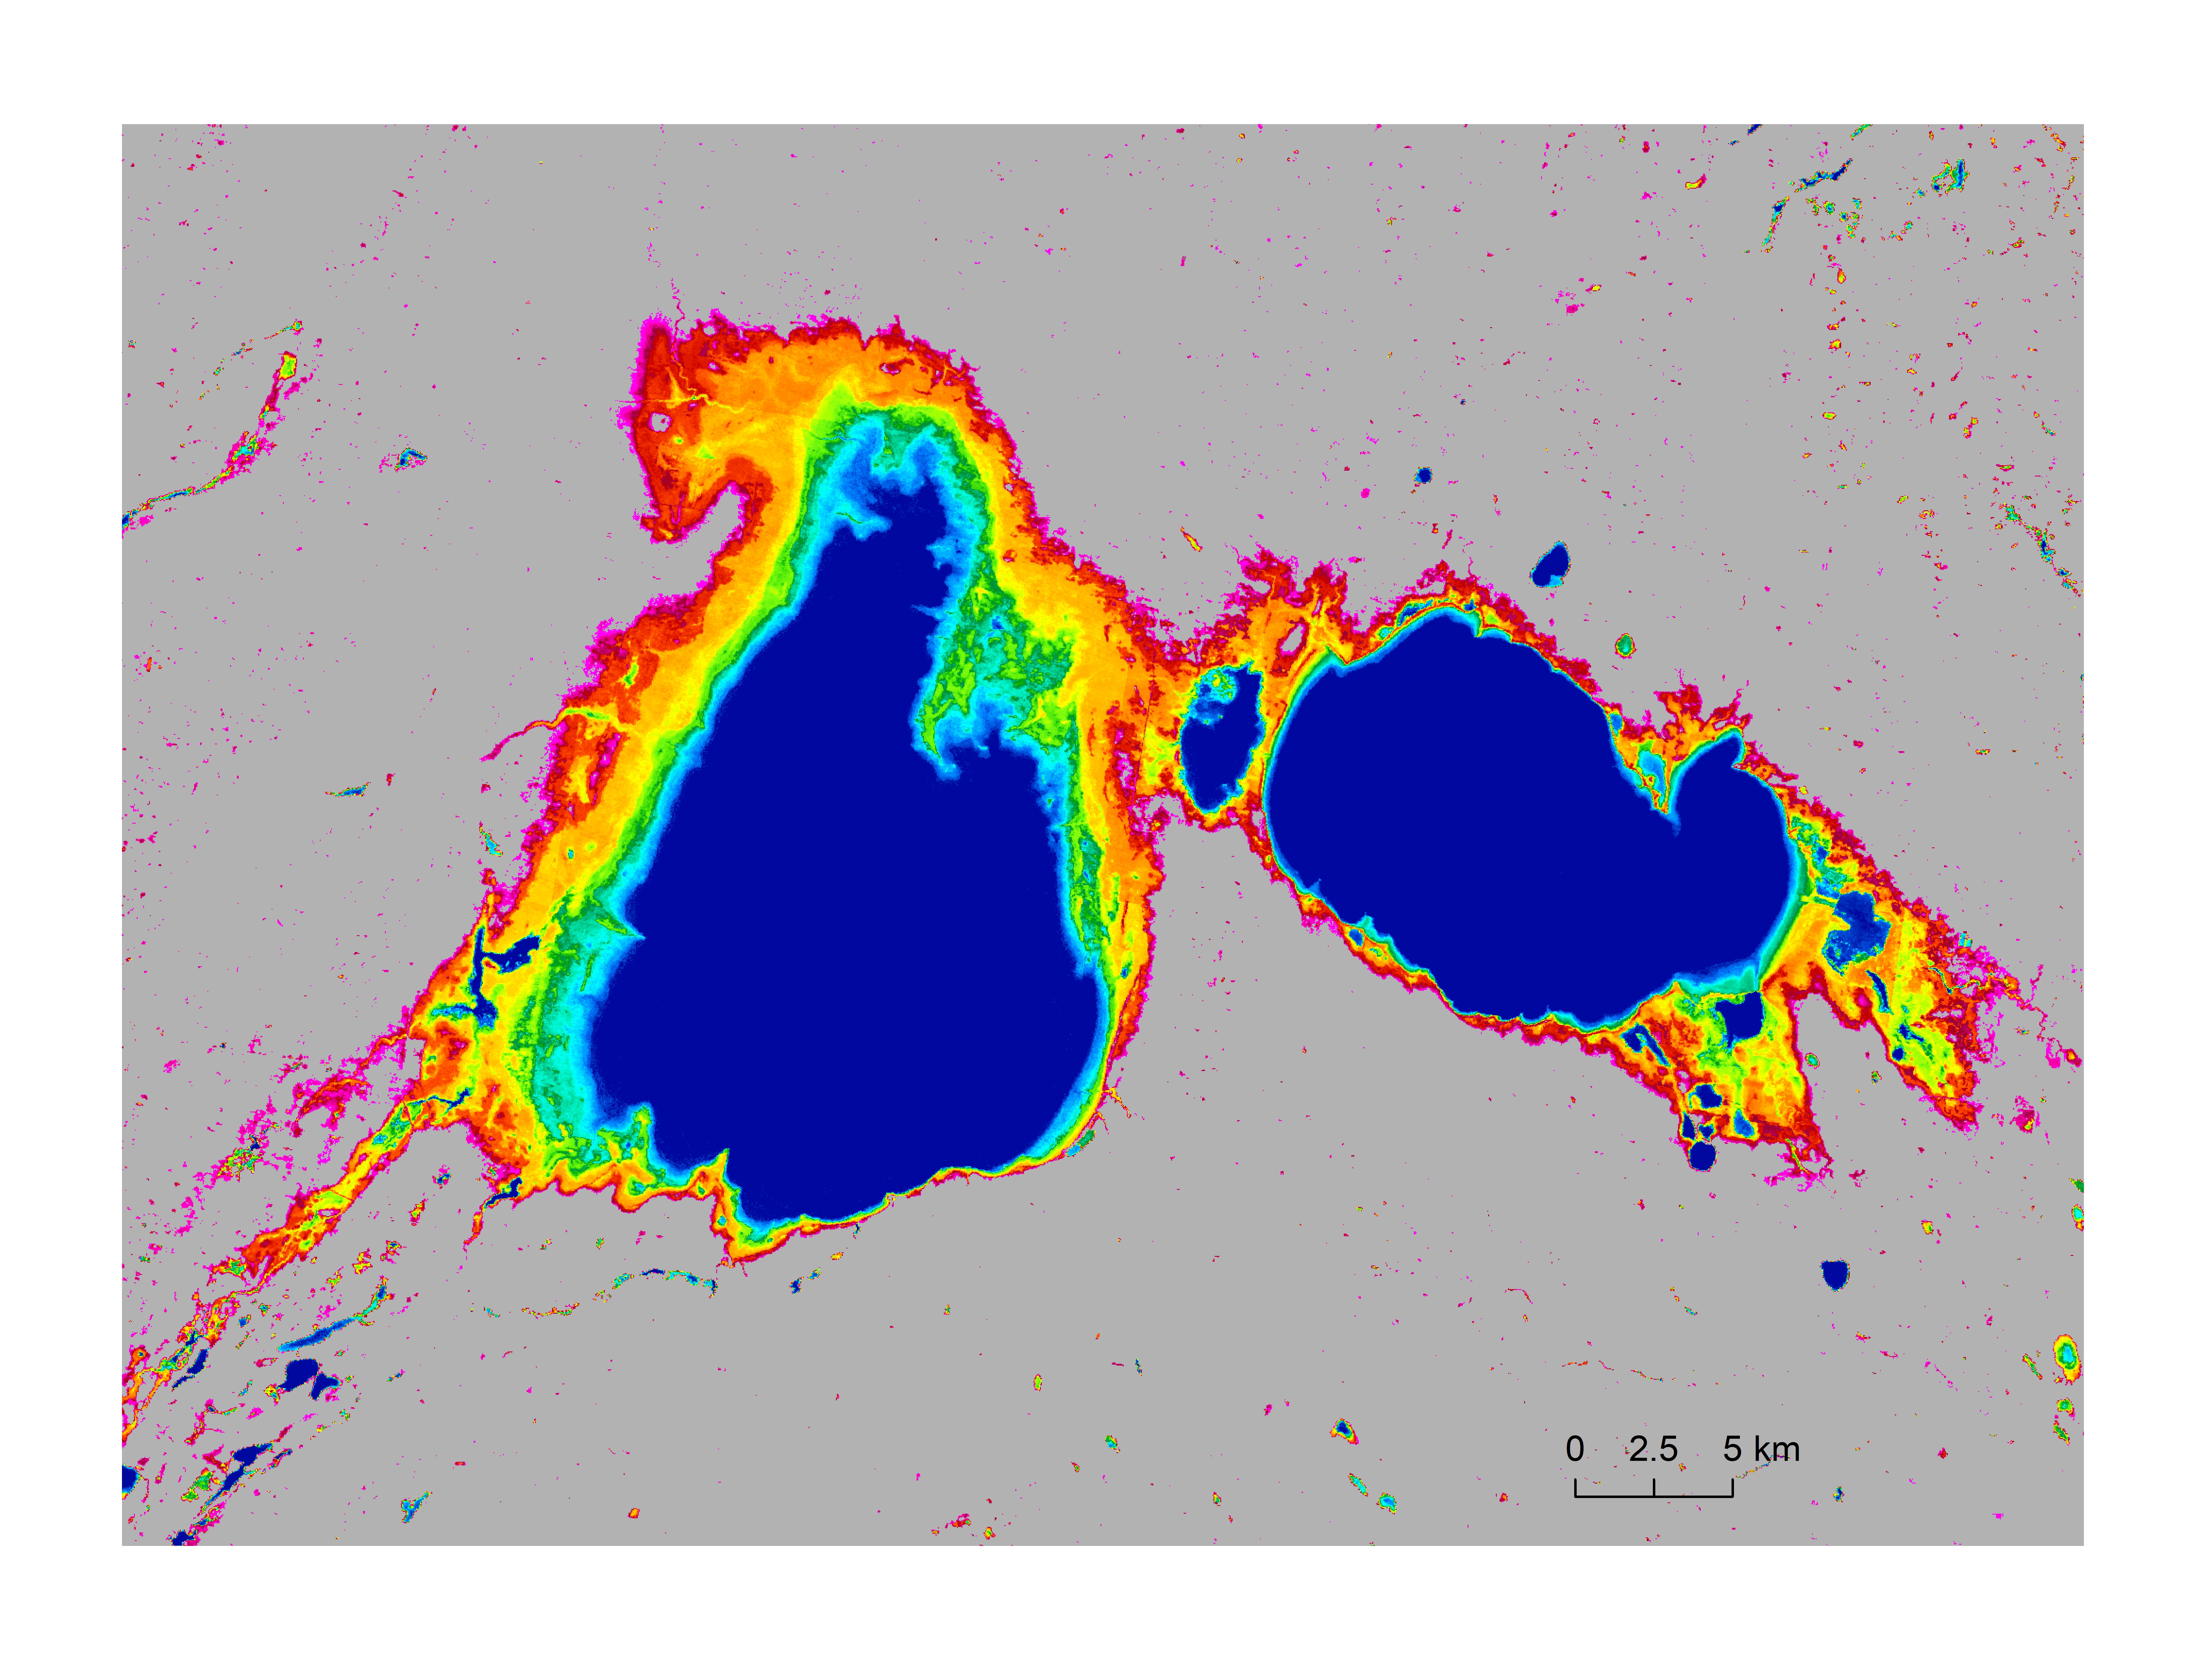
This dataset comprises a map of inland water bodies in Canada and neighboring regions, as described by Ghayourmanesh et al. (2024). The data are mapped using the Lambert Conformal Conic (LCC) geographic projection with a spatial resolution of 250 meters. The LCC projection is frequently used as a standard projection at the Canada Centre for Remote Sensing (CCRS) (Trishchenko et al., 2016, Trishchenko, 2019). Each pixel value represents a code describing either the probability of inland water presence or land/ocean(sea) mask
-

This dataset supports the assessment of plankton community structure and water quality within Toronto Area of Concern (AOC). The data was collected to evaluate the Beneficial Use Impairment (BUI) 13 - Degradation of Phytoplankton and Zooplankton Populations, and to provide georeferenced habitat information relevant to BUI 14 - Loss of Fish and Wildlife Habitat. The dataset provides a complete suite of water quality, microbial, phytoplankton and zooplankton observations collected from multiple georeferenced stations throughout the Toronto Harbor. Each datapoint includes latitude and longitude, sampling date, year and season, along with physiochemical measurements such as temperature, dissolved oxygen, total phosphorus, total nitrogen, nitrate + nitrite, chlorophyll-a and turbidity. Biological data includes phytoplankton, zooplankton and rotifer abundance and biomass across major taxonomic groups, as well as size structured zooplankton data distinguishing small and large taxa. The dataset also includes microbial community metrics and rate-based parameters such as bacterial growth rates, primary productivity and bacterial production. Sampling was conducted across multiple ecotypes identified by “Area” in the dataset (Inner Harbor, Islands, Habitat Cells and Embayments). The data structure allows for comparisons among sites, seasons, ecotypes and provides the basis for statistical analysis of plankton community composition, trophic relationships and ecological patterns within the AOC of Toronto Harbor. Results indicate water quality, zooplankton abundance and biomass differed across habitat ecotypes, with Inner Harbor exhibiting very low biomass similar to the open waters of Lake Ontario and a higher proportion of small taxa like rotifers, in spite of elevated nutrients. This pattern suggests environmental stress from runoff and contamination from the surrounding urban area. Zooplankton prey reductions are likely due to multiple urban environmental impacts including runoff and contaminants. Ecotype impacted zooplankton productivity but not primary productivity, indicating that protected systems (Island channels, Habitat Cells and Embayments) can offer diverse physical habitats and forage for fishes. Though primary productivity rates were reduced in most habitats, productivity was shunted into bacterial growth which were highly elevated throughout the entire AOC.
-
Data represents surface water occurrence frequency (percentage), which describes the frequency for each grid appeared as water in the 30 years time period of 1991 to 2020. The data covers Canada’s entire landmass including all transboundary watersheds, and is at 30-meter spatial resolution. The surface water occurrence frequency is derived using the surface water model of Wang et al. (2023) from all-available monthly water data observed by the Landsat satellites (Pekel et al., 2016). Here, permanent waters are represented by 100%, and permanent land surfaces by 0%, of water occurrence for a 30-meter by 30-meter grid. References: Pekel, J.-F., A. Cottam, N. Gorelick, A.S. Belward, 2016, High-resolution mapping of global surface water and its long-term changes. Nature, 540, 418-422. Wang, S., J. Li, and H. A. J. Russell, 2023, Methods for Estimating Surface Water Storage Changes and Their Evaluations. Journal of Hydrometeorology, DOI: https://doi.org/10.1175/JHM-D-22-0098.1.
-

WCPS-coupled forecast is the component in the Water Cycle Prediction System (WCPS) that provides the coupled atmosphere-ocean-sea ice forecasts at a 1km resolution (0.008 x 0.008 degree) over the Great Lakes, St. Lawrence River and the Gulf of St. Lawrence. It launches 4 times a day at 00, 06, 12, and 18 UTC and produces 84 hours forecast, based on the atmospheric model GEM, coupled with the ocean-ice model NEMO-CICE. The products from WCPS-coupled forecasts are (1) GEM : surface air temperatures, surface wind velocities, and surface runoff (2) NEMO-CICE : variety of lake/ocean sea ice variables, for example, lake levels and temperatures. They are designed to help forecasters issuing bulletins and warnings in ice-infestested waters for navigation, water level alert, emergency response, Search and Rescue, and CIS Sea Ice forecast.
-

The study involved sampling during a winter subsistence fishery at Brock Lake in November 2003, and a physical, chemical and biological assessment of the lake in July 2004 and July 2005. Data including physical, chemical and biological variables were published as Roux, M.-J., Harwood, L. A., Illasiak, J., Babaluk, J.A., and de Graff, N. 2011. Fishery resources and habitats in a headwater lake of the Brock River, NT, 2003-2005. Can. Manuscr. Rep. Fish. Aquat. Sci. 2932: viii + 61 p.
-
Acid-Sensitive Lakes Nine hundred and thirty-three lakes located in Saskatchewan, Alberta and the Northwest Territories were sampled to establish current acidification status. Of the 933 lakes, 244 (or 26%) are considered acid sensitive, almost always because of naturally low calcium and magnesium (or "base cation") concentrations. The most acid-sensitive lakes (i.e., those with extremely low base cation concentrations) are located on the Canadian Shield in both Alberta and Saskatchewan and east of the oils sands development area. Fifty-one of the 244 acid-sensitive lakes were sampled twice annually (spring and fall) to identify chemical changes through trend analyses. Results revealed that 55% of these lakes had concentrations of some metals in excess of Canadian Council of Ministers of the Environment guidelines. Of the 291 samples taken in the 51 lakes, iron concentrations were greater than guidelines in 36% (105 samples), aluminum in 33% (97 samples), lead in 0.3% (1 sample) and copper in 0.3% (1 sample). The metals in these lakes occur naturally and are expected to be found in a wide range of concentrations given the geology and physiography of the Canadian Shield. It remains to establish the relationship between acid sensitivity, geology and high metal concentrations.
-

To better understand patterns of temporal and spatial variation of fish assemblages in offshore waters of Lake Winnipeg (Manitoba, Canada), pelagic trawl tows were conducted at lakewide monitoring stations since 2002. Trawl samples collected during spring, summer, and fall from the south basin, channel, and north basin were used to study effects of season and geographic region within the lake on species biomass estimates.
-

This collection is a legacy product that is no longer supported. It may not meet current government standards. Toporama is a digital topographic reference product using CanVec as source data. Developed by Natural Resources Canada (NRCan), Toporama covers the entire area of Canada's landmass and provides symbolic information in a geo-referenced raster format (GeoTIFF). The delimitation, content and representation of this product are similar to those of 1:50,000 scale topographical maps. Toporama is available in the following spatial reference systems: Universal Transverse Mercator (UTM) and geographic (latitude and longitude). Toporama is a product aimed at the general public that can be used by GPS system. The datasets in this collection present the version published in 2013.