 Arctic SDI catalogue
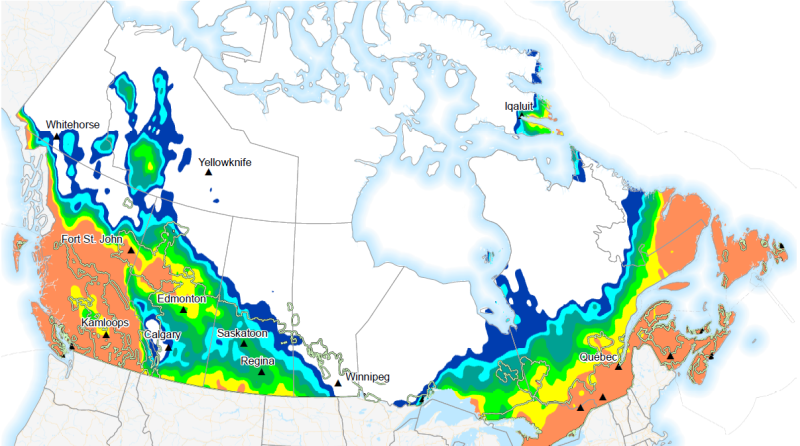
Extreme Weather Indices
Type of resources
Topics
Keywords
Contact for the resource
Provided by
Formats
Representation types
Update frequencies
status
-
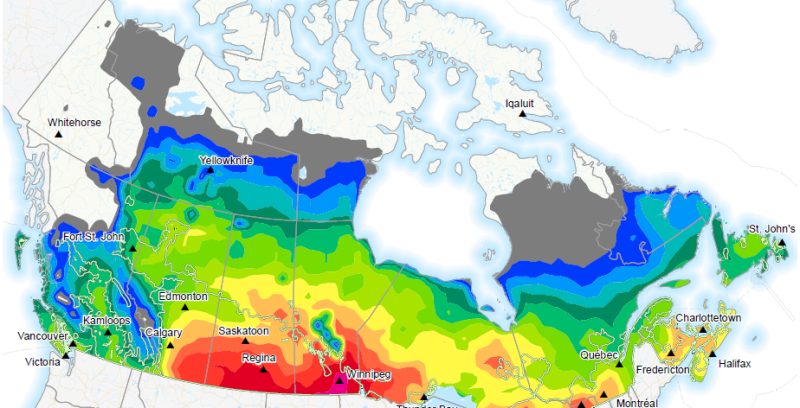
Heat Wave Days are the number of days in the forecast period with a maximum temperature above the cardinal maximum temperature, the temperature at which crop growth ceases (dhw_cool). This temperature is 30°C for cool season crops. Week 1 and week 2 forecasted index is available daily from April 1 to October 31. Week 3 and week 4 forecasted index is available weekly (Thursday) from April 1 to October 31. Cool season crops require a relatively low temperature condition. Typical examples include wheat, barley, canola, oat, rye, pea, and potato. They normally grow in late spring and summer, and mature between the end of summer and early fall in the southern agricultural areas of Canada. The optimum temperature for such crops is 25°C. Agriculture and Agri-Food Canada (AAFC) and Environment and Climate Change Canada (ECCC) have together developed a suite of extreme agrometeorological indices based on four main categories of weather factors: temperature, precipitation, heat, and wind. The extreme weather indices are intended as short-term prediction tools and generated using ECCC’s medium range forecasts to create a weekly index product on a daily and weekly basis.
-

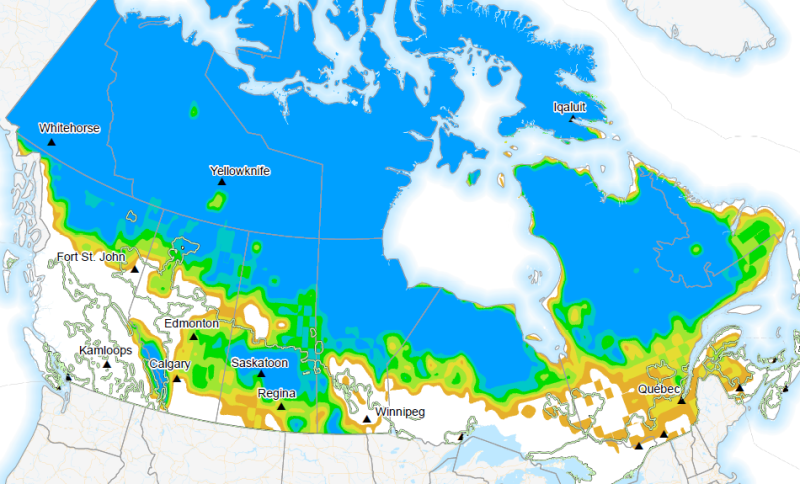
The Probability (likelihood) of cool wave days for cool season/overwintering crops occurring Cool Wave Days are the number of days in the forecast period with a minimum temperature below the cardinal minimum temperature, the lowest temperature at which crop growth will begin (dcw_cool_prob). This temperature is 5°C for cool season crops. Week 1 and week 2 forecasted probability is available daily from April 1 to October 31. Week 3 and week 4 forecasted probability is available weekly (Thursday) from April 1 to October 31. Cool season crops require a relatively low temperature condition. Typical examples include wheat, barley, canola, oat, rye, pea, and potato. They normally grow in late spring and summer, and mature between the end of summer and early fall in the southern agricultural areas of Canada. The optimum temperature for such crops is 25°C. Agriculture and Agri-Food Canada (AAFC) and Environment and Climate Change Canada (ECCC) have together developed a suite of extreme agrometeorological indices based on four main categories of weather factors: temperature, precipitation, heat, and wind. The extreme weather indices are intended as short-term prediction tools and generated using ECCC’s medium range forecasts to create a weekly index product on a daily and weekly basis.
-

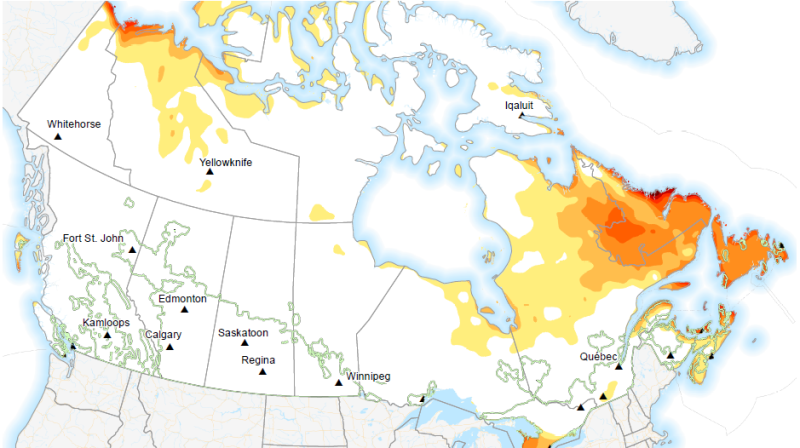
The Probability (likelihood) of frost occurring. The number of days in the forecast period with a minimum temperature below the frost temperature, the temperature at which frost damage occurs. This temperature is 0°C for warm season crops (ffd_warm_prob). Week 1 and week 2 forecasted probability is available daily from April 1 to October 31. Week 3 and week 4 forecasted probability is available weekly (Thursday) from April 1 to October 31. Warm season crops require a relatively warm temperature condition. Typical examples include bean, soybean, corn and sweet potato. They normally grow during the summer season and early fall, then ripen in late fall in southern Canada only. Other agricultural regions in Canada do not always experience sufficiently long growing seasons for these plants to achieve maturity. The optimum temperature for such crops is 30°C. Agriculture and Agri-Food Canada (AAFC) and Environment and Climate Change Canada (ECCC) have together developed a suite of extreme agrometeorological indices based on four main categories of weather factors: temperature, precipitation, heat, and wind. The extreme weather indices are intended as short-term prediction tools and generated using ECCC’s medium range forecasts to create a weekly index product on a daily and weekly basis.
-

Probability of 10-day precipitation total above 150mm (p10d_prob150). Week 1 and week 2 forecasted probability is available daily from September 1 to August 31. Week 3 and week 4 forecasted probability is available weekly (Thursday) from September 1 to August 31. Precipitation (moisture availability) establishes the economic yield potential and product quality of field crops. Both dry and wet precipitation extremes have the ability to inhibit proper crop growth. The greatest daily precipitation index covers the risk of excessive precipitation in the short term, while the other indices pertain to longer term moisture availability. Agriculture and Agri-Food Canada (AAFC) and Environment and Climate Change Canada (ECCC) have together developed a suite of extreme agrometeorological indices based on four main categories of weather factors: temperature, precipitation, heat, and wind. The extreme weather indices are intended as short-term prediction tools and generated using ECCC’s medium range forecasts to create a weekly index product on a daily and weekly basis.
-

The number of days during the forecast period with an average wind speed greater than 30 km/h and a maximum temperature above 30°C (drying). Week 1 and week 2 forecasted index is available daily from September 1 to August 31. Week 3 and week 4 forecasted index is available weekly (Thursday) from September 1 to August 31. Winds can significantly influence crop growth and yield mainly due to mechanical damage of plant vegetative and reproductive organs, an imbalance of plant-soil-atmosphere water relationships, and pest and disease distributions in agricultural fields. The maximum wind speed and the number of strong wind days over the forecast period represent short term and extended strong wind events respectively. Agriculture and Agri-Food Canada (AAFC) and Environment and Climate Change Canada (ECCC) have together developed a suite of extreme agrometeorological indices based on four main categories of weather factors: temperature, precipitation, heat, and wind. The extreme weather indices are intended as short-term prediction tools and generated using ECCC’s medium range forecasts to create a weekly index product on a daily and weekly basis.
-
The probability of maximum wind above 50km/h (mdws50_prob). Week 1 and week 2 forecasted probability is available daily from September 1 to August 31. Week 3 and week 4 forecasted probability is available weekly (Thursday) from September 1 to August 31. Winds can significantly influence crop growth and yield mainly due to mechanical damage of plant vegetative and reproductive organs, an imbalance of plant-soil-atmosphere water relationships, and pest and disease distributions in agricultural fields. The maximum wind speed and the number of strong wind days over the forecast period represent short term and extended strong wind events respectively. Agriculture and Agri-Food Canada (AAFC) and Environment and Climate Change Canada (ECCC) have together developed a suite of extreme agrometeorological indices based on four main categories of weather factors: temperature, precipitation, heat, and wind. The extreme weather indices are intended as short-term prediction tools and generated using ECCC’s medium range forecasts to create a weekly index product on a daily and weekly basis.
-
The Probability (likelihood) of heat wave days for warm season crops occurring. Heat wave days: The number of days in the forecast period with a maximum temperature above the cardinal maximum temperature, the temperature at which crop growth ceases. This temperature is 35°C for warm season crops (dhw_warm_prob). Week 1 and week 2 forecasted probability is available daily from April 1 to October 31. Week 3 and week 4 forecasted probability is available weekly (Thursday) from April 1 to October 31. Warm season crops require a relatively warm temperature condition. Typical examples include bean, soybean, corn and sweet potato. They normally grow during the summer season and early fall, then ripen in late fall in southern Canada only. Other agricultural regions in Canada do not always experience sufficiently long growing seasons for these plants to achieve maturity. The optimum temperature for such crops is 30°C. Agriculture and Agri-Food Canada (AAFC) and Environment and Climate Change Canada (ECCC) have together developed a suite of extreme agrometeorological indices based on four main categories of weather factors: temperature, precipitation, heat, and wind. The extreme weather indices are intended as short-term prediction tools and generated using ECCC’s medium range forecasts to create a weekly index product on a daily and weekly basis.
-
An accumulated value of heat degrees that the average temperature is above a specified threshold, 10°C for warm season crops. This condition must be maintained for at least 5 consecutive days in order for EGDD to be accumulated (egdd_warm). Week 1 and week 2 forecasted index is available daily from April 1 to October 31. Week 3 and week 4 forecasted index is available weekly (Thursday) from April 1 to October 31. Cumulative heat-energy satisfies the essential requirement of field crop growth and development towards a high yield and good quality of agricultural crop products. Agriculture and Agri-Food Canada (AAFC) and Environment and Climate Change Canada (ECCC) have together developed a suite of extreme agrometeorological indices based on four main categories of weather factors: temperature, precipitation, heat, and wind. The extreme weather indices are intended as short-term prediction tools and generated using ECCC’s medium range forecasts to create a weekly index product on a daily and weekly basis.
-
Probability of total precipitation above 100mm over the forecast period (pweek100_prob) Week 1 and week 2 forecasted probability is available daily from September 1 to August 31. Week 3 and week 4 forecasted probability is available weekly (Thursday) from September 1 to August 31. Precipitation (moisture availability) establishes the economic yield potential and product quality of field crops. Both dry and wet precipitation extremes have the ability to inhibit proper crop growth. The greatest daily precipitation index covers the risk of excessive precipitation in the short term, while the other indices pertain to longer term moisture availability. Agriculture and Agri-Food Canada (AAFC) and Environment and Climate Change Canada (ECCC) have together developed a suite of extreme agrometeorological indices based on four main categories of weather factors: temperature, precipitation, heat, and wind. The extreme weather indices are intended as short-term prediction tools and generated using ECCC’s medium range forecasts to create a weekly index product on a daily and weekly basis.
-

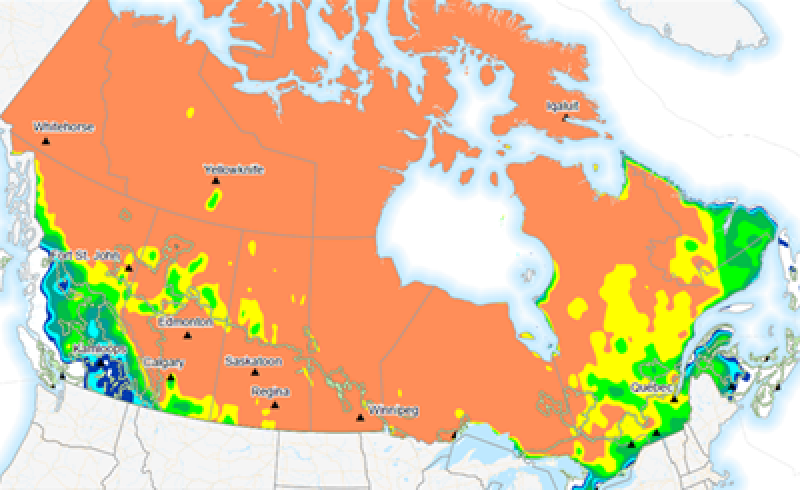
The probability (likelihood) of ice freeze days, the number of days in the forecast period with a minimum temperature below the frost temperature, -30°C for woody crops over the dormant period (ifd_wood_dorm_prob). Week 1 and week 2 forecasted probability is available daily from November 1 to March 31. Week 3 and week 4 forecasted probability is available weekly (Thursday) from November 1 to March 31. Over-wintering crops are biennial and perennial field crops such as herbaceous plants (strawberry, alfalfa, timothy, and many other forage crops) and woody fruit trees (apple, pear, peach, cherry, plum, apricot, chestnut, pecan, grape, etc.). These crops normally grow and develop in the growing season and become dormant in the non-growing season. However, extreme weather and climate events such as cold waves in the growing season and ice freezing events during the winter are a major constraint for their success of production and survival in Canada. The winter survival of these plants depends largely on agrometeorological conditions from late autumn to early spring, especially ice-freezing damage during the winter season. The optimum temperature for such crops is 25°C. Agriculture and Agri-Food Canada (AAFC) and Environment and Climate Change Canada (ECCC) have together developed a suite of extreme agrometeorological indices based on four main categories of weather factors: temperature, precipitation, heat, and wind. The extreme weather indices are intended as short-term prediction tools and generated using ECCC’s medium range forecasts to create a weekly index product on a daily basis.