 Arctic SDI catalogue
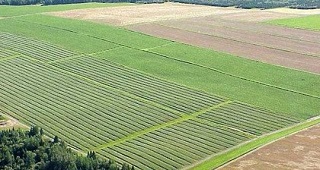
Agriculture
Type of resources
Topics
Keywords
Contact for the resource
Provided by
Years
Formats
Representation types
Update frequencies
status
Service types
-

The “Municipal Solid Waste Biomass Inventory” dataset is a stand-alone product that provides information on the calculated amount of Municipal Solid Waste within each BIMAT grid cell that includes a population centre. Data was provided by National Research Council Canada, with estimates based on census data collected in 2016. This dataset was calculated using an area-weighted analysis between population centres across Canada, Municipal Solid Waste data and the Biomass Report Framework fishnet. It includes information for total residential municipal solid waste, total organic waste (food and yard) and total paper waste.
-

The “Biomass Inventory Cartographic Layer” dataset provides the information that is used with the Biomass Report Framework to generate a visual representation of the availability of agricultural and forestry biomass and municipal solid waste in Canada. In addition to yield and production information for biomass produced by the agricultural and forestry industries, this dataset also provides information about the demand for agricultural residues for cattle feed and bedding, tillage systems currently in use on agricultural lands, and land suitability for hybrid poplar and willow plantations that are grown specifically to produce biomass. Agricultural information includes the median annual residue yield and available residue amounts. Residue yields were calculated using crop-to-residue ratios. The available residue information includes the amount that is available after adjusting for the estimated demand of straw used for cattle feed and bedding. Forestry estimates include average residue production, based on forestry activities including permitted amounts of harvesting, mills in operation and mill production. Municipal Solid Waste information includes organic waste (food and yard), paper waste and total residential municipal solid waste (which includes organic and paper waste, among others).
-

The “Biomass Agriculture Inventory 1-in-10 Probability” dataset is a table that contains the estimated 1-in-10 year low for agricultural residue yield and crop production for each Biomass Report Framework. It provides the tenth percentile values for the years 1985-2016. The table includes straw or stover information for barley, wheat, flax, oats and corn, and crop information for barley, wheat, flax, oats, corn, canola and soybean. This dataset also includes information about the type of tillage used in the area and demand for straw for cattle bedding and feed. These values are derived from Statistics Canada data. Additionally, the dataset includes the amount of agricultural residue calculated as necessary to remain on the field to prevent soil degradation. Soil degradation is determined by the type of tillage in use as well as the landscape of the area.
-
This dataset is no longer maintained by Agriculture and Agri-Food Canada and should be considered as an archived product. For current estimates of the agricultural extent in Canada please refer to the Agricultural Ecumeme produced by Statistics Canada. https://www150.statcan.gc.ca/n1/en/catalogue/92-639-X The Agriculture Extent of Canada derived from the AVHRR (Advanced Very High Resolution Radiometer) was obtained from the GeoGratis web site (www.geogratis.ca). All polygons with an area less than 50 Km sq were eliminated by GeoGratis before we received the data. This product allows the user to see the significant areas of cropland and rangeland across Canada. The Agriculture Extent of Canada derived from the AVHRR (Advanced Very High Resolution Radiometer) was obtained from the GeoGratis web site (www.geogratis.ca). All polygons with an area less than 50 Km sq were eliminated by GeoGratis before we received the data. This product allows the user to see the significant areas of cropland and rangeland across Canada.
-
Ces données, tirées du Recensement de l’agriculture de 2011, proviennent de la documentation publiée ou préliminaire décrivant le secteur des céréales et des légumineuses. L’ensemble de données a été créé pour faciliter la description géographique et l’analyse du secteur, ainsi que la production de rapports connexe. La sélection de variables du Recensement de l’agriculture de 2011 s’est appuyée sur le document « Projet de stratégie scientifique de la DGST pour les céréales et les légumineuses » (version 21 produite le 25 février 2014) document dans lequel il est écrit: « Voici la liste des céréales et des légumineuses qui relèvent des programmes de la DGST, et par conséquent de la présente stratégie scientifique sectorielle: Céréales; blé (toutes catégories), orge (de brasserie et fourragère), avoine, seigle, triticale; maïs-grain. Légumineuses; haricots secs (blanc et de couleur), pois secs (verts, jaunes et autres), lentilles, pois chiches.» Pour plus d’information, consulter : www.agr.gc.ca/atlas/metadonnees/5a8973f8-1d7c-4ead-a1a6-2883b7b9a8b6
-
The Prairie Soil Zones file shows the general distribution of major soil zones across the Prairie region of Canada. Soil zones (based on the Canadian System of Soil Classification) are named based on the dominant soil classification of the soils in each zone. Data extent is limited to the Agricultural Zone as defined in Soil Landscapes of Canada v 3.0 (Lefebvre et al. 2005).
-

These products represent crop health indices derived from the Versatile Soil Moisture Budget (VSMB) model using crop specific coefficients and station based precipitation and temperature measurements to simulate crop growth. The VSMB model simulates soil moisture dynamics and water stress conditions based on water availability in the soil profile and simulated evapotranspiration during the crop growing season. Crop phenological stages, which are related to crop water use, are determined by a biometeorlogical time scale model (Robertson, 1968) for cool season crops (wheat, barley etc.) and a Crop Heat Unit (Brown and Bootsma, 1993) algorithm for warm season crops (corn and soybean etc.).
-

Table of animal samples requested for rabies testing in Manitoba since the province took over the rabies program on April 1, 2014. This table contains information on animal samples requested for rabies testing in Manitoba since the province took over the rabies program on April 1, 2014. As of that date, the Canadian Food Inspection Agency (CFIA) is no longer involved with managing rabies cases in Manitoba. The provincial Rabies Management Program is now coordinated by Manitoba Rabies Central, which is a collaborative effort involving the Manitoba departments of Health, and Environment, Climate and Parks. Samples for rabies testing are requested by Manitoba Health in cases of human exposure to a suspected rabid animal, and by Agriculture in the case of animal exposure to another suspect rabid animal. Collection of a sample from the suspect rabid animal is coordinated by Agriculture. This information will be updated on a quarterly basis. This data is used in the Manitoba Rabies Surveillance Dashboard. Fields included (Alias (Field Name): Field Description.) Region (Region): Regional health authority where the affected person or animal was exposed Fiscal Year (Fiscal_Year): Government of Manitoba fiscal year (April 1-March 31) when the rabies testing was requested Date (Date): Date when the sample for rabies testing was requested Year (Year): Calendar year (January 1-December 31) when the sample for rabies testing was requested Species (Species): Animal species of the sample requested for rabies testing Result (Result): Laboratory result of the sample tested for rabies.
-
Crop rotation is an agricultural production and land management practice beneficial to sustainable agriculture in Canada. Agriculture and Agri-Food Canada (AAFC) produces crop rotation data annually showing the crop rotations used within the agricultural extent of Canada for the last four complete growing seasons (based on available data). This data can be used by producers, land managers, and policy makers to assess current rotations to assist in future land management decisions.Crop rotation data is derirved from AAFC's publicly-available annual crop inventory data.
-
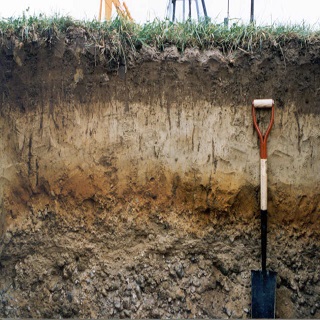
This dataset is a rasterized version of the Soil Landscapes of Canada (SLC) dataset. Soil attributes in this dataset have been collated from SLC map polygons and follow the GlobalSoilMap.net standards and specifications at specified depth increments extending over the agricultural portion of Canada. Weighted averages of soil attribute properties are generated from existing soil horizon information to conform to recognized fixed depth increments. Soil attribute weighted means are calculated by using all the soil components based on their areal extent within each SLC polygon. The weighted mean averages of attributes are spatially represented by the grid along with the lowest and highest attribute values found within each polygon.