 Arctic SDI catalogue
Farmlands
Type of resources
Topics
Keywords
Contact for the resource
Provided by
Years
Formats
Representation types
Update frequencies
status
Service types
-
The impact of climatic variability on the environment is of great importance to the agricultural sector in Canada. Monitoring the impacts on water supplies, soil degradation and agricultural production is essential to the preparedness of the region in dealing with possible drought and other agroclimate risks. Derived normal climate data represent 30-year averages (1961-1990, 1971-2000, 1981-2010, 1991-2020) of climate conditions observed at a particular location. The derived normal climate data represents 30-year averages or “normals” for precipitation, temperature, growing degree days, crop heat units, frost, and dry spells. These normal trends are key to understanding agroclimate risks in Canada. These normal can be used as a baseline to compare against current conditions, and are particularly useful for monitoring drought risk.
-

These products represent crop health indices derived from the Versatile Soil Moisture Budget (VSMB) model using crop specific coefficients and station based precipitation and temperature measurements to simulate crop growth. The VSMB model simulates soil moisture dynamics and water stress conditions based on water availability in the soil profile and simulated evapotranspiration during the crop growing season. Crop phenological stages, which are related to crop water use, are determined by a biometeorlogical time scale model (Robertson, 1968) for cool season crops (wheat, barley etc.) and a Crop Heat Unit (Brown and Bootsma, 1993) algorithm for warm season crops (corn and soybean etc.).
-

The “Agricultural Major Land Practices Groups of the Canadian Prairies” dataset lays out the areas of the 5 Major Land Practices Groups of the agricultural portions of the Canadian Prairies. They are represented by vector polygons amalgamated (dissolved) from the Version 1.9 SLC polygons sharing common water resources, land use and farming practices as developed in the “Agricultural Land Practices Groups of the Canadian Prairies by SLC Polygon” of this series. The dataset is based upon selected attributes from the Soil Landscapes of Canada (SLC) and the 1996 Census of Agriculture. Typical attributes including: land in pasture, land in summerfallow, crop mixture, farm size and the level of chemical and fertilizer inputs.
-

The 2015 AAFC Land Use is a culmination and curated metaanalysis of several high-quality spatial datasets produced between 1990 and 2021 using a variety of methods by teams of researchers as techniques and capabilities have evolved. The information from the input datasets was consolidated and embedded within each 30m x 30m pixel to create consolidated pixel histories, resulting in thousands of unique combinations of evidence ready for careful consideration. Informed by many sources of high-quality evidence and visual observation of imagery in Google Earth, we apply an incremental strategy to develop a coherent best current understanding of what has happened in each pixel through the time series.
-

The 2005 AAFC Land Use is a culmination and curated metaanalysis of several high-quality spatial datasets produced between 1990 and 2021 using a variety of methods by teams of researchers as techniques and capabilities have evolved. The information from the input datasets was consolidated and embedded within each 30m x 30m pixel to create consolidated pixel histories, resulting in thousands of unique combinations of evidence ready for careful consideration. Informed by many sources of high-quality evidence and visual observation of imagery in Google Earth, we apply an incremental strategy to develop a coherent best current understanding of what has happened in each pixel through the time series.
-

The AAFC Land Use Time Series is a culmination and curated meta-analysis of several high-quality spatial datasets produced between 2000 and 2021 using a variety of methods by teams of researchers as techniques and capabilities have evolved. The information from the input datasets was consolidated and embedded within each 30m x 30m pixel to create consolidated pixel histories, resulting in thousands of unique combinations of evidence ready for careful consideration. Informed by many sources of high-quality evidence and visual observation of imagery in Google Earth, we apply an incremental strategy to develop a coherent best current understanding of what has happened in each pixel through the time series.
-
The 2020 AAFC Land Use is a culmination and curated metaanalysis of several high-quality spatial datasets produced between 1990 and 2021 using a variety of methods by teams of researchers as techniques and capabilities have evolved. The information from the input datasets was consolidated and embedded within each 30m x 30m pixel to create consolidated pixel histories, resulting in thousands of unique combinations of evidence ready for careful consideration. Informed by many sources of high-quality evidence and visual observation of imagery in Google Earth, we apply an incremental strategy to develop a coherent best current understanding of what has happened in each pixel through the time series.
-

Monthly 30-year Average Minimum Temperature represents the average monthly minimum temperature calculated at a given location averaged across a 30 year period (1961-1991, 1971-2000, 1981-2010, 1991-2020). These values are calculated across Canada in 10x10 km cells.
-
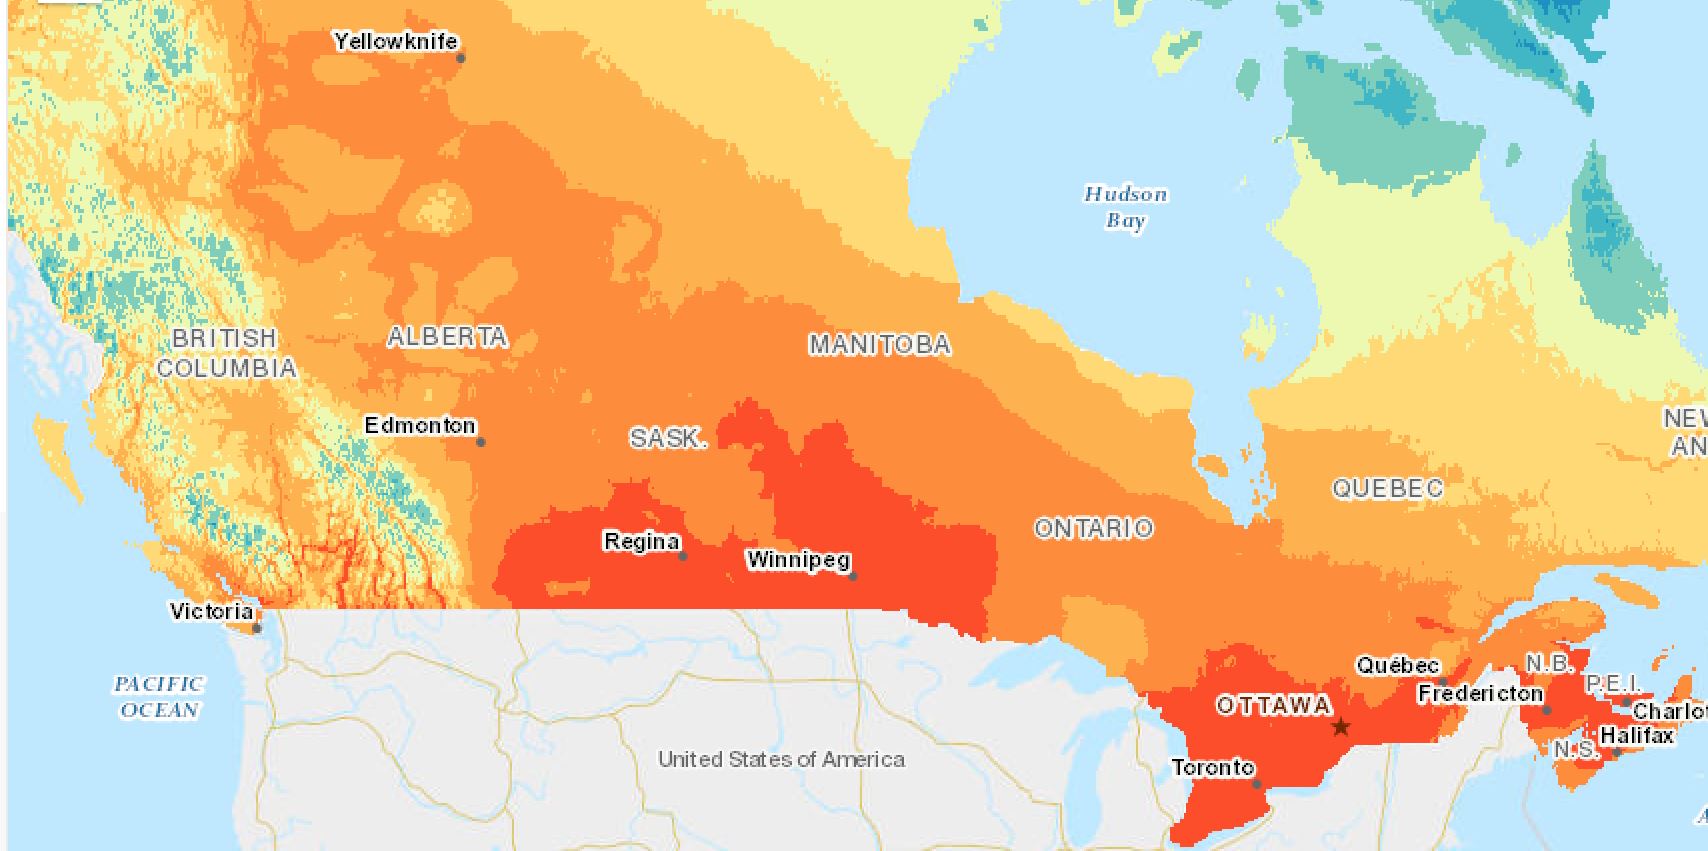
Monthly 30-year Average Mean Temperature represents the average monthly mean temperature calculated at a given location averaged across a 30 year period (1961-1991, 1971-2000, 1981-2010, 1991-2020). These values are calculated across Canada in 10x10 km cells.
-

LiDAR data collected in 2018 of water control structures in Tennaille, Newton, and Huff Lake in Saskatchewan, Canada. Includes Digital Terrain Models, Contours, and Orthorectified imagery. LiDAR Data to be used by AAFC to assess whether additional land control should be pursued and other hydrological studies including potential dam break failure scenarios.