 Arctic SDI catalogue
Weather
Type of resources
Available actions
Topics
Keywords
Contact for the resource
Provided by
Years
Formats
Representation types
Update frequencies
status
Service types
-

The Canadian Weathership Program collected meteorological data at Station Papa (50N, 145W) in the North Pacific Ocean between 1949 and 1981. In 2014, researchers at the University of Washington (UW) Applied Physics Laboratory (APL) and the National Oceanic and Atmospheric Administration (NOAA) Pacific Marine Environmental Laboratory (PMEL) analyzed this historic data to determine its efficacy as a scientific tool. The data available here are the Government of Canada data files that were utilized for this analysis. The "OWSP Full Data (1949-1981)" file contains the entire Canadian Weathership Program record of data collected from Station Papa and the "OWSP Daily Averaged Wind Speed and Wave Height Data (1949-1981)" file contains daily averaged values of wind speed and wave height generated by the UW APL and NOAA PMEL researchers. The Data Dictionary for each data file contains notes on any quality controls that were applied to the data by the UW APL and NOAA PMEL researchers. The UW documents titled, "Data Documentation for Dataset 1170 (DSI-1170), Surface Marine Data, National Climatic Data Center" (https://digital.lib.washington.edu/researchworks/bitstream/handle/1773/25570/td1170.pdf?sequence=6&isAllowed=y) and "Table detailing units of data values in each file" (https://digital.lib.washington.edu/researchworks/handle/1773/25570), provide further information on the key values, point scales, and other units that were used in these datasets.
-

This table contains quality-controlled weather station data from various sources across Canada since 2006.
-

Stations for measuring the impact of greening projects on air temperature and humidity. Fifteen stations were installed across the City of Montreal for a period of 10 summers in order to study the impact of urban development on heat. In the long term, the City wishes to install 25 throughout its territory. Better understanding these phenomena is an essential step in order to be able to address the problem of extreme heat in urban areas, which have an impact on the health and well-being of citizens. With this project, the City intends to measure the impact of greening projects on air temperature, train and raise awareness among its staff by participating in a research/action project and raise public awareness of the impact of greening on air temperature.**This third party metadata element was translated using an automated translation tool (Amazon Translate).**
-

ECMWF is the European Centre for Medium-Range Weather Forecasts. Both a research institute and a 24/7 operational service, producing global numerical weather predictions and other data for our Member and Co-operating States and the broader community. The Centre has one of the largest supercomputer facilities and meteorological data archives in the world. Other strategic activities include delivering advanced training and assisting the WMO in implementing its programmes. A key player in Copernicus, the Earth Observation component of the European Union’s Space programme, offering quality-assured information on climate change (Copernicus Climate Change Service), atmospheric composition (Copernicus Atmosphere Monitoring Service), flooding and fire danger (Copernicus Emergency Management Service), and through the EU's Destination Earth initiative, we are developing prototype digital twins of the Earth. The organisation was established in 1975 and now employs around 450 staff from more than 35 countries. ECMWF is one of the six members of the Co-ordinated Organisations, which also include the North Atlantic Treaty Organisation (NATO), the Council of Europe (CoE), the European Space Agency (ESA), the Organisation for Economic Co-operation and Development (OECD), and the European Organisation for the Exploitation of Meteorological Satellites (EUMETSAT). This page contains information how to access data of the ECMWF.
-
Cumulative heat-energy satisfies the essential requirement of field crop growth and development towards a high yield and good quality of agricultural crop products. Agriculture is an important primary production sector in Canada. Agricultural production, profitability, sustainability and food security depend on many agrometeorological factors. Extreme weather events in Canada, such as drought, floods, heat waves, frosts and high intensity storms, have the ability to significantly impact field crop production. Agriculture and Agri-Food Canada (AAFC) and Environment and Climate Change Canada (ECCC) have together developed a suite of extreme agrometeorological indices based on four main categories of weather factors: temperature, precipitation, heat, and wind. The extreme weather indices are intended as short-term prediction tools and generated using ECCC’s medium range forecasts to create a weekly index product on a daily basis.
-
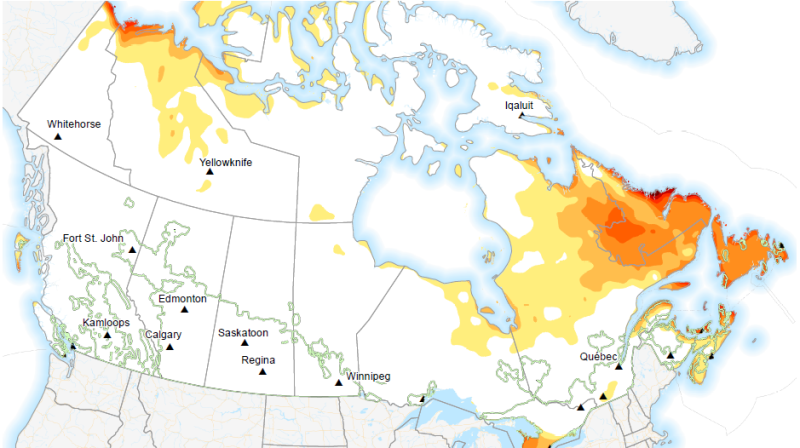
The Probability (likelihood) of frost occurring. The number of days in the forecast period with a minimum temperature below the frost temperature, the temperature at which frost damage occurs. This temperature is -2°C for cool season crops (ffd_cool_prob). Week 1 and week 2 forecasted probability is available daily from April 1 to October 31. Week 3 and week 4 forecasted probability is available weekly (Thursday) from April 1 to October 31. Cool season crops require a relatively low temperature condition. Typical examples include wheat, barley, canola, oat, rye, pea, and potato. They normally grow in late spring and summer, and mature between the end of summer and early fall in the southern agricultural areas of Canada. The optimum temperature for such crops is 25°C. Agriculture and Agri-Food Canada (AAFC) and Environment and Climate Change Canada (ECCC) have together developed a suite of extreme agrometeorological indices based on four main categories of weather factors: temperature, precipitation, heat, and wind. The extreme weather indices are intended as short-term prediction tools and generated using ECCC’s medium range forecasts to create a weekly index product on a daily and weekly basis.
-
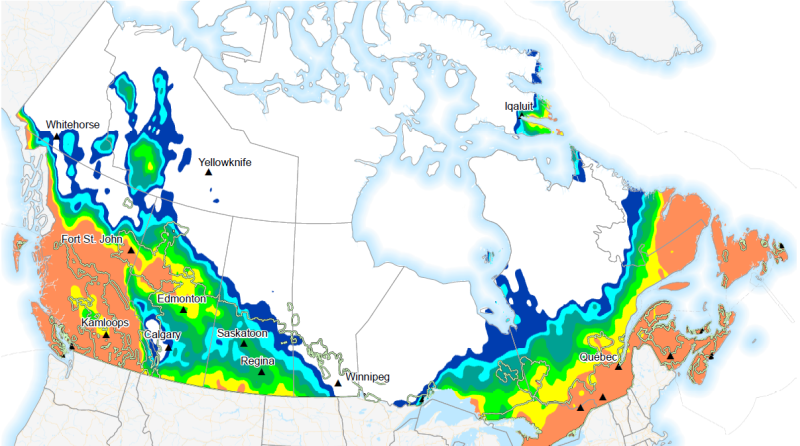
The probability of maximum wind above 50km/h (mdws50_prob). Week 1 and week 2 forecasted probability is available daily from September 1 to August 31. Week 3 and week 4 forecasted probability is available weekly (Thursday) from September 1 to August 31. Winds can significantly influence crop growth and yield mainly due to mechanical damage of plant vegetative and reproductive organs, an imbalance of plant-soil-atmosphere water relationships, and pest and disease distributions in agricultural fields. The maximum wind speed and the number of strong wind days over the forecast period represent short term and extended strong wind events respectively. Agriculture and Agri-Food Canada (AAFC) and Environment and Climate Change Canada (ECCC) have together developed a suite of extreme agrometeorological indices based on four main categories of weather factors: temperature, precipitation, heat, and wind. The extreme weather indices are intended as short-term prediction tools and generated using ECCC’s medium range forecasts to create a weekly index product on a daily and weekly basis.
-

The number of days during the forecast period with an average wind speed greater than 30 km/h and a maximum temperature above 30°C (drying). Week 1 and week 2 forecasted index is available daily from September 1 to August 31. Week 3 and week 4 forecasted index is available weekly (Thursday) from September 1 to August 31. Winds can significantly influence crop growth and yield mainly due to mechanical damage of plant vegetative and reproductive organs, an imbalance of plant-soil-atmosphere water relationships, and pest and disease distributions in agricultural fields. The maximum wind speed and the number of strong wind days over the forecast period represent short term and extended strong wind events respectively. Agriculture and Agri-Food Canada (AAFC) and Environment and Climate Change Canada (ECCC) have together developed a suite of extreme agrometeorological indices based on four main categories of weather factors: temperature, precipitation, heat, and wind. The extreme weather indices are intended as short-term prediction tools and generated using ECCC’s medium range forecasts to create a weekly index product on a daily and weekly basis.
-

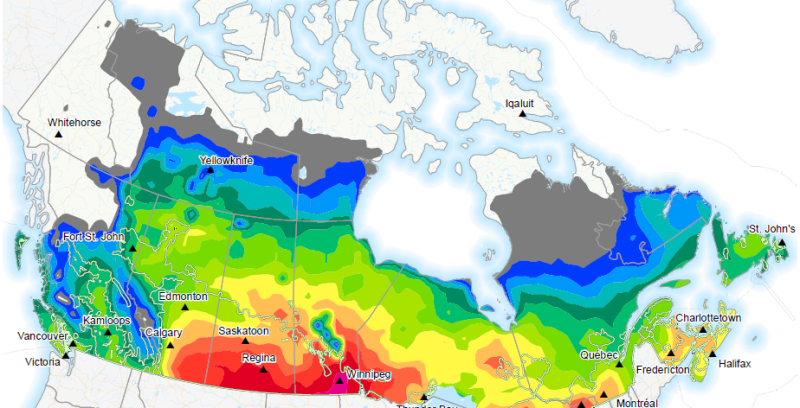
An accumulated value of heat degrees that the average temperature is above a specified threshold, 5°C for cool season crops. This condition must be maintained for at least 5 consecutive days in order for EGDD to be accumulated (egdd_cool). Week 1 and week 2 forecasted index is available daily from April 1 to October 31. Week 3 and week 4 forecasted index is available weekly (Thursday) from April 1 to October 31. Cumulative heat-energy satisfies the essential requirement of field crop growth and development towards a high yield and good quality of agricultural crop products. Agriculture and Agri-Food Canada (AAFC) and Environment and Climate Change Canada (ECCC) have together developed a suite of extreme agrometeorological indices based on four main categories of weather factors: temperature, precipitation, heat, and wind. The extreme weather indices are intended as short-term prediction tools and generated using ECCC’s medium range forecasts to create a weekly index product on a daily and weekly basis.
-
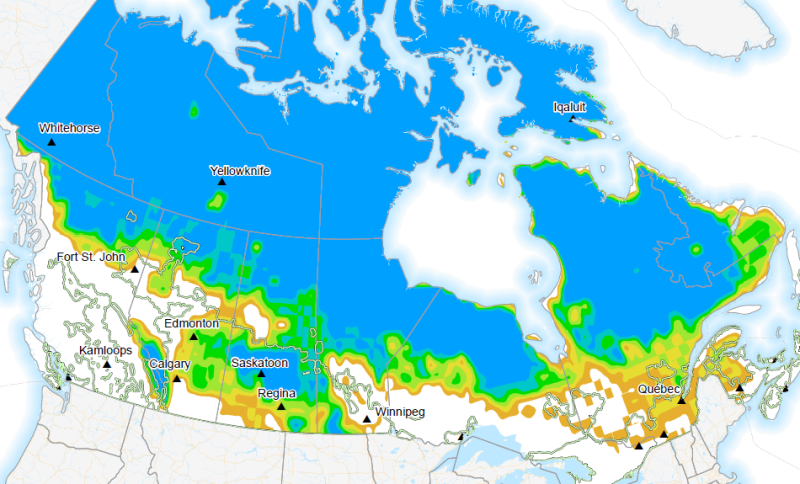
Probability of total precipitation above 100mm over the forecast period (pweek100_prob) Week 1 and week 2 forecasted probability is available daily from September 1 to August 31. Week 3 and week 4 forecasted probability is available weekly (Thursday) from September 1 to August 31. Precipitation (moisture availability) establishes the economic yield potential and product quality of field crops. Both dry and wet precipitation extremes have the ability to inhibit proper crop growth. The greatest daily precipitation index covers the risk of excessive precipitation in the short term, while the other indices pertain to longer term moisture availability. Agriculture and Agri-Food Canada (AAFC) and Environment and Climate Change Canada (ECCC) have together developed a suite of extreme agrometeorological indices based on four main categories of weather factors: temperature, precipitation, heat, and wind. The extreme weather indices are intended as short-term prediction tools and generated using ECCC’s medium range forecasts to create a weekly index product on a daily and weekly basis.