 Arctic SDI catalogue
Fishing area
Type of resources
Available actions
Topics
Keywords
Contact for the resource
Provided by
Years
Formats
Representation types
Update frequencies
status
Service types
-
Cartographic representations of Fisheries Management Areas (FMA)s in the Atlantic and Arctic Regions. Currently Published Fisheries Management Areas: Capelin Crab Herring Mackerel Salmon, Atlantic Scallop Shrimp Snow Crab Squid Each polygon feature class delineates the coordinates of a different series of FMAs. Shapes have been drafted based on a combination of sources including: the Atlantic Fisheries Regulations, Integrated Fisheries Management Plans, indigenous treaties, the bounds of the Territorial Sea, and other information made public on Fisheries and Oceans websites. Information from Variation orders and Conditions of License were also incorporated. The specific sources used to construct each feature class is listed in its metadata and direct links to public sources are included. The original documentation uses a diverse combination datums, or include coordinates with no listed datum. This data series has been projected into NAD83. Vertices in this dataset may differ from the original source documents to fix slivers, make areas congruent with coastlines, or align with other administrative boundaries. Changes made to the original areas in order to make drafting possible have been highlighted in the comments field in the attribute tables. Lines were first drafted as geodesics and vertices were added to approximate loxodromes using the Construct Geodesic Tool in ArcGIS Pro 2.9.8. As documentation is drafted, additional FMAs will be added to the dataset. Currently drafted FMAs my change and expand into currently unmapped areas as new information is incorporated. The feature classes produced as a part of this data series are cartographic representations of legal documents and are meant to be used for general reference in support of marine planning. Whenever there is a difference between the original written source documentation and this digital representation, the originals should be considered authoritative. Every effort has been made to ensure that these files are as accurate as possible but these feature classes are not intended to be used for navigation, legal interpretation or enforcement.
-

Fisheries landings and effort mapping of the inshore lobster fishery on the DFO Maritimes Region statistical grid (2012-2014). This report describes an analysis of Maritimes Region inshore lobster logbook data reported at a grid level, including Bay of Fundy Grey Zone data reported at the coordinate level. Annual and composite (2012–2014) grid maps were produced for landings, number of license-days fished, number of trap hauls, and the same series standardized by grid area, as well as maps of catch weight per number of trap hauls as an index of catch per unit effort (CPUE). Spatial differences in fishing pressure, landings, and CPUE are indicated, and potential mapping applications are outlined. Mapping the distribution and intensity of inshore lobster fishing activity has management applications for spatial planning and related decision support. The lack of region-wide latitude and longitude coordinates for lobster effort and landings limits the utility of commercial logbook data for marine spatial planning purposes.
-

DFO’s Oceans and Coastal Management Division (OCMD) in the Maritimes Region has updated its fisheries landings maps for 2010–2014. These maps will be used for decision making in coastal and oceans management, including mitigating human use conflicts, informing environmental emergency response operations and protocols, informing Marine Stewardship Council certification processes, planning marine protected area networks, assessing ecological risks, and monitoring compliance and threats in coral and sponge closures and Marine Protected Areas. Fisheries maps were created to identify important fishing areas using aggregate landed weight (kg) per 2 x 2-minute grid cell for selected species/gear types. This dataset has been filtered to comply with the Government of Canada's privacy policy. Privacy assessments were conducted to identify NAFO unit areas containing data with less than five vessel IDs, license IDs and fisher IDs. If this threshold was not met, catch weight locations were withheld from these unit areas to protect the identity or activity of individual vessels or companies. Maps were created for the following species/gear types: 1. Atlantic Halibut 2. Bluefin Tuna 3. Bottom Longline Groundfish 4. Bottom Trawl Groundfish 5. Cod 6. Cod, Haddock, Pollock 7. Cusk 8. Dogfish 9. Flatfish 10. Gillnet Groundfish 11. Greenland Halibut 12. Groundfish 13. Groundfish (quarterly composites Q1, Q2, Q3, Q4) 14. Hagfish 15. Herring 16. Large Pelagics 17. Mackerel 18. Monkfish 19. Offshore Clam 20. Offshore Lobster 21. Grey Zone Lobster 22. Other Crab 23. Other Tuna 24. Pollock 25. Porbeagle, Mako and Blue Shark 26. Red Hake 27. Redfish 28. Scallop 29. Scallop (quarterly composites Q1, Q2, Q3, Q4) 30. Sculpin 31. Sea Urchin 32. Shrimp 33. Silver Hake 34. Skate 35. Snow Crab 36. Squid 37. Swordfish 38. White Hake 39. Wolffish
-

Data layers show commercial fishery footprints for directed fisheries using bottom and pelagic longlines for groundfish and large pelagics respectively, and traps for hagfish, LFA 41 and Grey Zone lobster, snow crab, and other crab on the Scotian Shelf, the Bay of Fundy, and Georges Bank in NAFO Divisions 4VWX and Canadian portions of 5Y and 5Z. Bottom longline and trap fishery maps aggregate commercial logbook effort (bottom longline soak time and logbook entries) per 2-minute grid cell using 2002–2017 data. Pelagic longline maps aggregate speed-filtered vessel monitoring system (VMS) track lines as vessel minutes per km2 on a base-10 log scale using 2003–2018 data. The following data layers are included in the mapping service for use in marine spatial planning and ecological risk assessment: 1) multi-year and quarterly composite data layers for bottom longline and trap gear, and 2) multi-year and monthly composite data layers for pelagic longline gear. Additional details are available online: S. Butler, D. Ibarra and S. Coffen-Smout, 2019. Maritimes Region Longline and Trap Fisheries Footprint Mapping for Marine Spatial Planning and Risk Assessment. Can. Tech. Rep. Fish. Aquat. Sci. 3293: v + 30 p. http://publications.gc.ca/collections/collection_2019/mpo-dfo/Fs97-6-3293-eng.pdf
-
DFO’s Oceans and Coastal Management Division (OCMD) in the Maritimes Region has updated its fisheries landings maps for 2010–2014. These maps will be used for decision making in coastal and oceans management, including mitigating human use conflicts, informing environmental emergency response operations and protocols, informing Marine Stewardship Council certification processes, planning marine protected area networks, assessing ecological risks, and monitoring compliance and threats in coral and sponge closures and Marine Protected Areas. Fisheries maps were created to identify important fishing areas using aggregate landed weight (kg) per 2 x 2-minute grid cell for selected species/gear types. This dataset has been privacy screened to comply with the Government of Canada's privacy policy. Privacy assessments were conducted to identify NAFO unit areas containing data with less than five vessel IDs, license IDs and fisher IDs. If this threshold was not met, catch weight locations have been withheld from these unit areas to protect the identity or activity of individual vessels or companies.
-
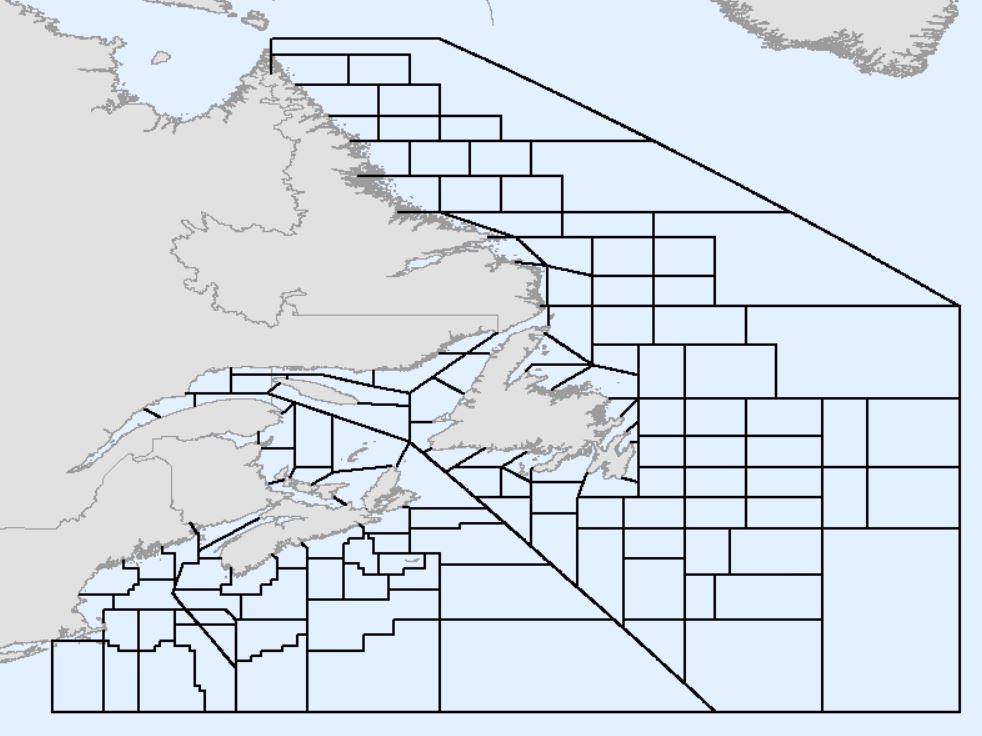
Fisheries and Oceans Canada (DFO) statistical unit areas (also referred to as unit areas) are smaller portions of the Northwest Atlantic Fisheries Organization (NAFO) Subareas, Divisions, and Subdivisions defined in the Convention on Cooperation in the Northwest Atlantic Fisheries (2020). The spatial representation of boundaries defined by NAFO has recently been updated to address inconsistencies and errors in earlier versions, which is available here: https://open.canada.ca/data/dataset/59af1c96-fc8f-4fa0-b398-d65e953eadaa#comment-41855. Unit areas are used by DFO for a variety of purposes including, but not limited to stock assessments, privacy screening of fisheries maps, and statistical analyses. Unit areas were originally defined throughout the 1940s and 1950s. Subsequently, several revisions and alternate versions were created by DFO in various regions leading to inconsistencies in spatial extent and naming conventions. These changes have not been formally documented. The datasets often have topological errors such as gaps and overlaps, especially along diagonals and coastlines. In addition, inconsistencies have arisen from conflicting interpretations of the NAFO divisions, where not all land points are defined by coordinates. Therefore, DFO, with input from the Canadian Hydrographic Service (CHS), has created an updated version of the DFO unit areas file to address inconsistencies and errors among previous versions. The recently updated NAFO divisions were used as the basis for an updated DFO unit areas file. This version of the DFO unit areas must not be used for legal purposes. Legal descriptions of fishing area boundaries can be found in the Atlantic Fisheries Regulations, Maritime Provinces Fishery Regulations, and DFO License Conditions.
-

These datasets show commercial fisheries catch weight landings of directed fisheries and bycatch from the Scotian Shelf, the Bay of Fundy, and Georges Bank from NAFO Divisions 4VWX and the Canadian portions of 5Y and 5Z. Atlantic Canadian inter-regional maps of four species (Atlantic Halibut, Bluefin Tuna, Redfish and Scallop) are also included from NAFO Divisions 4RST, 3KLMNOP, and 2GHJ. Five-year composite maps (2014–2018) that aggregate catches for each map series are publicly available. The maps aggregate catch weight (kg) per 10 km2 hexagon grid cell for selected species, species groupings and gear types to identify important fishing areas. These maps may be used for decision making in coastal and oceans management, including marine spatial planning, environmental emergency response operations and protocols, Marine Stewardship Council certification processes, marine protected area networks, and ecological risk assessment. These datasets have been filtered to comply with the Government of Canada's privacy policy. Privacy assessments were conducted to identify NAFO unit areas containing data with less than five vessel IDs, licence IDs or fisher IDs. If this threshold was not met, catch weight locations were withheld from these unit areas to protect the identity or activity of individual vessels or companies. Maps were created for the following species, species groupings and gear types: 1. Groundfish (all species) 2. Groundfish Bottom Trawl 3. Groundfish Gillnet 4. Groundfish Bottom Longline 5. Groundfish (quarterly composites Q1, Q2, Q3, Q4) 6. Atlantic Cod 7. Atlantic Cod, Haddock and Pollock 8. Flatfish 9. Atlantic Halibut 10. Greenland Halibut (Turbot) 11. Hagfish 12. Cusk 13. Dogfish 14. Redfish 15. Red Hake 16. Silver Hake 17. White Hake 18. Monkfish 19. Sculpin 20. Skate 21. Wolffish 22. Squid 23. Herring 24. Mackerel 25. Large Pelagics 26. Bluefin Tuna 27. Other Tuna 28. Swordfish 29. Porbeagle, Mako and Blue Shark 30. Snow Crab 31. Other Crab 32. Scallop 33. Scallop (quarterly composites Q1, Q2, Q3, Q4) 34. Offshore Clam 35. Shrimp 36. Offshore Lobster 37. Disputed Zone Area 38B Lobster 38. Whelk
-

This report describes an analysis of Maritimes Region inshore lobster logbook data reported at a grid level, including Bay of Fundy Disputed Zone data reported at the coordinate level. Annual and composite (2015–2019) grid maps were produced for landings, number of trap hauls, and the same series standardized by grid area, as well as maps of catch weight per number of trap hauls as an index of catch per unit effort (CPUE). Spatial differences in fishing pressure, landings, and CPUE are indicated, and potential mapping applications are outlined. Mapping the distribution and intensity of inshore lobster fishing activity has management applications for spatial planning and related decision support. The lack of region-wide latitude and longitude coordinates for inshore lobster effort and landings limits the utility of commercial logbook data for marine spatial planning purposes.
-

The Northwest Atlantic Fisheries Organization (NAFO) Secretariat, Fisheries and Oceans Canada (DFO) and the Canadian Hydrographic Service (CHS) have collaborated to update the spatial representation of the NAFO Subareas, Divisions, and Subdivisions as defined in Annex 1 to the Convention on Cooperation in the Northwest Atlantic Fisheries (2020) (https://www.nafo.int/Portals/0/PDFs/key-publications/NAFOConvention.pdf). The NAFO Convention does not indicate which datum should be used for spatial representation. The datum used at the time of development of the NAFO Convention would have been North American Datum 1927 (NAD27). However, all datasets were derived using NAD83. International boundaries have been updated based on accepted coordinates between the USA and Canada (http://www.internationalboundarycommission.org/en/maps-coordinates/coordinates.php), and Canada and Greenland (https://www.treaty-accord.gc.ca/text-texte.aspx?id=105136). This version of the NAFO Divisions is not intended to be used for legal purposes and is being provided for mapping / illustrative purposes only.