 Arctic SDI catalogue
Fish
Type of resources
Available actions
Topics
Keywords
Contact for the resource
Provided by
Years
Formats
Representation types
Update frequencies
status
Service types
Scale
-

PURPOSE: Scope the distribution of Smallmouth Bass in the Miramichi River Watershed using eDNA DESCRIPTION: This dataset contains the results of work undertaken from 2019 to 2024 to scope the extent of the spread of Smallmouth Bass in parts of the Miramichi River Watershed using an eDNA-based species-specific qPCR approach. USE LIMITATION: To ensure scientific integrity and appropriate use of the data, we would encourage you to contact the data custodian.
-

Results from temperature preference experiments demonstrated that individual personality was consistent and repeatability. Individual preferred and maximum avoidance temperatures were significantly reduced in hypoxia compared to normoxia. Standard metabolic rate increased with temperature and body mass. Patterns of projected habitat change suggest the spatial extent of the current distribution of Carmine shiner would shift north with global warming. The understanding of habitat requirements and responses to climate will aid management and recovery efforts for this threatened species. Cite this dataset as: Enders, Eva. Data of: Carmine Shiner Conservation Physiology. Arctic and Aquatic Research Division, Fisheries and Oceans Canada, Winnipeg Manitoba. https://open.canada.ca/data/en/dataset/a6a606a4-8cdc-48e9-812c-7bdcd84840e7
-
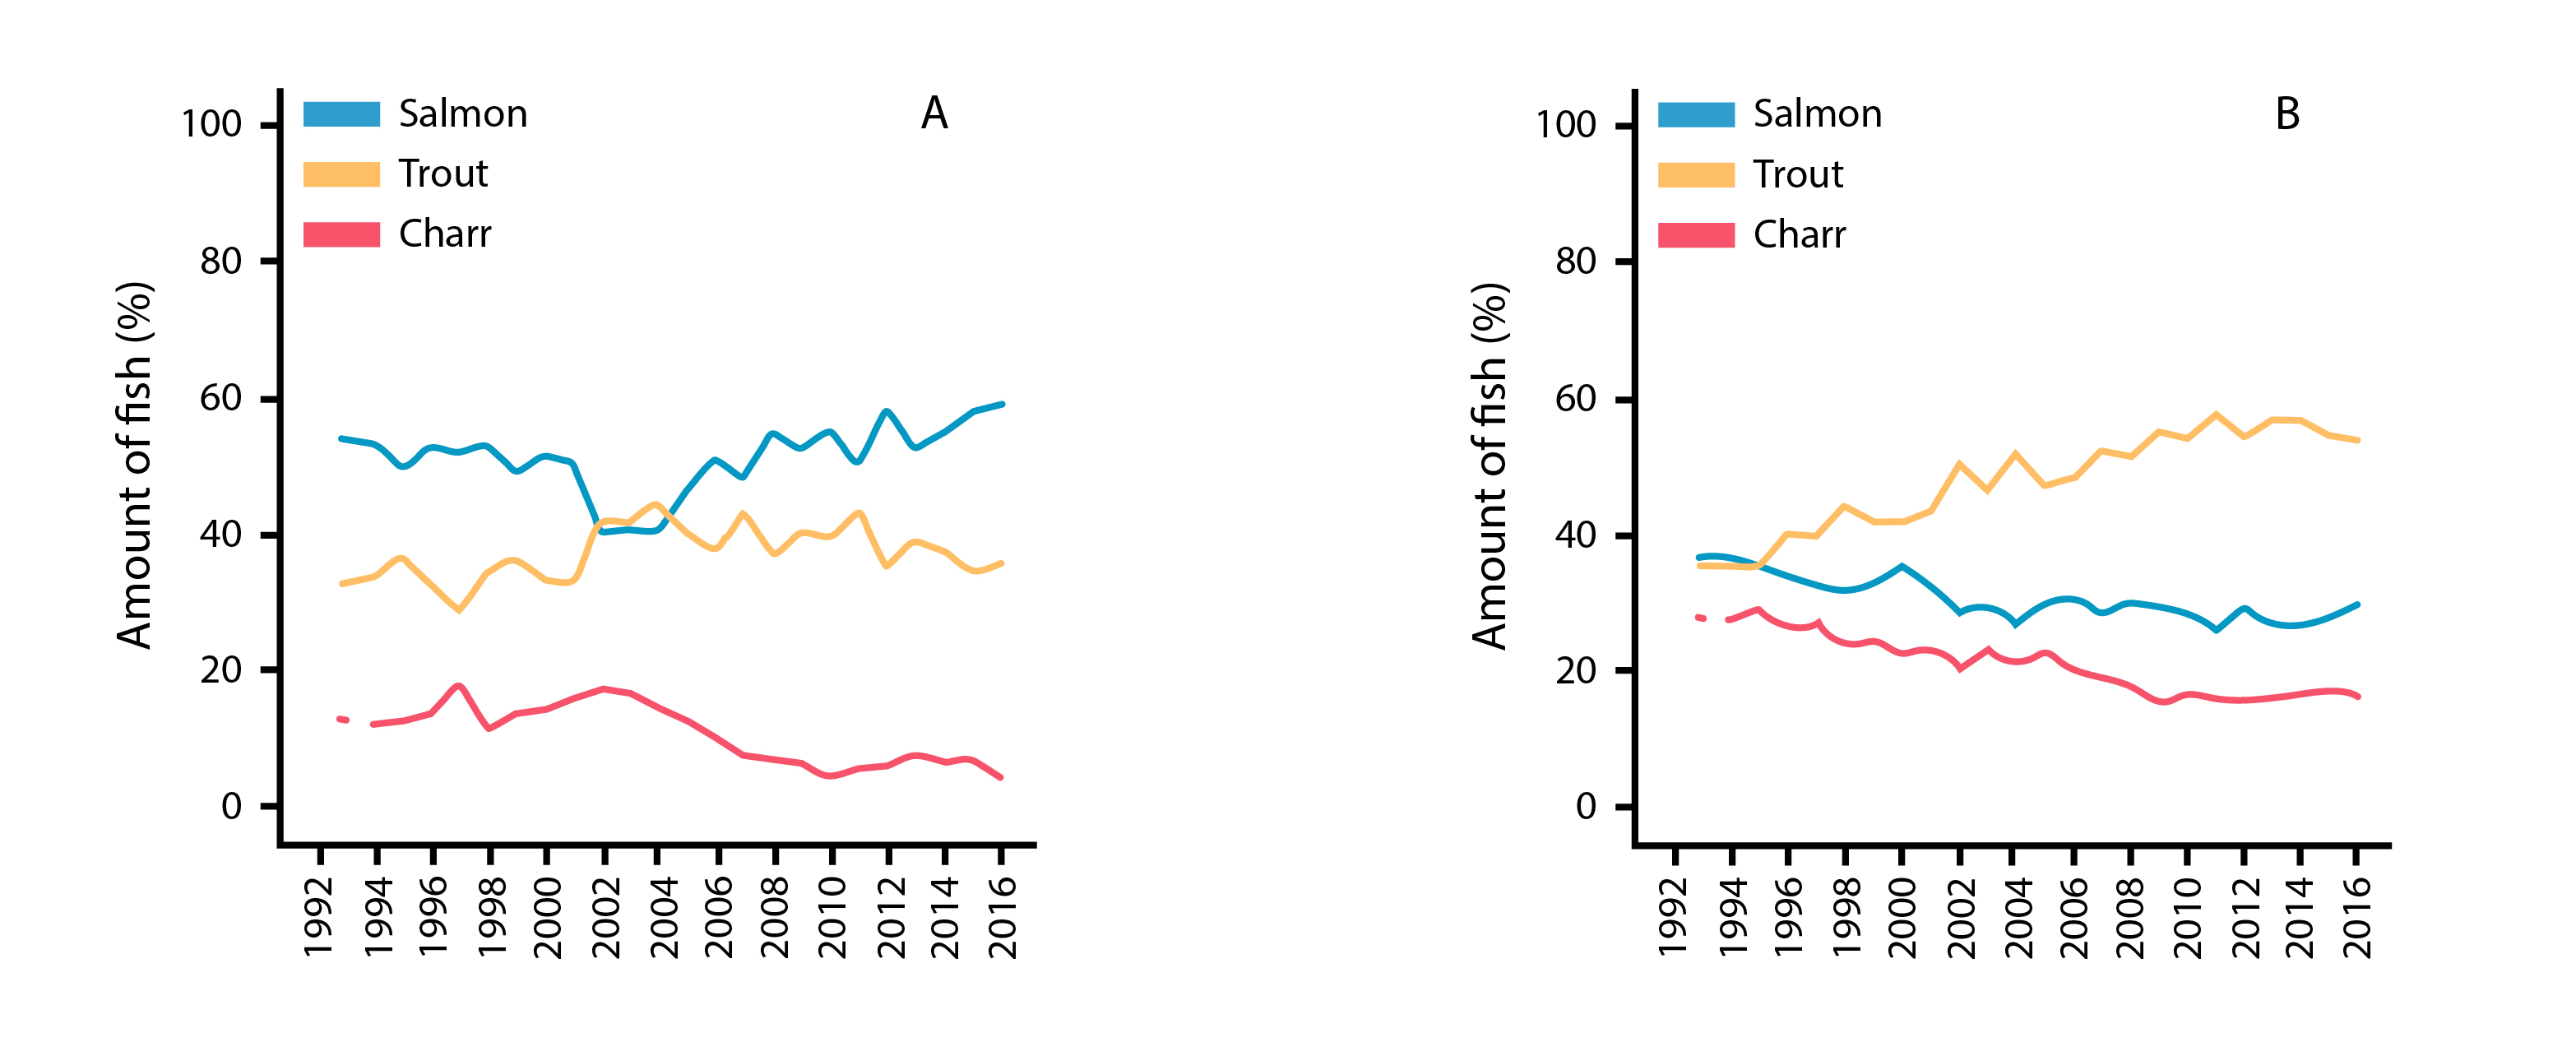
Temporal patterns in % abundance of Atlantic salmon, brown trout, and anadromous Arctic charr from catch statistics in northern Norway rivers monitored from 1993 to 2016, including basins dominated by (a) rivers and (b) lakes. State of the Arctic Freshwater Biodiversity Report - Chapter 4 - Page 81- Figure 4-42
-
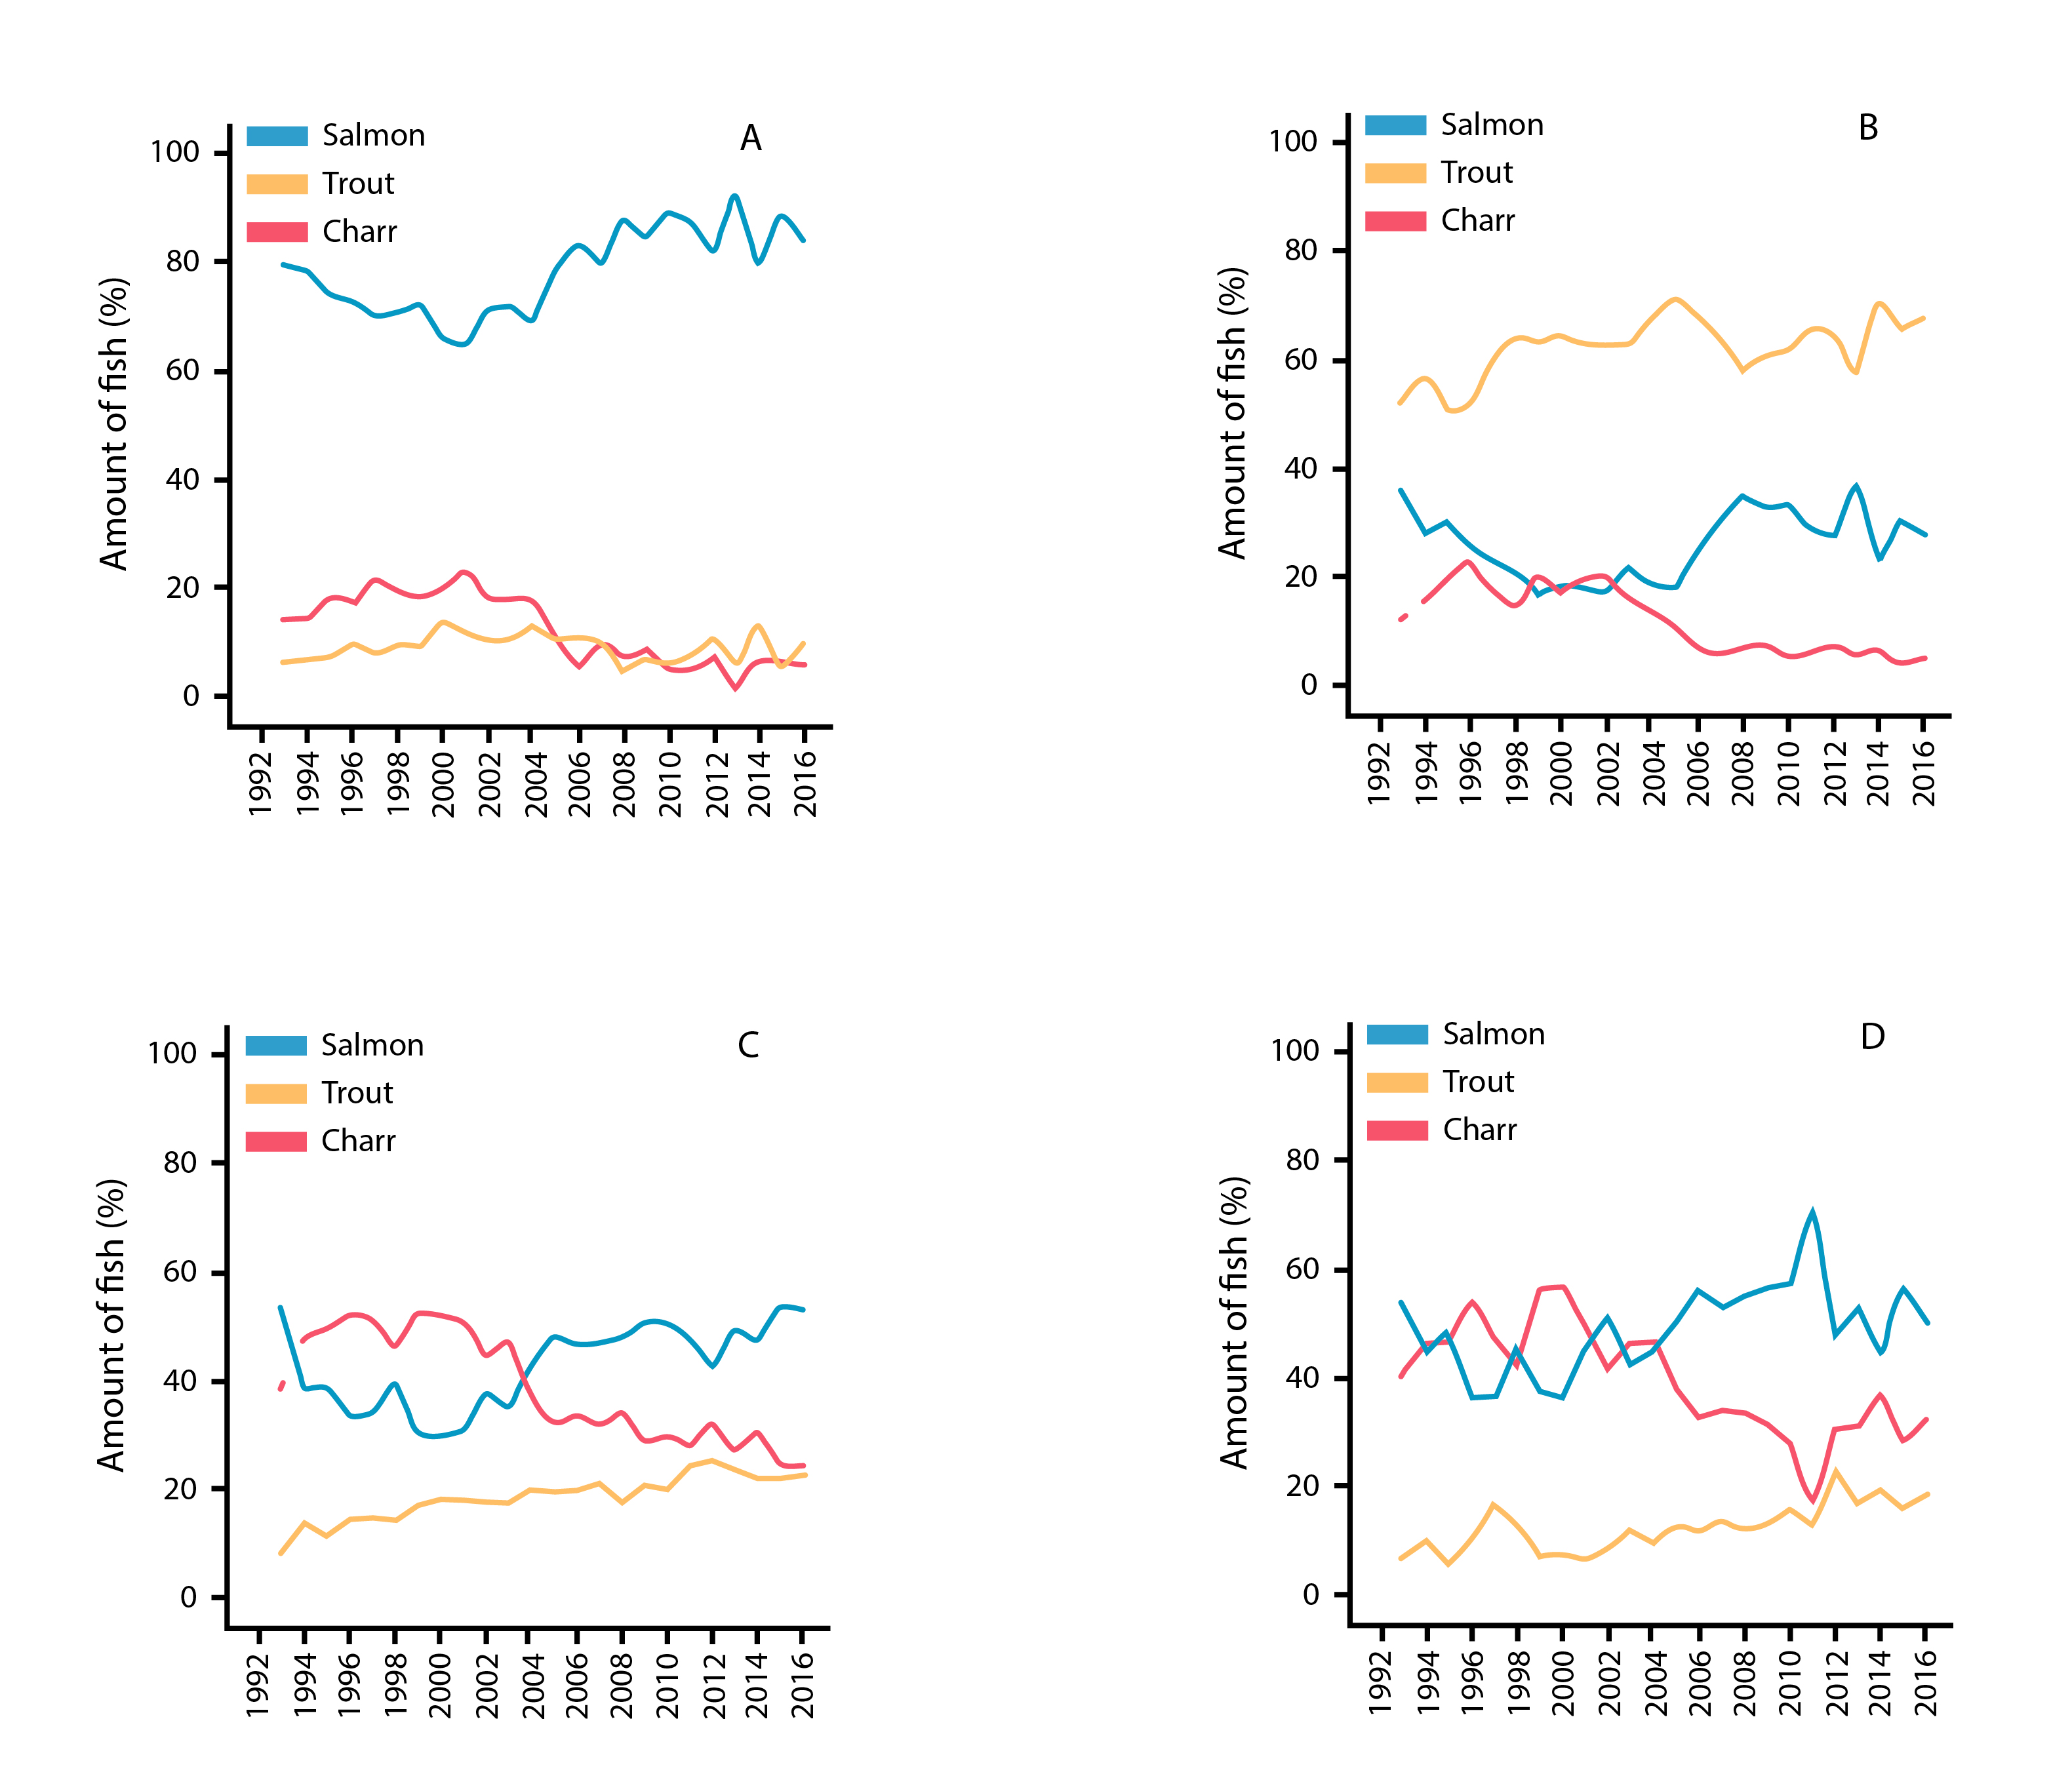
Temporal patterns in % abundance of Atlantic salmon, brown trout, and anadromous Arctic charr from catch statistics in Iceland rivers monitored from 1992 to 2016, showing results from (a) west, (b) south, (c) north, and (d) east Iceland. State of the Arctic Freshwater Biodiversity Report - Chapter 4 - Page 81 - Figure 4-41
-

Fisheries landings and effort mapping of the inshore lobster fishery on the DFO Maritimes Region statistical grid (2012-2014). This report describes an analysis of Maritimes Region inshore lobster logbook data reported at a grid level, including Bay of Fundy Grey Zone data reported at the coordinate level. Annual and composite (2012–2014) grid maps were produced for landings, number of license-days fished, number of trap hauls, and the same series standardized by grid area, as well as maps of catch weight per number of trap hauls as an index of catch per unit effort (CPUE). Spatial differences in fishing pressure, landings, and CPUE are indicated, and potential mapping applications are outlined. Mapping the distribution and intensity of inshore lobster fishing activity has management applications for spatial planning and related decision support. The lack of region-wide latitude and longitude coordinates for lobster effort and landings limits the utility of commercial logbook data for marine spatial planning purposes.
-

Data layers show commercial fishery footprints for directed fisheries using bottom and pelagic longlines for groundfish and large pelagics respectively, and traps for hagfish, LFA 41 and Grey Zone lobster, snow crab, and other crab on the Scotian Shelf, the Bay of Fundy, and Georges Bank in NAFO Divisions 4VWX and Canadian portions of 5Y and 5Z. Bottom longline and trap fishery maps aggregate commercial logbook effort (bottom longline soak time and logbook entries) per 2-minute grid cell using 2002–2017 data. Pelagic longline maps aggregate speed-filtered vessel monitoring system (VMS) track lines as vessel minutes per km2 on a base-10 log scale using 2003–2018 data. The following data layers are included in the mapping service for use in marine spatial planning and ecological risk assessment: 1) multi-year and quarterly composite data layers for bottom longline and trap gear, and 2) multi-year and monthly composite data layers for pelagic longline gear. Additional details are available online: S. Butler, D. Ibarra and S. Coffen-Smout, 2019. Maritimes Region Longline and Trap Fisheries Footprint Mapping for Marine Spatial Planning and Risk Assessment. Can. Tech. Rep. Fish. Aquat. Sci. 3293: v + 30 p. http://publications.gc.ca/collections/collection_2019/mpo-dfo/Fs97-6-3293-eng.pdf
-
DFO’s Oceans and Coastal Management Division (OCMD) in the Maritimes Region has updated its fisheries landings maps for 2010–2014. These maps will be used for decision making in coastal and oceans management, including mitigating human use conflicts, informing environmental emergency response operations and protocols, informing Marine Stewardship Council certification processes, planning marine protected area networks, assessing ecological risks, and monitoring compliance and threats in coral and sponge closures and Marine Protected Areas. Fisheries maps were created to identify important fishing areas using aggregate landed weight (kg) per 2 x 2-minute grid cell for selected species/gear types. This dataset has been privacy screened to comply with the Government of Canada's privacy policy. Privacy assessments were conducted to identify NAFO unit areas containing data with less than five vessel IDs, license IDs and fisher IDs. If this threshold was not met, catch weight locations have been withheld from these unit areas to protect the identity or activity of individual vessels or companies.
-

DFO’s Oceans and Coastal Management Division (OCMD) in the Maritimes Region has updated its fisheries landings maps for 2010–2014. These maps will be used for decision making in coastal and oceans management, including mitigating human use conflicts, informing environmental emergency response operations and protocols, informing Marine Stewardship Council certification processes, planning marine protected area networks, assessing ecological risks, and monitoring compliance and threats in coral and sponge closures and Marine Protected Areas. Fisheries maps were created to identify important fishing areas using aggregate landed weight (kg) per 2 x 2-minute grid cell for selected species/gear types. This dataset has been filtered to comply with the Government of Canada's privacy policy. Privacy assessments were conducted to identify NAFO unit areas containing data with less than five vessel IDs, license IDs and fisher IDs. If this threshold was not met, catch weight locations were withheld from these unit areas to protect the identity or activity of individual vessels or companies. Maps were created for the following species/gear types: 1. Atlantic Halibut 2. Bluefin Tuna 3. Bottom Longline Groundfish 4. Bottom Trawl Groundfish 5. Cod 6. Cod, Haddock, Pollock 7. Cusk 8. Dogfish 9. Flatfish 10. Gillnet Groundfish 11. Greenland Halibut 12. Groundfish 13. Groundfish (quarterly composites Q1, Q2, Q3, Q4) 14. Hagfish 15. Herring 16. Large Pelagics 17. Mackerel 18. Monkfish 19. Offshore Clam 20. Offshore Lobster 21. Grey Zone Lobster 22. Other Crab 23. Other Tuna 24. Pollock 25. Porbeagle, Mako and Blue Shark 26. Red Hake 27. Redfish 28. Scallop 29. Scallop (quarterly composites Q1, Q2, Q3, Q4) 30. Sculpin 31. Sea Urchin 32. Shrimp 33. Silver Hake 34. Skate 35. Snow Crab 36. Squid 37. Swordfish 38. White Hake 39. Wolffish
-

The Coastal Biodiversity Trawl Survey for the Passamaquoddy Bay was conducted annually between July to October from 2009 to 2019. This survey was intended to monitor long-term change in local species presence, habitat utilization, and health. The sampling activities support coastal research in fisheries, aquaculture, marine protected areas, and ecosystem change. Data collected prior to 2013 are generally not recommended for comparative analysis due to changes in vessel, sampling effort, and protocols. For additional information please see: - Cooper, J.A. and Blanchard, M.J. 2016. Coastal Biodiversity Trawl of the Passamaquoddy Bay Area: 2009 to 2014. Can. Tech. Rep. Fish. Aquat. Sci. 3176: xi+52 p.
-

PURPOSE: Monitor commercial landings of NAFO Division 4T Atlantic herring. DESCRIPTION: This dataset contains Atlantic herring landings (in metric tonnes) by year, spawning stock (spring and fall spawners), fishing season (spring and fall), and gear type (fixed and mobile). Stock identification (spring or fall spawners) is determined through port sampling. Two fish samples are collected per week in each herring fishing area for this purpose. Daily landings data are obtained from the DFO Statistics Branch. USE LIMITATION: To ensure scientific integrity and appropriate use of the data, we would encourage you to contact the data custodian.