 Arctic SDI catalogue
WFS
Type of resources
Available actions
Topics
Keywords
Contact for the resource
Provided by
Years
Formats
Representation types
Update frequencies
status
Service types
Scale
-

Multi-Agency Ground Plot (MAGPlot) database (DB) is a pan-Canadian forest ground-plot data repository. The database synthesize forest ground plot data from various agencies, including the National Forest Inventory (NFI) and 12 Canadian jurisdictions: Alberta (AB), British Columbia (BC), Manitoba (MB), New Brunswick (NB), Newfoundland and Labrador (NL), Nova Scotia (NS), Northwest Territories (NT), Ontario (ON), Prince Edward Island (PE), Quebec (QC), Saskatchewan (SK), and Yukon Territory (YT), contributed in their original format. These datasets underwent data cleaning and quality assessment using the set of rules and standards set by the contributors and associated documentations, and were standardized, harmonized, and integrated into a single, centralized, and analysis-ready database. The primary objective of the MAGPlot project is to collate and harmonize forest ground plot data and to present the data in a findable, accessible, interoperable, and reusable (FAIR) format for pan-Canadian forest research. The current version includes both historical and contemporary forest ground plot data provided by data contributors. The standardized and harmonized dataset includes eight data tables (five site related and three tree measurement tables) in a relational database schema. Site-related tables contain information on geographical locations, treatments (e.g. stand tending, regeneration, and cutting), and disturbances caused by abiotic factors (e.g., weather, wildfires) or biotic factors (e.g., disease, insects, animals). Tree-related tables, on the other hand, focus on measured tree attributes, including biophysical and growth parameters (e.g., DBH, height, crown class), species, status, stem conditions (e.g., broken or dead tops), and health conditions. While most contributors provided large and small tree plot measurements, only NFI, AB, MB, and SK contributed datasets reported at regeneration plot level (e.g., stem count, regeneration species). Future versions are expected to include updated and/or new measurement records as well as additional tables and measured and compiled (e.g., tree volume and biomass) attributes. MAGPlot is hosted through Canada’s National Forest Information System (https://nfi.nfis.org/en/maps). ----------------------------------------------------- TREE MEASUREMENTS WFS LAYERS: ----------------------------------------------------- Shows the distribution of measured trees, with each point representing multiple / stacked trees that have been measured at a site location ------------------------------------------------------- SITES SUMMARY WMS & WFS LAYER: ------------------------------------------------------- Shows the distribution of magplot sites nationwide, with each point representing the location of a site. ----------- NOTES: ----------- The MAGPlot release (v1.0.0 and v1.1.0) does not include NL and SK datasets due to pending Data Sharing Agreements, ongoing data processing, or restrictions on third-party sharing. These datasets will be included in future releases. While certain jurisdictions permit open or public data sharing, given that requestor signs and adheres the Data Use agreement, there are some jurisdictions that require a jurisdiction-specific request form to be signed in addition to the Data Use Agreement form. For the MAGPlot Data Dictionary, other metadata, datasets available for open sharing (with approximate locations), data requests (for other datasets or exact coordinates), and available data visualization products, please check all the folders in the “Data and Resources” section below. Coordinates in web services have been randomized within 5km of true location to preserve site integrity Access the WFS (Web Feature Service) and WMS (Web Map Service) layers from the “Data and Resources” section below. Sample WFS requests to download MAGPlot data without a GIS client are available in the supplementary materials package linked below. A data request must be submitted to access historical datasets, datasets restricted by data-use agreements, or exact plot coordinates using the link below. NFI Data Request Form: https://nfi.nfis.org/en/datarequestform ----------------------------------- ACKNOWLEDGEMENTS: ----------------------------------- We acknowledge and recognize the following agencies that have contributed data to the MAGPlot database: Government of Alberta - Ministry of Agriculture, Forestry, and Rural Economic Development - Forest Stewardship and Trade Branch Government of British Columbia - Ministry of Forests - Forest Analysis and Inventory Branch Government of Manitoba - Ministry of Economic, Development, Investment, Trade, and Natural Resources - Forestry and Peatlands Branch Government of New Brunswick - Ministry of Natural Resources and Energy Development - Forestry Division, Forest - Planning and Stewardship Branch Government of Newfoundland & Labrador - Department of Fisheries, Forestry and Agriculture - Forestry Branch Government of Nova Scotia - Ministry of Natural Resources and Renewables - Department of Natural Resources and Renewables Government of Northwest Territories - Department of Environment & Climate Change - Forest Management Division Government of Ontario - Ministry of Natural Resources and Forestry - Science and Research Branch, Forest Resources Inventory Unit Government of Prince Edward Island - Department of Environment, Energy, and Climate Action - Forests, Fish, and Wildlife Division Government of Quebec - Ministry of Natural Resources and Forests - Forestry Sector Government of Saskatchewan - Ministry of Environment - Forest Service Branch Government of Yukon - Ministry of Energy, Mines, and Resources - Forest Management Branch Government of Canada - Natural Resources Canada - Canadian Forest Service - National Forest Inventory Projects Office
-
WFS tjänsten för Stationsregistret. Stationsregistret är ett samlat nationellt register över anläggningar (stationer, provplatser) där man bedriver miljöövervakning.
-

Sea Ice Frequency charts display the percentage of days with more than 15 % ice coverage for each month over a 30 years periode.
-
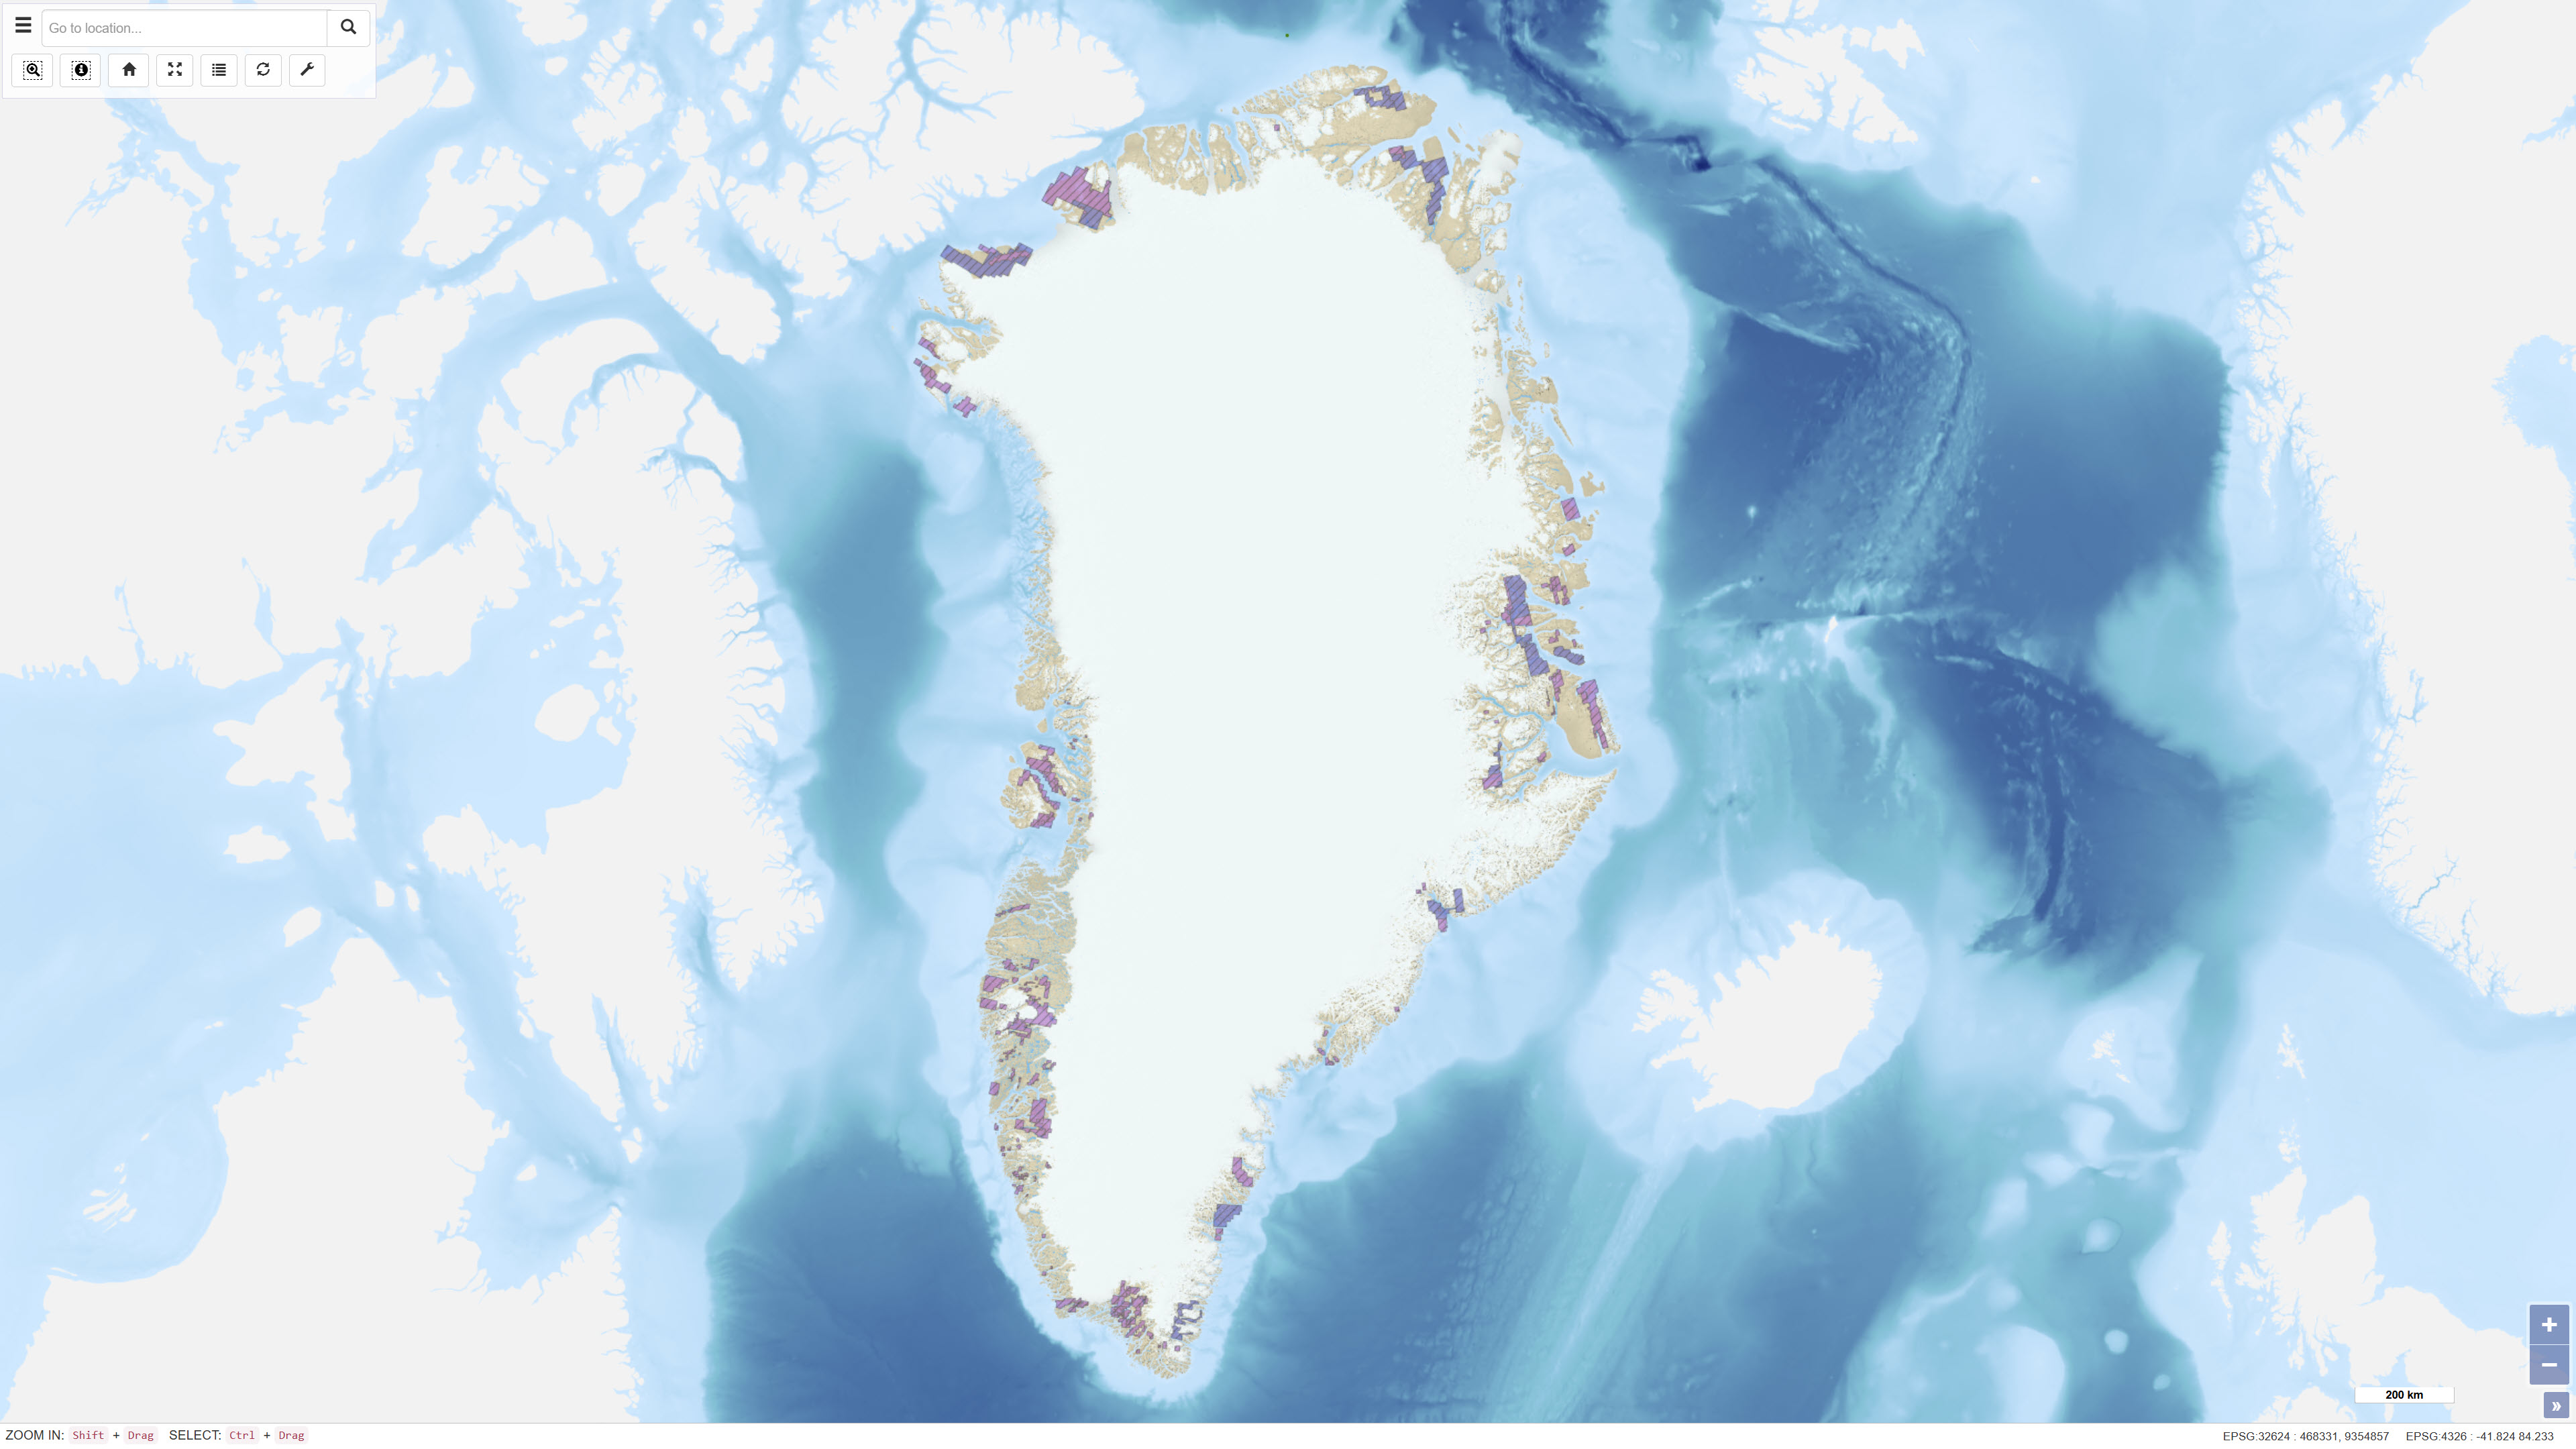
The dataset contains polygons representing historical exploration and exploitation licences for mineral resources in Greenland. The data are based on geographic information provided via WFS by the Ministry of Mineral Resources in Greenland and are redistributed without modification of the original boundaries. The dataset provides an overview of former licence areas and their spatial extent.
-
The dataset contains polygons representing applications for mineral-related activities in Greenland, including exploration and exploitation licences. The dataset includes different processing statuses such as Approval Applications, Licence Pending and Under Review. The data are based on geographic information provided via WFS by the Ministry of Mineral Resources in Greenland and are redistributed without modification of the original boundaries. The dataset provides an overview of areas where licence applications are under review or awaiting decision.
-

On July 6, a train of 72 cars, carrying 100 tons of crude oil each, exploded in Lac-Mégantic. The fire is now out. Several buildings in the city center were destroyed. Some forty buildings would be affected, including residences and businesses. The yellow perimeter (still active) corresponds to the controlled access zone. The red perimeter (inactive) corresponded to the area restricted to emergency responders. The green perimeter (inactive) was the reintegration zone. Purpose: To identify in the field the various perimeters related to ongoing operations.**This third party metadata element was translated using an automated translation tool (Amazon Translate).**
-
%20-%20datas%C3%A6t.jpg)
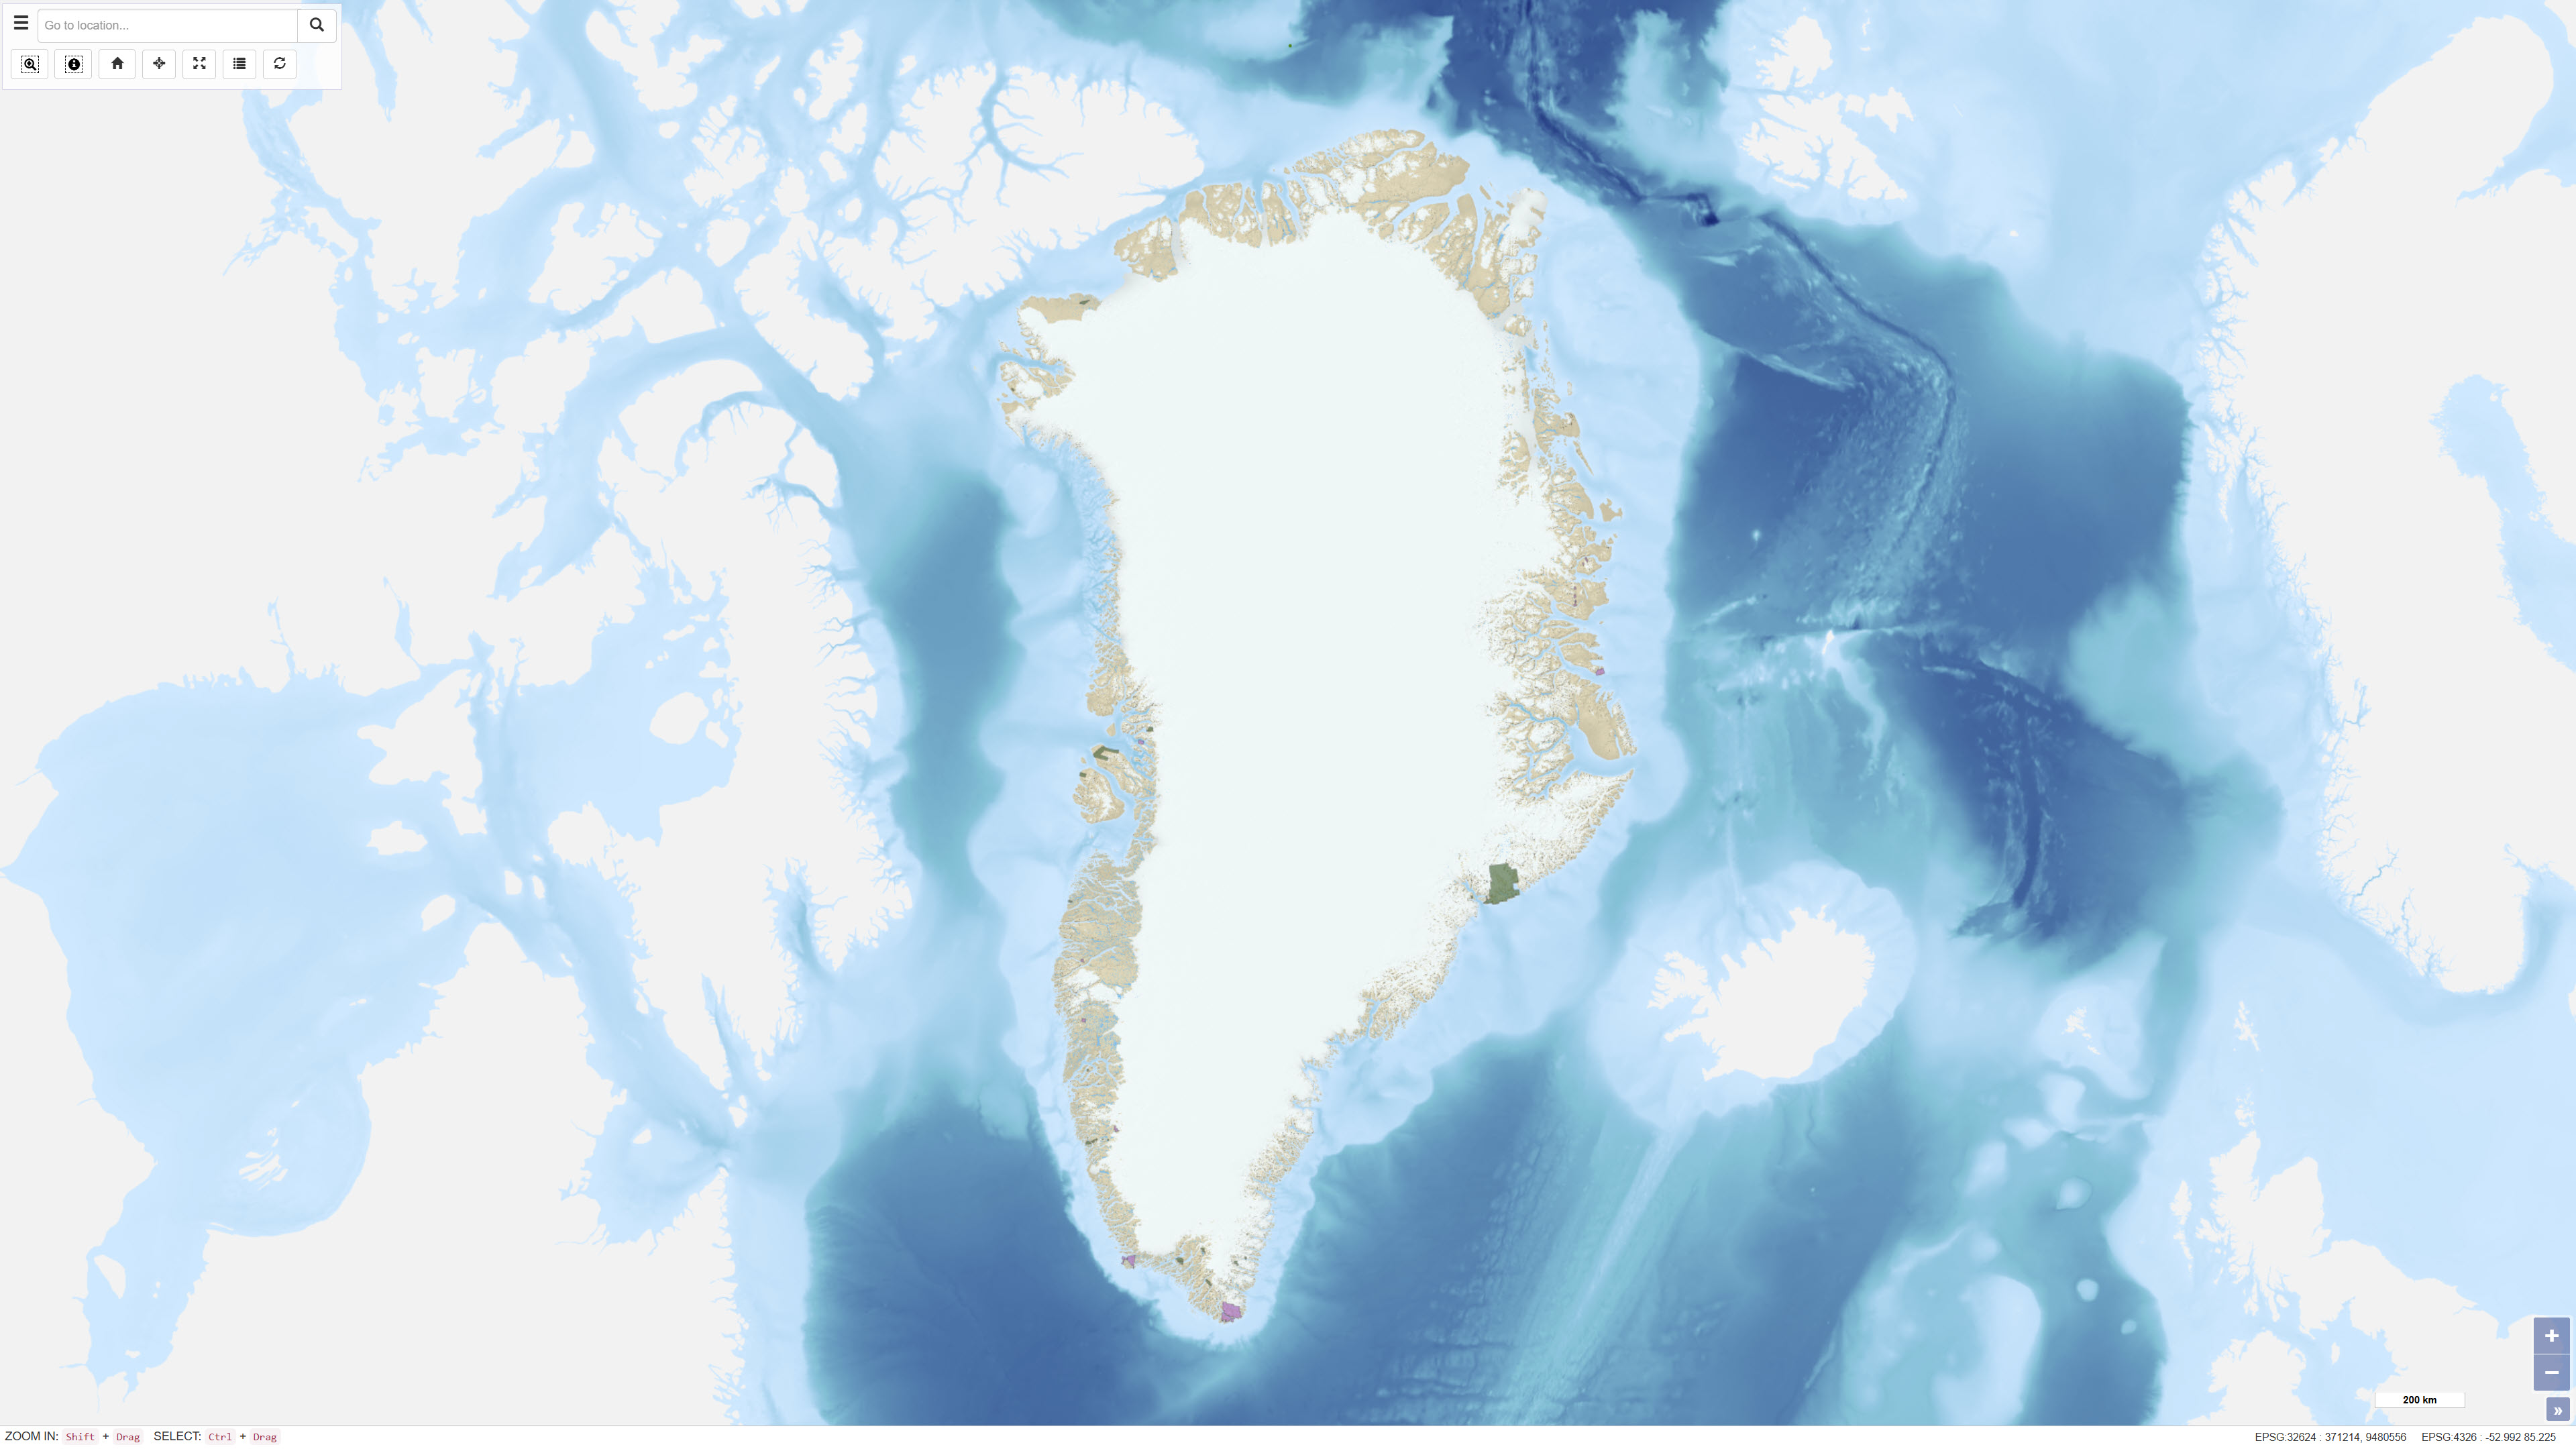
The dataset contains polygons representing selected protected and regulated areas in Greenland relevant to mineral activities. The areas include UNESCO World Heritage Sites, nature protection areas, and zones with specific restrictions or prohibitions on mineral activities. The dataset is converted from a WFS service provided by the Ministry of Mineral Resources in Greenland and is used as a geographic reference in the assessment of exploration and exploitation licences. The polygons represent administrative boundaries and do not constitute a legally binding representation of current legislation.
-
%20-%20datas%C3%A6t.jpg)
The dataset contains geochemical analytical results for rock samples from Greenland, collected through GEUS field and project activities and made available as an extract from GEUS’ information system GimmeX. Samples were collected for various purposes including geological mapping, geochemistry, ore geology and mineral exploration, and no systematic rock sampling was undertaken. Analytical data are organised by analytical type/method and accompanying tables document the analytical results. Sample location accuracy varies, in particular for samples collected before 1997, and older positions may have been adjusted between different map bases.
-
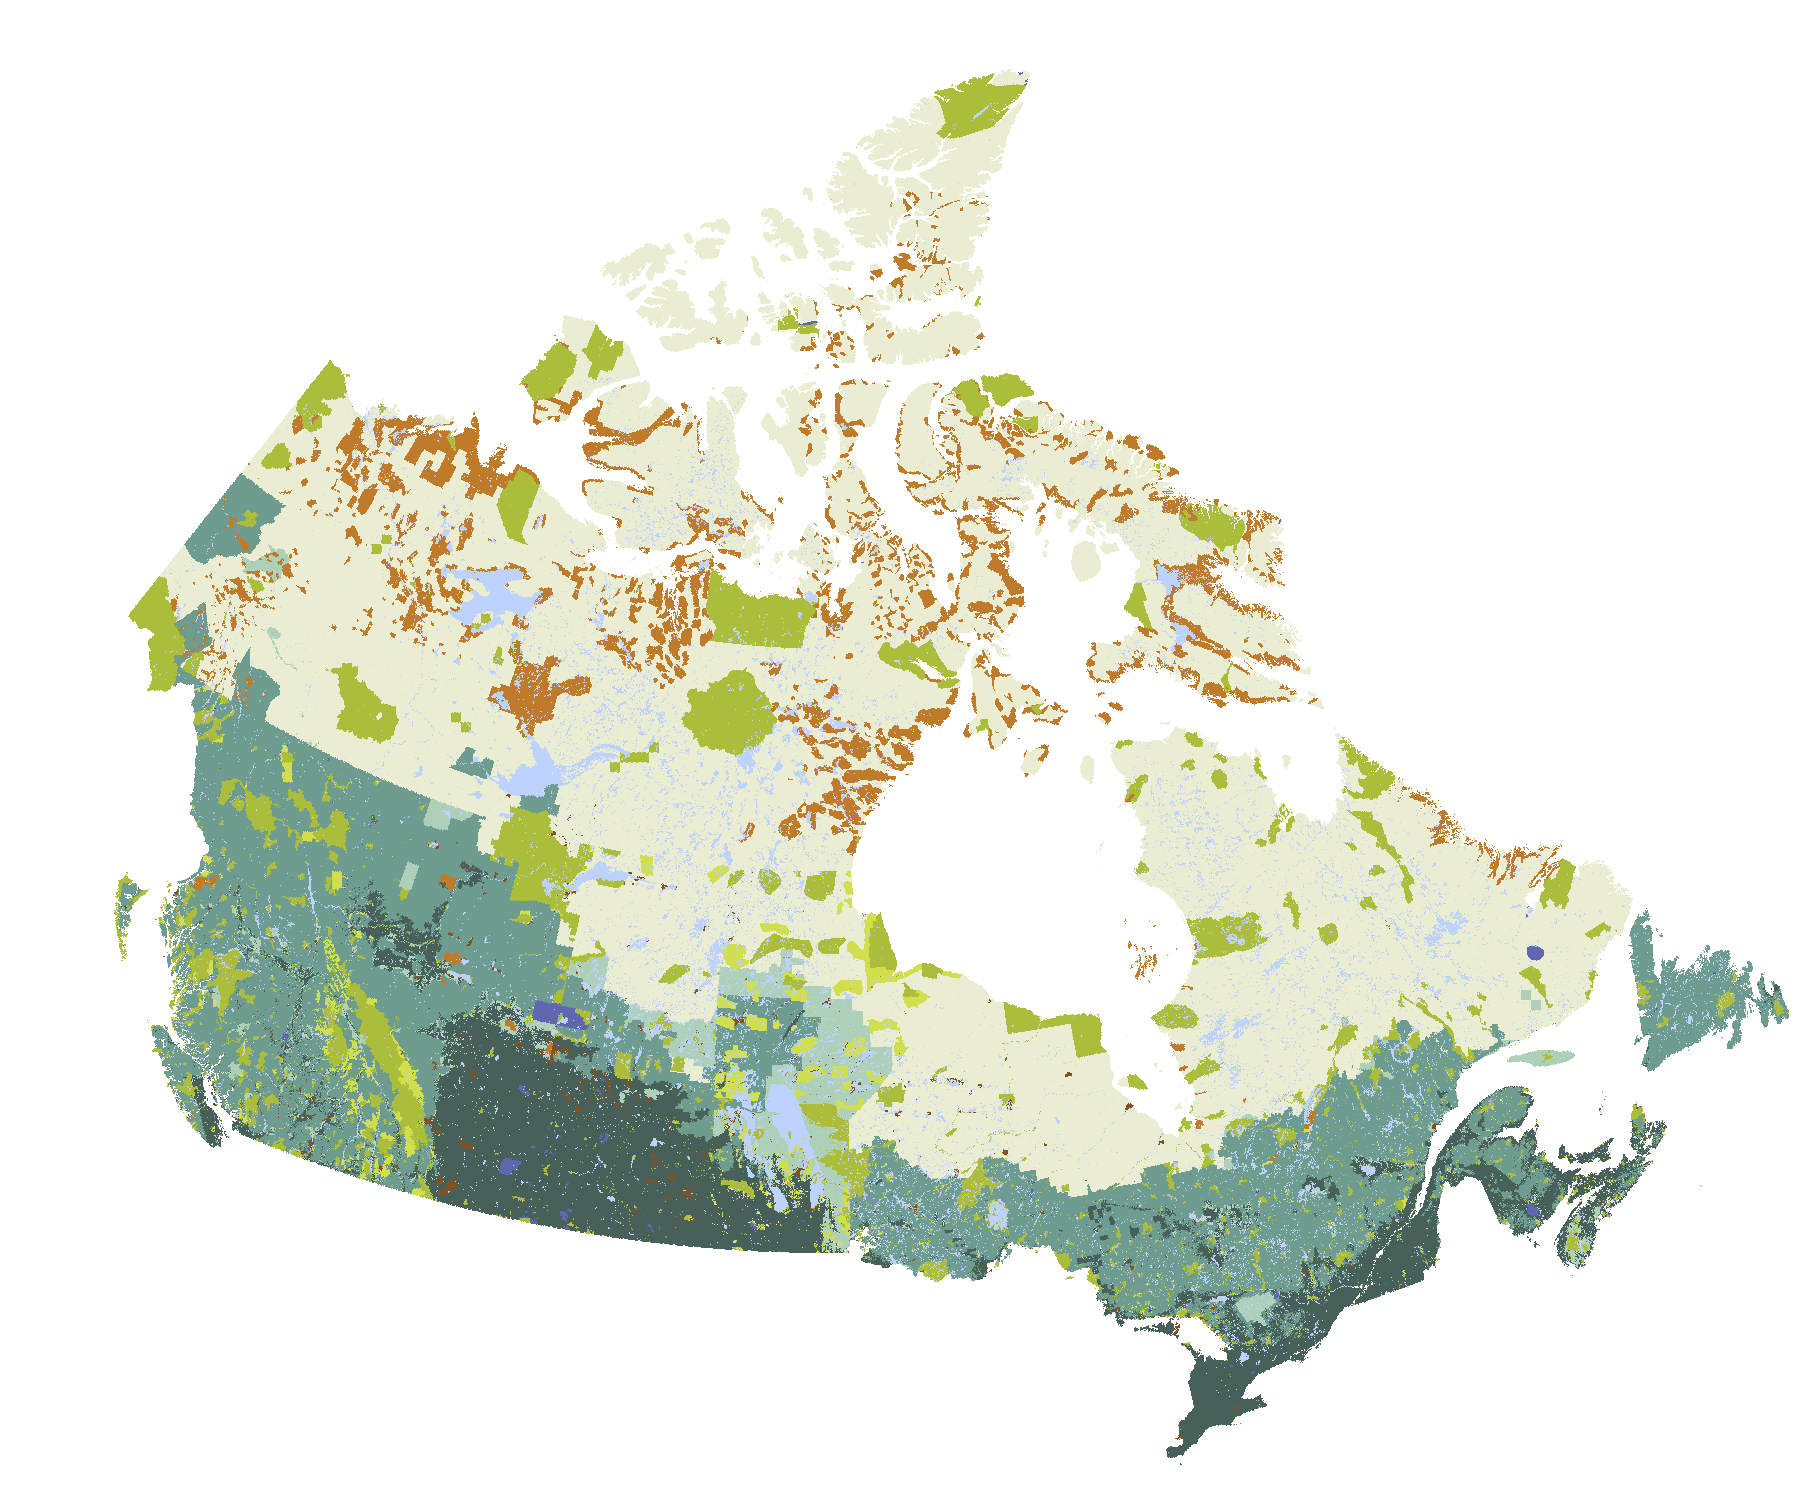
Forests cover large areas of Canada but only some of these forests are actively managed. The Map of Forest Management in Canada provides a generalized classification of forest management in Canada, including: protected areas, Treaty/Settlement Lands (including Treaty Lands identified in Final Agreements, Land Claim Agreements and Settlements), Indian Reserves, other federal reserves (including military training areas), provincial and territorial reserves and restricted use areas, private lands, short- and long-term Crown forest tenure areas and areas with no current Crown timber dispositions. The Managed Forest Map of Canada dataset provides a wall-to-wall classification of lands in Canada. It does not differentiate areas of forest from non-forest. The Managed Forest Map of Canada differs from maps defining the area designated as “managed forest” for greenhouse gas inventory reporting purposes and does not replace those maps. Instead, the Managed Forest Map of Canada shows areas that are currently managed, as of June 2017, and provides generalized management type classification for those areas. Collaborating agencies plan to update the dataset periodically as needed, and remain open to receiving advice from experts concerning refinement priorities for future versions.
-
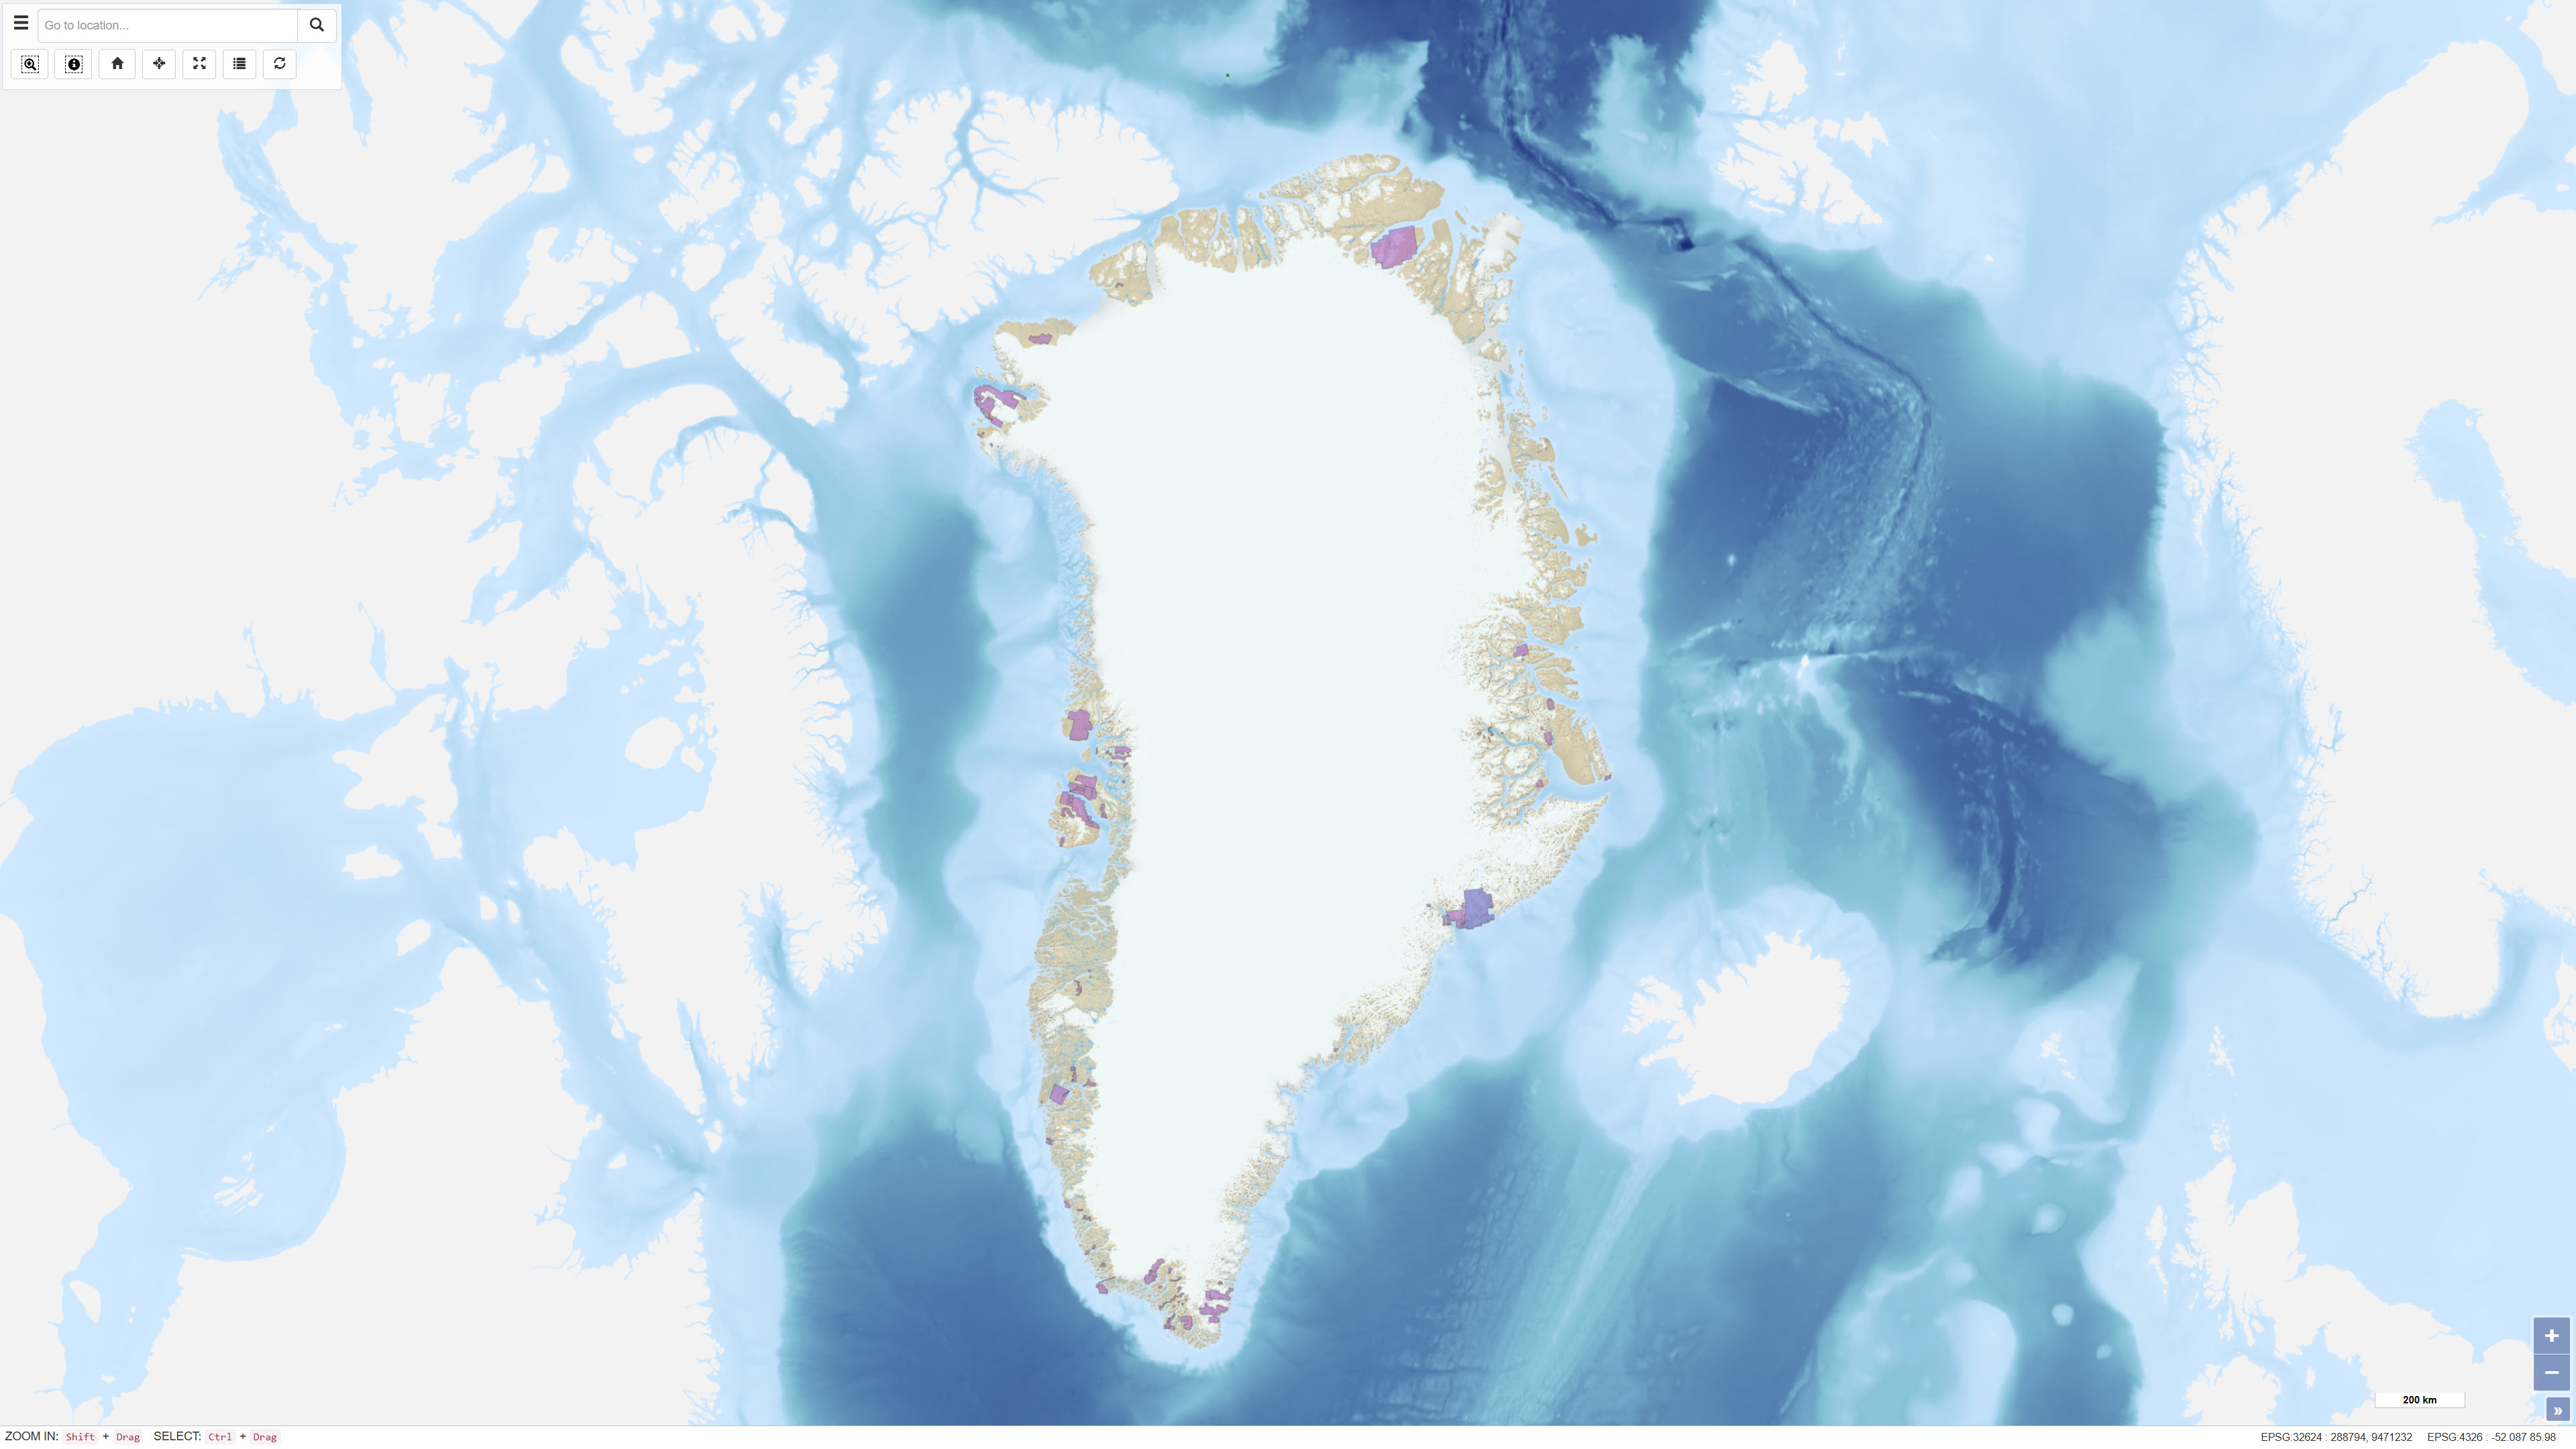
The dataset contains polygons representing active mineral exploration licences in Greenland. The data are based on geographic information provided via WFS by the Ministry of Mineral Resources in Greenland and are redistributed without modification of the original boundaries. The dataset provides an overview of areas where companies currently hold valid exploration licences.