 Arctic SDI catalogue
Natural risk zones
Type of resources
Categories
Available actions
Topics
Keywords
Contact for the resource
Provided by
Years
Formats
Representation types
Update frequencies
status
Service types
Scale
Resolution
-
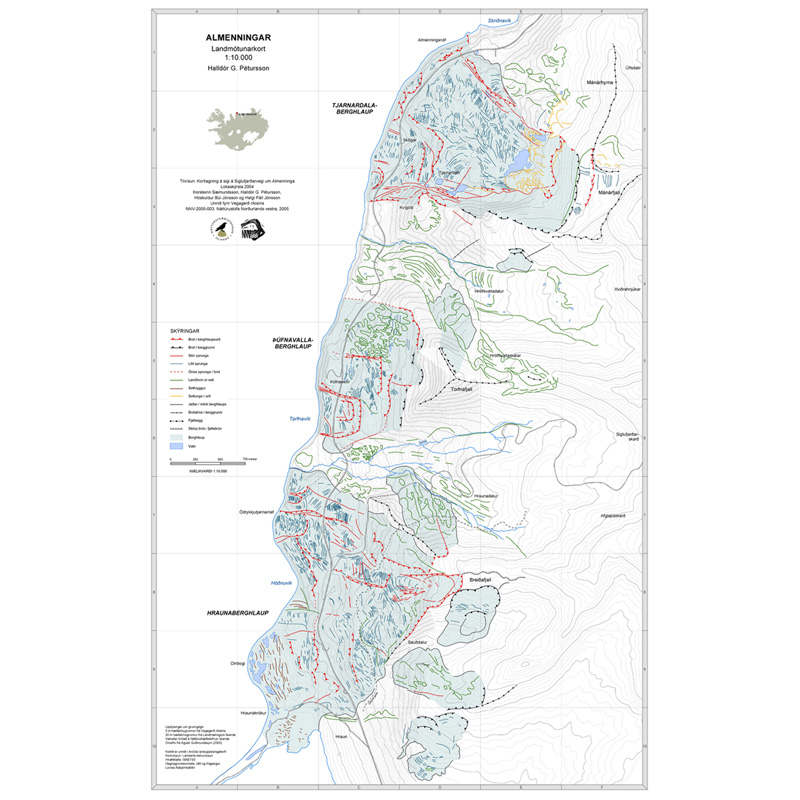
Gagnasafn (GDB) NI_J10v_AlmenningarLandmotun: Almenningar - Landmótunarkort – 1:10.000 [Almenningar – Geomorphological map – 1:10.000]. Rannsóknir á sighreyfingum á vegstæði Siglufjarðarvegar um Almenninga. Á svæðinu var kortlagt yfirborð og jarðlagaskipan lausra jarðlaga og berggrunnur kannaður. Bornar voru saman mæliniðurstöður Vegagerðarinnar á sighraða á vegstæðinu, veðurfarsgögn og ritaðar heimildir um sighreyfingar til að kanna orsakatengsl. Unnið fyrir Vegagerð ríkisins í samstarfi við Náttúrustofu Norðurlands vestra.
-
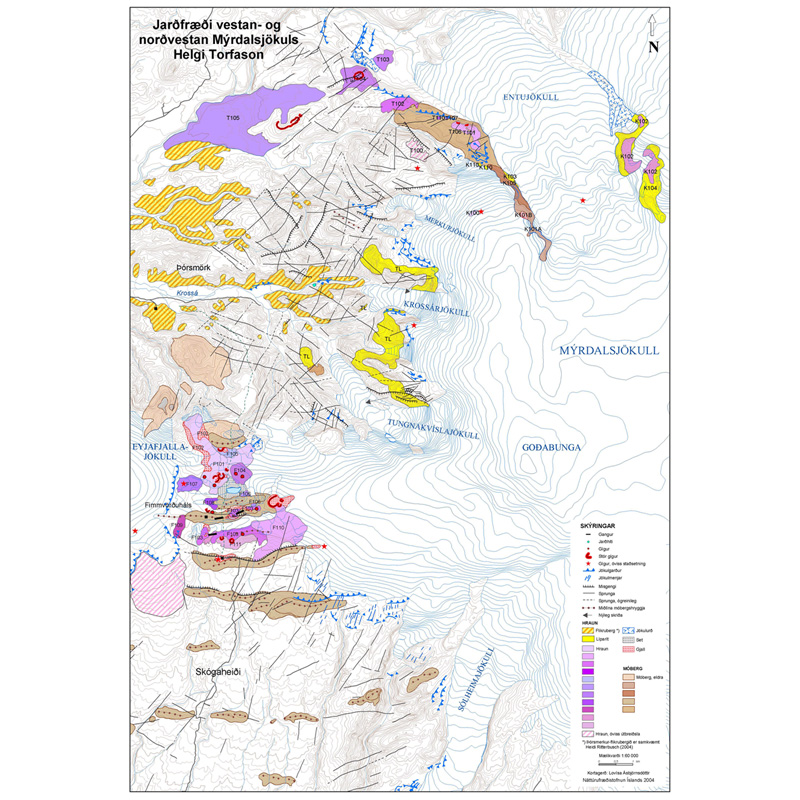
Gagnasafn (GDB) NI_J60v_MyrdalsjökullNV: Jarðfræði vestan og norðvestan Mýrdalsjökuls – 1:60.000 [Geology west and northwest of Myrdalsjokull – 1:60.000]. Kortið sýnir jarðfræði svæðisins frá Fimmvörðuhálsi norður í Entujökul. Kortlögð voru brot, gígar og hraun, ummerki eftir skriður og framhlaup, jökulgarðar og jökulmenjar. Kortið var unnið í tengslum við útgáfu Ríkislögreglustjóra 2005 "Hættumat vegna eldgosa og hlaupa frá vestanverðum Mýrdalsjökli og Eyjafjallajökli".
-
Change in the index for severe meteorological drought (3-month standardized precipitation-evapotranspiration index, SPEI3 < -1.5 standard deviations) at a 1x1 km spatial resolution. This index gives the difference in the frequency of severe meteorological drought during May, June, July, August and September between the reference period (1991-2020) and a future period. The first time step represents the future period 2041-2070, and the second time step represents the future period 2071-2100.
-
Change in the index for severe meteorological drought (3-month standardized precipitation-evapotranspiration index, SPEI3 < -1.5 standard deviations) at a 1x1 km spatial resolution. This index gives the difference in the frequency of severe meteorological drought during May, June, July, August and September between the reference period (1991-2020) and a future period. The first time step represents the future period 2041-2070, and the second time step represents the future period 2071-2100.
-
Change in the index for severe meteorological drought (3-month standardized precipitation-evapotranspiration index, SPEI3 < -1.5 standard deviations) at a 1x1 km spatial resolution. This index gives the difference in the frequency of severe meteorological drought during May, June, July, August and September between the reference period (1991-2020) and a future period. The first time step represents the future period 2041-2070, and the second time step represents the future period 2071-2100.
-
Change in the mean drought duration for 15. June through 15. October between the reference period (1991-2020) and a future period, at a 1x1 km spatial resolution. The first time step represents the future period 2041-2070, and the second time step represents the future period 2071-2100. Drought duration is defined as number of consecutive days with runoff below the 30th percentile from the flow duration curve for the reference period. The computation is based on smoothed daily runoff using the 11-day moving average procedure.
-
Change in the mean drought duration for 15. June through 15. October between the reference period (1991-2020) and a future period, at a 1x1 km spatial resolution. The first time step represents the future period 2041-2070, and the second time step represents the future period 2071-2100. Drought duration is defined as number of consecutive days with runoff below the 30th percentile from the flow duration curve for the reference period. The computation is based on smoothed daily runoff using the 11-day moving average procedure.
-
Change in the mean drought duration for 15. June through 15. October between the reference period (1991-2020) and a future period, at a 1x1 km spatial resolution. The first time step represents the future period 2041-2070, and the second time step represents the future period 2071-2100. Drought duration is defined as number of consecutive days with runoff below the 30th percentile from the flow duration curve for the reference period. The computation is based on smoothed daily runoff using the 11-day moving average procedure.
-
Mean drought duration for 15. June through 15. October for the period 1991-2020, at a 1x1 km spatial resolution. Drought duration represents hydrological drought and is defined as number of consecutive days with runoff below the 30th percentile from the flow duration curve for the reference period. The computation is based on smoothed daily runoff using the 11-day moving average procedure.
-
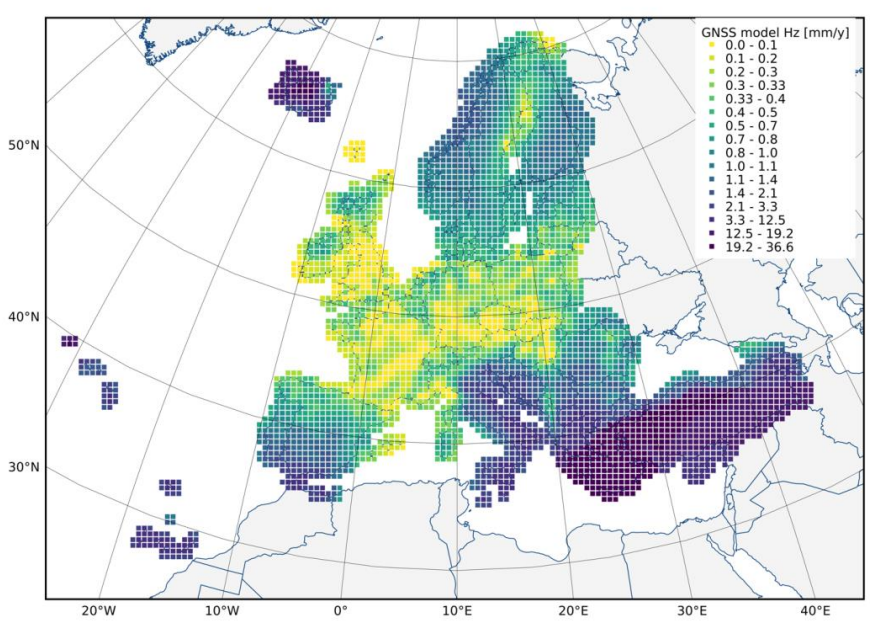
The European Ground Motion Service (EGMS) is a component of the Copernicus Land Monitoring Service. EGMS provides consistent, regular, standardised, harmonised and reliable information regarding natural and anthropogenic ground motion phenomena over the Copernicus Participating States and across national borders, with millimetre accuracy. This layer is produced based on GNSS data from various sources, with the EUREF Densification network as the main entry point. After filtering and quality control, a total of 3770 stations are used to generate the GNSS model which contains average velocities in east, north and up directions displayed on a 50-km grid. The grid dimension is determined by the average distance between well-maintained GNSS stations over continental Europe. The GNSS model is distributed to users in a single comma-separated values file. Each cell of the model is associated to a value of vertical and horizontal velocity. The product covers the Copernicus Participating States (except for DROMs) and United Kingdom.