 Arctic SDI catalogue
10000
Type of resources
Available actions
Topics
Keywords
Contact for the resource
Provided by
Years
Formats
Representation types
Update frequencies
status
Scale
Resolution
-
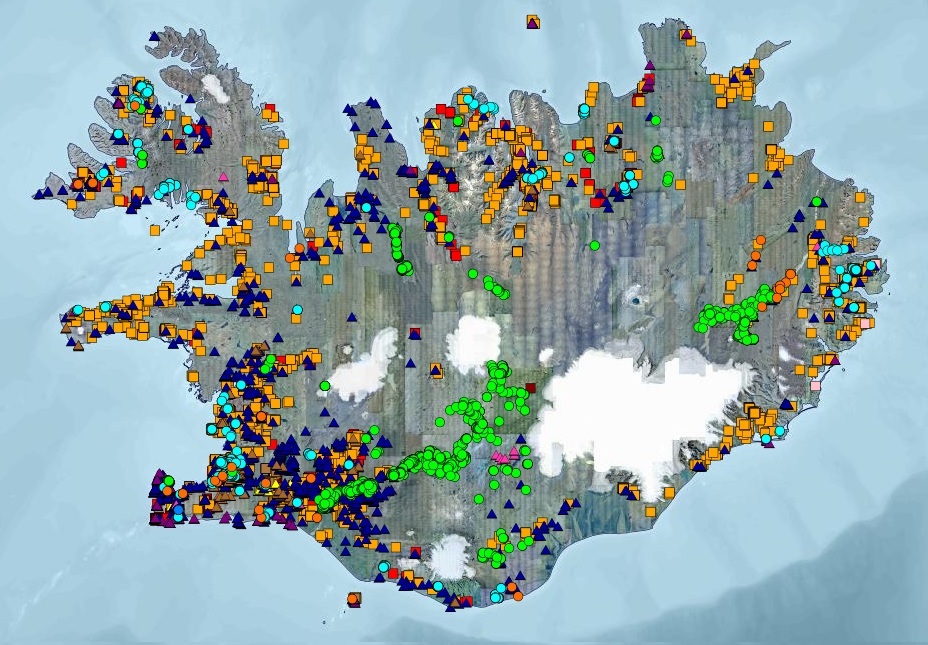
Gagnasett sem sýnir yfirlitsupplýsingar úr Borholugrunni Umhverfis- og orkustofnunar um borholur á Íslandi. Fram koma meðal annars: auðkennisnúmer borholu, borholunafn, staðarheiti, bortími, dýpi, sveitarfélag, eldra hreppsnafn, landnúmer, tilgangur og tegund borunar, bor og borfyrirtæki, staðsetningarhnit í ISN93 og WGS84, gæði hnita, fóðringardýpi og holuvídd. Í töflunni eru yfir 15.000 færslur. Upplýsingar úr gagnatöflunni eru bæði aðgengilegar á vefsíðu UOS og í Kortasjá UOS.
-
The dataset provides supporting groundwater depth values as a supplement to the mapping of potential groundwater flooding hazard areas in Denmark. The dataset shows the depth to the projected typical winter groundwater table in metres below terrain for the period 2071-2100 under the RCP8.5 emissions scenario. The depth values can be used to interpret and add detail to the potential hazard areas, including how close the groundwater table is expected to be to the terrain surface. The dataset is provided as raster data with a spatial resolution of 10 × 10 m.
-
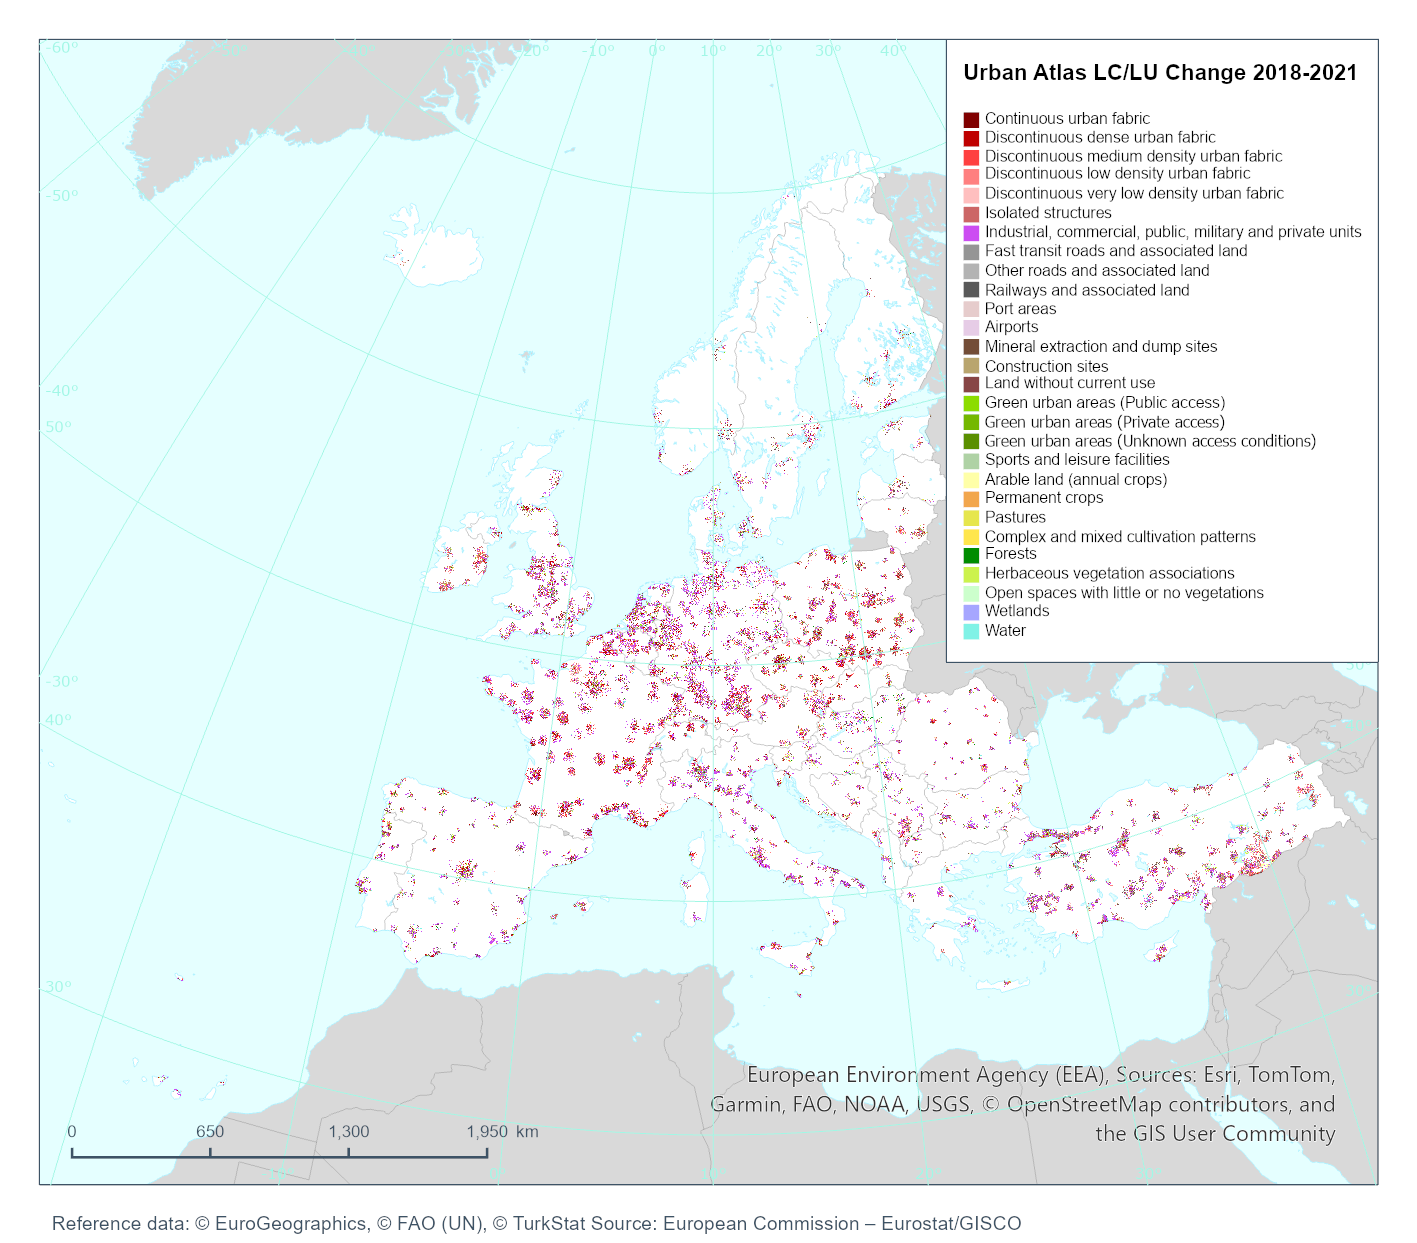
Urban Atlas Land Cover/Land Use Change 2018-2021 provides reliable, inter-comparable, high-resolution land use and land cover change data for 764 Functional Urban Areas (FUA) with more than 50,000 inhabitants for the 2021 reference year in EEA38 countries (EU, EFTA, Western Balkans countries, as well as Türkiye) and the United Kingdom.
-
The dataset shows mapped potential hazard areas for groundwater flooding in Denmark. It identifies areas that are potentially exposed to flooding from groundwater, based on a threshold corresponding to a median winter groundwater table of 1 m below terrain or less for the period 2071-2100 under the RCP8.5 emissions scenario. The dataset is provided as raster data with a spatial resolution of 10 × 10 m and forms part of the data basis for the national maps of potential groundwater hazard areas.
-

Urban Atlas Land Cover/Land Use 2018 provides reliable, inter-comparable, high-resolution land use and land cover data for 764 Functional Urban Areas (FUA) with more than 50,000 inhabitants for the 2018 reference year in EEA38 countries (EU, EFTA, Western Balkans countries, as well as Türkiye) and the United Kingdom.
-
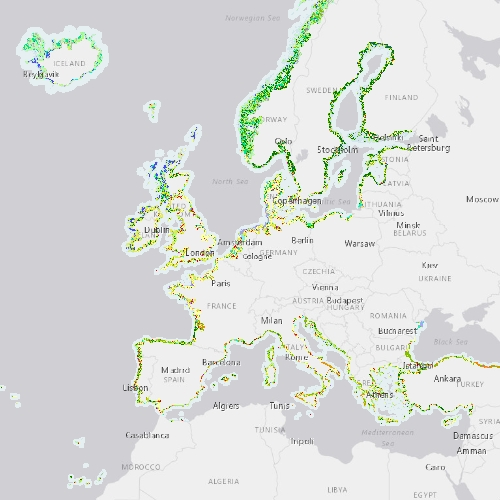
The Coastal Zones (CZ) LC/LU product for 2018 is providing a detailed Land Cover / Land Use (LC/ LU) dataset for areas along the coastline of the EEA38 countries and the United Kingdom, with reference year 2018 for the classification. This product monitors landscape dynamics in European coastal territory to an inland depth of 10 km with a total area of approximately 730,000 km², with all the relevant areas (estuaries, coastal lowlands, nature reserves). The production of the coastal zone layers was coordinated by the European Environment Agency (EEA) in the frame of the EU Copernicus programme, as part of the Copernicus Land Monitoring Service (CLMS) Local Component. The Coastal Zones product covers a buffer zone of coastline derived from EU-Hydro v1.1. Land Cover/Land Use (LC/LU) layer is extracted from Very High Resolution (VHR) satellite data and other available data. The class definitions follow the pre-defined nomenclature on the basis of Mapping and Assessment of Ecosystems and their Services (MAES) typology of ecosystems (Level 1 to Level 4) and CORINE Land Cover adapted to the specific characteristics of coastal zones. The classification provides 71 distinct thematic classes with a Minimum Mapping Unit (MMU) of 0.5 ha and a Minimum Mapping Width (MMW) of 10 m. The product is available for the 2012 and 2018 reference year including change mapping. This CZ dataset is distributed in vector format, in a single OGC GeoPackage SQLite file covering the area of interest.
-

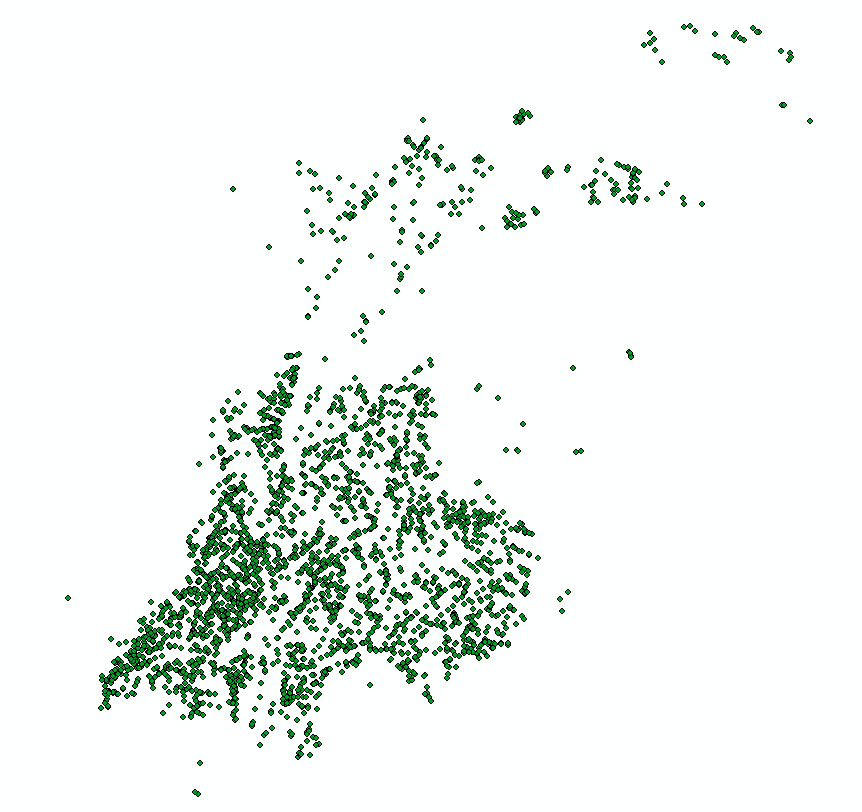
Spider species-level data collected from pan traps across four habitat types in Cambrige Bay Nunavut. Two wet habitat types and two dry habitat types were examined. Samples continuously taken from July 3rd to August 11th 2014, but broken down into sampling periods which are, on average, 6 days long.
-
Areas of special drinking water interest (OSD) are assigned the highest priority for drinking water supply. They are delineated according to criteria including future water demand, groundwater quality, natural protection, and the preservation of existing abstraction infrastructure. The spatial extent of OSD areas may be adjusted as new knowledge becomes available through fee-financed groundwater mapping under the Environmental Objectives Act § 8a. Within these areas and abstraction catchments for public waterworks, action plans are developed under Chapter 3 of the Water Supply Act. Areas of drinking water interest (OD) represent regions with groundwater of suitable quality for drinking water, primarily relevant for smaller utilities and local abstraction. The data are provided as a vector Dataset and are accessible via OGC web services. Source data are obtained from the Danish Environmental Protection Agency’s groundwater delineations (as of November 2022) and reflect the state of knowledge at publication time.
-
Nationellt skikt för länens brandflygsslingor. Detta är det officiella skiktet som förvaltas centralt och visas i karttjänster.
-
Uppgifter om undersökningslokaler för miljöövervakning och kalkningsverksamhet. Genomförda undersökningar på varje lokal. Information om pågående undersökningar, möjliggöra samordnad planering, mellan t.ex. recipientkontroll och kalkning