 Arctic SDI catalogue
Tides
Type of resources
Available actions
Topics
Keywords
Contact for the resource
Provided by
Formats
Representation types
Update frequencies
status
-

Description: The Regional Freshwater Index Layers dataset is composed of five single-band raster layers in GeoTIFF format. Each layer corresponds to a marine region, which generally coincide with the following layers from the Species Distribution Modelling Boundaries dataset: Nearshore_HG, Nearshore_NCC, Nearshore_QCS, Nearshore_WCVI, and Shelf_SalishSea. The main purpose of the dataset is to supplement existing layers that are used for species distribution modelling in the Pacific nearshore marine environment. Each regional freshwater index layer has the same spatial resolution and extent as other predictor layers for the corresponding region. While salinity layers exist from oceanographic models, they may not capture local difference from smaller scale rivers and streams entering the marine environment. Therefore, these layers are meant to complement salinity layers and are not suitable as a replacement for salinity data in species modelling. Methods: The cell values represent an estimate of freshwater influence on a 0-1 scale, where a higher value represents a greater level of freshwater influence. Details on how these values are determined is described in the supplemental information section of the metadata. The main data source for these derived products is the B.C. Freshwater Atlas, including the stream network and river polygons layers. Uncertainties: The values in the rasters are not a measure of salinity. The units are an index representing the level of freshwater influence weighted by the stream order and rescaled across regions on a 0-1 scale where only the region with the greatest value has a range of values 0-1 and the other regions are scaled relatively. This is done to ensure that values in one region can be compared to values in another region. As a result, some regions have very small values because the Salish Sea with the Fraser River is dominant, even after applying a rescale factor to the data.
-
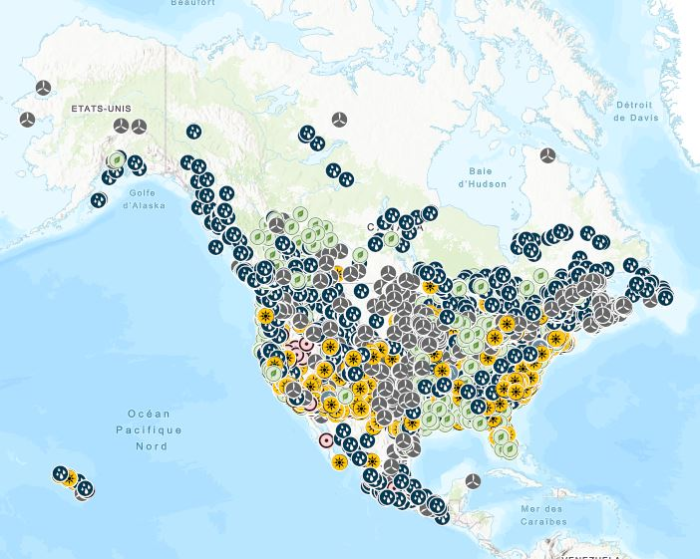
Stations containing prime movers, electric generators, and auxiliary equipment for converting mechanical, chemical into electric energy with an installed capacity of 1 Megawatt or more generated from renewable energy, including biomass, hydroelectric, pumped-storage hydroelectric, geothermal, solar, and wind. Mapping Resources implemented as part of the North American Cooperation on Energy Information (NACEI) between the Department of Energy of the United States of America, the Department of Natural Resources of Canada, and the Ministry of Energy of the United Mexican States. The participating Agencies and Institutions shall not be held liable for improper or incorrect use of the data described and/or contained herein. These data and related graphics, if available, are not legal documents and are not intended to be used as such. The information contained in these data is dynamic and may change over time and may differ from other official information. The Agencies and Institutions participants give no warranty, expressed or implied, as to the accuracy, reliability, or completeness of these data. Parent Collection: [North American Cooperation on Energy Information, Mapping Data](https://open.canada.ca/data/en/dataset/aae6619f-f9f3-435d-bc32-42decd58b674)
-

Canadian tides and water level station information, benchmarks, observed water level data, and tidal predictions. The Canadian tide and water level data archive presently holds water level observations reported from over a thousand stations, with the earliest dating back to 1848. The number of observations spans on average 6 years per station, with 60 stations measuring water levels for over 50 years. Over 800 stations are subjected to appreciable effect of tides, and for most of these stations, the Canadian Hydrographic Service (CHS) calculates and publishes predictions of the water levels associated with the vertical movement of the tide. Observations from the CHS Permanent Water Level Network are added on a daily to monthly basis. Data are also exchanged annually with the Water Survey of Canada. Each point in the map represents a station with links to observations, tidal predictions, and benchmark information, where available.
-

The Coastal Ice Ocean Prediction System (CIOPS) provides a 48 hour ocean and ice forecast over different domains (East, West, Salish Sea) four times a day at 1/36° resolution. A pseudo-analysis component is forced at the ocean boundaries by the Regional Ice Ocean Prediction System (RIOPS) forecasts and spectrally nudged to the RIOPS solution in the deep ocean. Fields from the pseudo-analysis are used to initialize the 00Z forecast, whilst the 06, 12 and 18Z forecasts use a restart files saved at hour 6 from the previous forecast. The atmospheric fluxes for both the pseudo-analysis and forecast components are provided by the High Resolution Deterministic Prediction System (HRDPS) blended both spatially and temporally with either the Global Deterministic Prediction System (GDPS) (for CIOPS-East) or an uncoupled component of the Global Deterministic Prediction System (GDPS) at 10km horizontal resolution (for CIOPS-West) for areas not covered by the HRDPS.
-
The Costal Flooding Risk Index in GeoJSON format is a geo and time referenced polygon product issued by the Meteorological Service of Canada (MSC) to articulate the coastal flooding risk, impact and probability. Products are issued daily by Storm Prediction Centres and intended to provide early notification, out to 5 days, of coastal flooding due to astronomical tide, storm surge and wave impacts.
-

The Coastal Ice Ocean Prediction System (CIOPS) provides a 48 hour ocean and ice forecast over different domains (East, West, Salish Sea) four times a day at 1/36° resolution. A pseudo-analysis component is forced at the ocean boundaries by the Regional Ice Ocean Prediction System (RIOPS) forecasts and spectrally nudged to the RIOPS solution in the deep ocean. Fields from the pseudo-analysis are used to initialize the 00Z forecast, whilst the 06, 12 and 18Z forecasts use a restart files saved at hour 6 from the previous forecast. The atmospheric fluxes for both the pseudo-analysis and forecast components are provided by the High Resolution Deterministic Prediction System (HRDPS) blended both spatially and temporally with either the Global Deterministic Prediction System (GDPS) (for CIOPS-East) or an uncoupled component of the Global Deterministic Prediction System (GDPS) at 10km horizontal resolution (for CIOPS-West) for areas not covered by the HRDPS.
-

The Coastal Ice Ocean Prediction System (CIOPS) provides a 48 hour ocean and ice forecast over different domains (East, West, Salish Sea) four times a day at 1/36° resolution. A pseudo-analysis component is forced at the ocean boundaries by the Regional Ice Ocean Prediction System (RIOPS) forecasts and spectrally nudged to the RIOPS solution in the deep ocean. Fields from the pseudo-analysis are used to initialize the 00Z forecast, whilst the 06, 12 and 18Z forecasts use a restart files saved at hour 6 from the previous forecast. The atmospheric fluxes for both the pseudo-analysis and forecast components are provided by the High Resolution Deterministic Prediction System (HRDPS) blended both spatially and temporally with either the Global Deterministic Prediction System (GDPS) (for CIOPS-East) or an uncoupled component of the Global Deterministic Prediction System (GDPS) at 10km horizontal resolution (for CIOPS-West) for areas not covered by the HRDPS.