 Arctic SDI catalogue
GEOJSON
Type of resources
Available actions
Topics
Keywords
Contact for the resource
Provided by
Formats
Representation types
Update frequencies
status
-
The Costal Flooding Risk Index in GeoJSON format is a geo and time referenced polygon product issued by the Meteorological Service of Canada (MSC) to articulate the coastal flooding risk, impact and probability. Products are issued daily by Storm Prediction Centres and intended to provide early notification, out to 5 days, of coastal flooding due to astronomical tide, storm surge and wave impacts.
-

MetNotes are a geo- and time-referenced, free form polygon product issued by MSC that complement today's location-based dissemination systems. The concise text of a MetNote (similar to a Tweet) is consistent with communication today where people are seeking information at a glance. Meteorologists will issue a MetNote to add contextual and/or impact information to complement the public forecast that is valid over a specific area, for a specific time range.
-

A station is a site on a river or lake where water quantity (water level and flow) are collected and recorded.
-
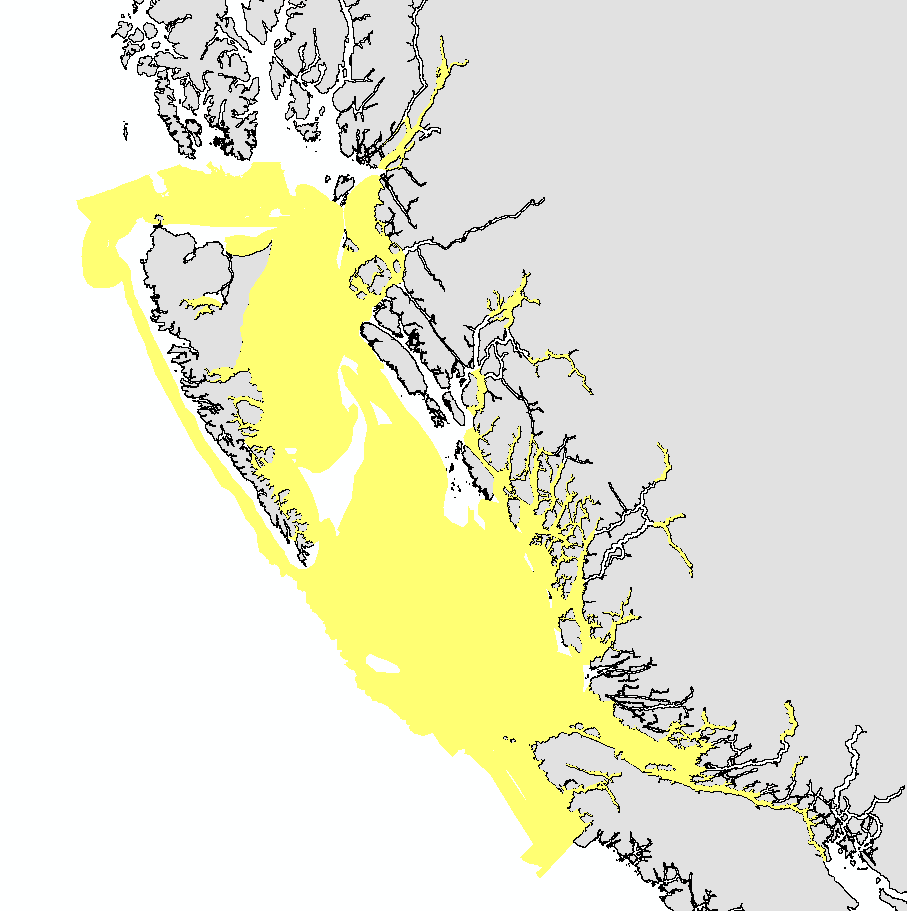
This layer details Important Areas (IAs) relevant to important geographic features in the Pacific North Coast Integrated Management Area (PNCIMA). This data was mapped to inform the selection of marine Ecologically and Biologically Significant Areas (EBSA). Experts have indicated that these areas are relevant based upon their high ranking in one or more of three criteria (Uniqueness, Aggregation, and Fitness Consequences). The distribution of IAs within ecoregions is used in the designation of EBSAs. Canada’s Oceans Act provides the legislative framework for an integrated ecosystem approach to management in Canadian oceans, particularly in areas considered ecologically or biologically significant. DFO has developed general guidance for the identification of ecologically or biologically significant areas. The criteria for defining such areas include uniqueness, aggregation, fitness consequences, resilience, and naturalness. This science advisory process identifies proposed EBSAs in Canadian Pacific marine waters, specifically in the Strait of Georgia (SOG), along the west coast of Vancouver Island (WCVI, southern shelf ecoregion), and in the Pacific North Coast Integrated Management Area (PNCIMA, northern shelf ecoregion). Initial assessment of IA's in PNCIMA was carried out in September 2004 to March 2005 with spatial data collection coordinated by Cathryn Clarke. Subsequent efforts in WCVI and SOG were conducted in 2009, and may have used different scientific advisors, temporal extents, data, and assessment methods. WCVI and SOG IA assessment in some cases revisits data collected for PNCIMA, but should be treated as a separate effort. Other datasets in this series detail IAs for birds, cetaceans, coral and sponges, fish, invertebrates, and other vertebrates. Though data collection is considered complete, the emergence of significant new data may merit revisiting of IA's on a case by case basis.
-

This layer details Important Areas (IAs) relevant to key vertebrate species, other than fish and cetaceans, in the West Coast Vancouver Island (WCVI) ecoregion. This data was mapped to inform the selection of marine Ecologically and Biologically Significant Areas (EBSA). Experts have indicated that these areas are relevant based upon their high ranking in one or more of three criteria (Uniqueness, Aggregation, and Fitness Consequences). The distribution of IAs within ecoregions is used in the designation of EBSAs. Canada’s Oceans Act provides the legislative framework for an integrated ecosystem approach to management in Canadian oceans, particularly in areas considered ecologically or biologically significant. DFO has developed general guidance for the identification of ecologically or biologically significant areas. The criteria for defining such areas include uniqueness, aggregation, fitness consequences, resilience, and naturalness. This science advisory process identifies proposed EBSAs in Canadian Pacific marine waters, specifically in the Strait of Georgia (SOG), along the west coast of Vancouver Island (WCVI, southern shelf ecoregion), and in the Pacific North Coast Integrated Management Area (PNCIMA, northern shelf ecoregion). Initial assessment of IAs in PNCIMA was carried out in September 2004 to March 2005 with spatial data collection coordinated by Cathryn Clarke. Subsequent efforts in WCVI and SOG were conducted in 2009, and may have used different scientific advisors, temporal extents, data, and assessment methods. WCVI and SOG IA assessment in some cases revisits data collected for PNCIMA, but should be treated as a separate effort. Other datasets in this series detail IAs for birds, cetaceans, coral and sponges, fish, geographic features, and invertebrates. Though data collection is considered complete, the emergence of significant new data may merit revisiting of IAs on a case by case basis.
-

Standard fire hydrant v1**This third party metadata element was translated using an automated translation tool (Amazon Translate).**
-
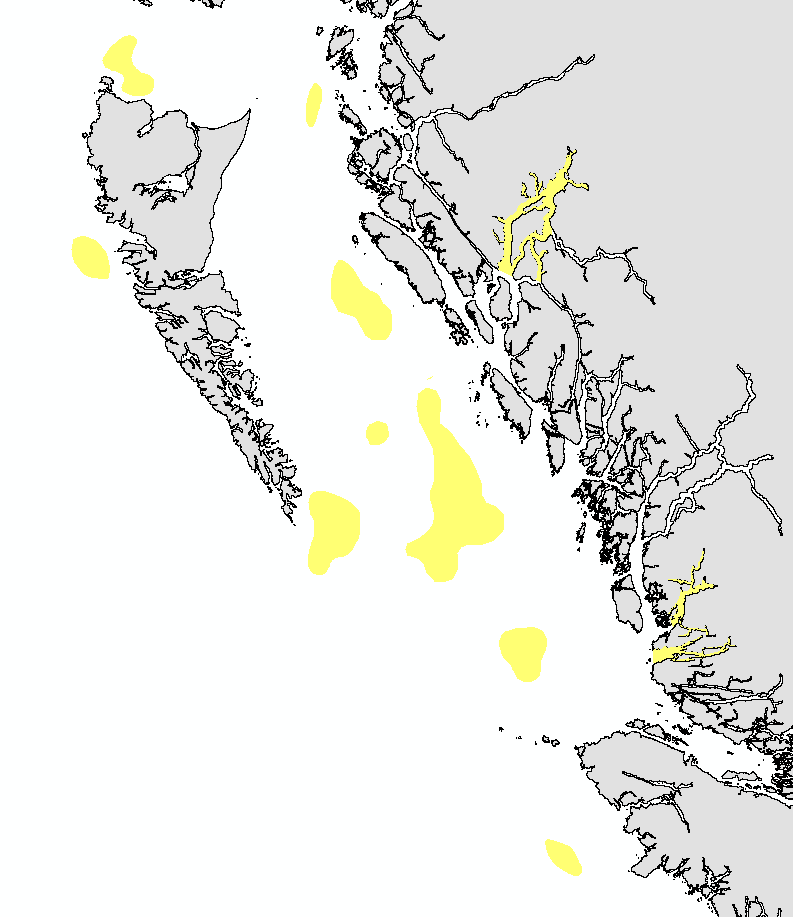
This layer details Important Areas (IAs) relevant to coral, sponge, and reef-building species in the Pacific North Coast Integrated Management Area (PNCIMA). This data was mapped to inform the selection of marine Ecologically and Biologically Significant Areas (EBSA). Experts have indicated that these areas are relevant based upon their high ranking in one or more of three criteria (Uniqueness, Aggregation, and Fitness Consequences). The distribution of IAs within ecoregions is used in the designation of EBSAs. Canada’s Oceans Act provides the legislative framework for an integrated ecosystem approach to management in Canadian oceans, particularly in areas considered ecologically or biologically significant. DFO has developed general guidance for the identification of ecologically or biologically significant areas. The criteria for defining such areas include uniqueness, aggregation, fitness consequences, resilience, and naturalness. This science advisory process identifies proposed EBSAs in Canadian Pacific marine waters, specifically in the Strait of Georgia (SOG), along the west coast of Vancouver Island (WCVI, southern shelf ecoregion), and in the Pacific North Coast Integrated Management Area (PNCIMA, northern shelf ecoregion). Initial assessment of IAs in PNCIMA was carried out in September 2004 to March 2005 with spatial data collection coordinated by Cathryn Clarke. Subsequent efforts in WCVI and SOG were conducted in 2009, and may have used different scientific advisors, temporal extents, data, and assessment methods. WCVI and SOG IA assessment in some cases revisits data collected for PNCIMA, but should be treated as a separate effort. Other datasets in this series detail IAs for birds, cetaceans, fish, geographic features, invertebrates, and other vertebrates. Though data collection is considered complete, the emergence of significant new data may merit revisiting of IAs on a case by case basis.
-

Geometry of municipal sectors as defined in the 2013 Origin-Destination Survey in GeoJSON format. Allows you to map the matrix data of the OD Survey.**This third party metadata element was translated using an automated translation tool (Amazon Translate).**
-
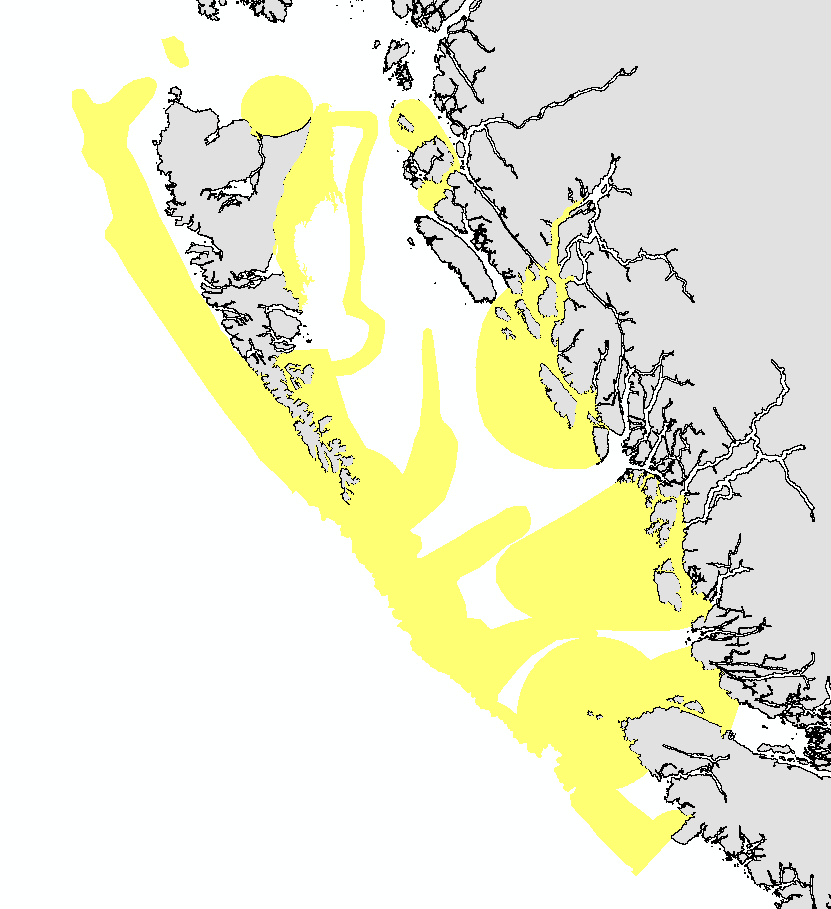
This layer details Important Areas (IAs) relevant to key fish species in the Pacific North Coast Integrated Management Area (PNCIMA). This data was mapped to inform the selection of marine Ecologically and Biologically Significant Areas (EBSA). Experts have indicated that these areas are relevant based upon their high ranking in one or more of three criteria (Uniqueness, Aggregation, and Fitness Consequences). The distribution of IAs within ecoregions is used in the designation of EBSAs. Canada’s Oceans Act provides the legislative framework for an integrated ecosystem approach to management in Canadian oceans, particularly in areas considered ecologically or biologically significant. DFO has developed general guidance for the identification of ecologically or biologically significant areas. The criteria for defining such areas include uniqueness, aggregation, fitness consequences, resilience, and naturalness. This science advisory process identifies proposed EBSAs in Canadian Pacific marine waters, specifically in the Strait of Georgia (SOG), along the west coast of Vancouver Island (WCVI, southern shelf ecoregion), and in the Pacific North Coast Integrated Management Area (PNCIMA, northern shelf ecoregion). Initial assessment of IA's in PNCIMA was carried out in September 2004 to March 2005 with spatial data collection coordinated by Cathryn Clarke. Subsequent efforts in WCVI and SOG were conducted in 2009, and may have used different scientific advisors, temporal extents, data, and assessment methods. WCVI and SOG IA assessment in some cases revisits data collected for PNCIMA, but should be treated as a separate effort. Other datasets in this series detail IAs for birds, cetaceans, coral and sponges, geographic features, invertebrates, and other vertebrates. Though data collection is considered complete, the emergence of significant new data may merit revisiting of IA's on a case by case basis. This package also includes project documentation and tech reports relevant to the IA process and its role within the selection of EBSAs.
-

Polyline layer of snowshoeing trails in the territory of the city of Shawinigan. ! [Shawinigan logo] (https://jmap.shawinigan.ca/doc/photos/LogoShawinigan.jpg) **Collection method** Scanning from orthophotography **Attributes** * `objective` (`OID`): * `association_name` (`String`): Association * `location` (`String`): Location * `sector` (`String`): Sector * `circuit` (`String`): Number * `Circuit_name` (`String`): Name * `problem` (`String`): Difficulty * `Kilometers` (`Double`): Mileage * `st_length (shape) `(`Double`): Length For more information, consult the metadata on the Isogeo catalog (OpenCatalog link).**This third party metadata element was translated using an automated translation tool (Amazon Translate).**