 Arctic SDI catalogue
Turbidity
Type of resources
Available actions
Topics
Keywords
Contact for the resource
Provided by
Formats
Representation types
Update frequencies
status
-

This product provides the median of monthly maximum turbidity values (in nephelometric turbidity units) for drinking water facilities by drainage region. Turbidity refers to the relative cloudiness of water, caused by suspended particles in water. The Survey of Drinking Water Plants collected this monthly maximum turbidity data for surface water sources from facilities reporting turbidity data for at least 10 months in 2013. These facilities served 24 million people and produced 4,091 million cubic metres of potable water from surface water sources in 2013. Source water turbidity was monitored continuously at 42% of these drinking water plants in 2013, daily at 34% of plants and less frequently at the remaining plants.
-

A chlorophyll fluorescence time series was collected at various locations around the coast of Vancouver Island, British Columbia, Canada for monitoring phytoplankton concentrations. A Wetlabs ECO fluorometer was deployed every few months on a schedule depending on season and sensor availability. The instrument hung by a chain attached to the side of the buoy, or dock, depending on location, and measured chlorophyll using the fluorescence emission at 695nm. The instrument also measured turbidity by detecting the scattered light at 700nm. The units had internal batteries and data storage and were programmed to make a group of 5 measurements every 30 minutes. A copper wiper covered the sampling window between groups of measurements to reduce fouling. Times are in UTC unless otherwise stated.
-

Moored instrument time series data include current velocity, temperature, salinity, oxygen, fluorescence, transmissivity, turbidity, and particle capture of carbon, nitrogen, and silicon. Also included are sediment trap, ice drift and ice draft data. These data were collected by researchers from the Institute of Ocean Sciences, Sidney, BC, from locations ranging from the Beaufort Sea, and across the Canadian Arctic Archipelago to Baffin Bay. The data links below are only a representative sample of the entire collection. If you require more data, please send your request to the data contact.
-

Moored instrument time series data include current velocity, temperature, salinity, oxygen, fluorescence, transmissivity, turbidity, sediment trap data and particle capture of carbon, nitrogen, and silicon. These data were collected by researchers from the Institute of Ocean Sciences, Sidney, BC, from locations in the North Pacific. The data links below are only a representative sample of the entire collection. If you require more data, please send your request to the data contact.
-

A geospatial database involving 130 descriptors was created describing the pelagic and benthic habitats of the 0–30 m surface layer in the estuary and Gulf of St. Lawrence. A grid made of 6.25 km² cells (2.5 x 2.5 km) was used to aggregate the data. Each of the 39,337 cells overlapping the marine environment was characterized using landscape, hydrographic, and oceanographic parameters determined from observations (including satellite imagery), a 3D circulation model, and published and unpublished material available at local and regional scales. Purpose The dataset provides useful information on the spatial extent of major coastal epipelagic habitats in the study area and can be used for mapping purposes and for analyses of species-habitat relationships. Additional Information The low tide limit was taken as the upper (0 m) boundary, but neighbouring landscape features, such as the proximity to freshwater inflows, surface area of the tidal zone, and characteristics of the shoreline, were also taken into consideration. Also, each cell was classified as being marine, intertidal, or terrestrial using the high and low tide marks. Those marks were determined using NRCan CANVEC topographic map products (1:50,000). The high tide mark was determined as the limit between the land and water layers. The low tide mark (0 m depth) was determined as the lower limit of the tidal zone in areas with a tidal zone, and as the limit between the land and water layers elsewhere. See the report mentioned below for a more detailed description of the treatments for each variable: Dutil, J.-D., S. Proulx, P. Galbraith, J. Chassé and N. Lambert 2012. Coastal and epipelagic habitats of the St. Lawrence estuary and Gulf. Can. Tech. Rep. Fish. Aquat. Sci. 3009 : ix +87 pp.
-

For several years, Fisheries and Oceans Canada (DFO) has conducted annual ship-based surveys in the St. Lawrence Estuary and the Gulf of St. Lawrence to assess environmental conditions and support a range of scientific objectives. Because these surveys do not extend into winter, a complementary regional monitoring program has been implemented annually in early March since 1996. This monitoring program is typically carried out using a Canadian Coast Guard helicopter, although in 2016 and 2017 it was conducted aboard an icebreaker. The winter survey measures physical oceanographic conditions to approximately 200 m depth along with nutrient concentrations in the surface layer. Starting in 2023, the survey was expanded to include phytoplankton measurements. Data from this program are integrated with those from the Atlantic Zone Monitoring Program (AZMP) to produce annual reports including physical (CTD) and biological (bottle) assessments and a Zonal Scientific Advisory for the Gulf of St. Lawrence which can be found on the following webpage under the given year : Atlantic Zone Monitoring Program (AZMP) - https://www.dfo-mpo.gc.ca/science/data-donnees/azmp-pmza/index-eng.html Here, raw data on physical oceanographic conditions, nutrient concentrations and phytoplankton collected during the winter survey are presented. This publication contains three data files: ‘donnees_data_heli_CTD’ which contains links per year to the CTD data, ‘donnees_data_heli_bottle_bouteille’, which contains nutrient data, and ‘donnees_data_heli_phyto’ which contains phytoplankton data. The dataset covers the period of 1996 to present and is updated annually as new data becomes available. Note: this publication contains raw data, please use with caution or contact the data management team (gddaiss-dmsaisb@dfo-mpo.gc.ca) if you have any questions. For further methodological information please see the supporting document for citations. For mean winter surface conditions in the Estuary and Gulf of St. Lawrence please see the following related publication Winter surface conditions – Helicopter survey - Open Government Portal - https://open.canada.ca/data/en/dataset/9a42d891-fc9c-44b3-8fba-9d9ed96890cf
-
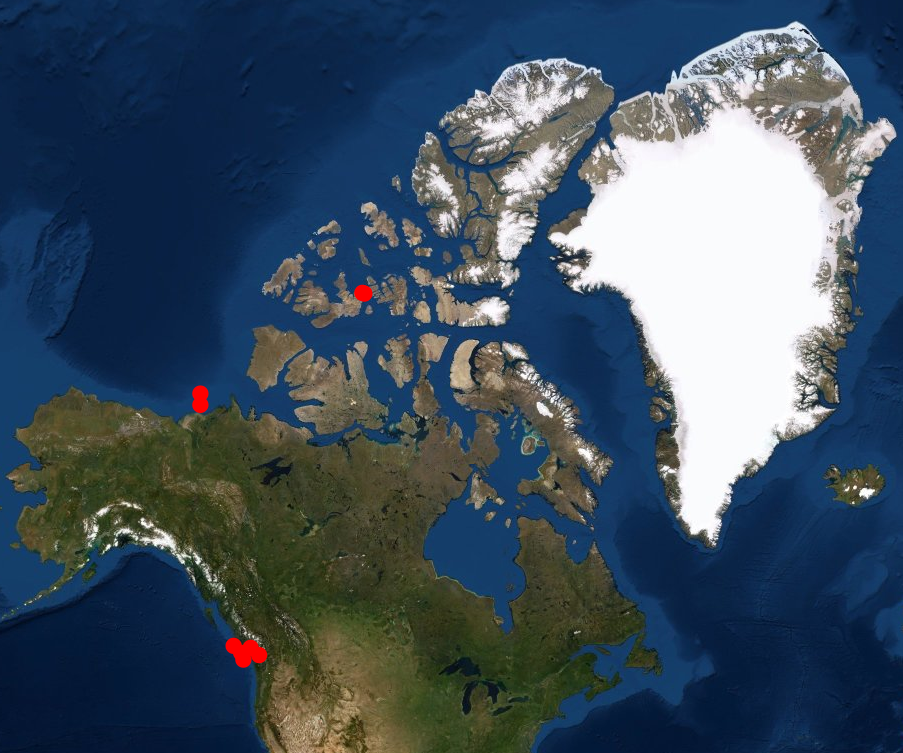
Moored instrument time series data include current velocity, temperature, salinity, oxygen, fluorescence, transmissivity, turbidity, and particle capture of carbon, nitrogen, and silicon as well as sediment trap, ice drift and ice draft data. These data were collected by researchers from the Institute of Ocean Sciences, Sidney, BC, from locations ranging from the North Pacific, the Beaufort Sea, and across the Canadian Arctic Archipelago to Baffin Bay.