 Arctic SDI catalogue
Vent
Type of resources
Available actions
Keywords
Contact for the resource
Provided by
Years
Representation types
Update frequencies
status
Service types
-
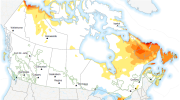
Version 2 of the Canadian homogenized wind speed (CanHomW V2) datasets contain homogenized monthly and daily mean wind speed data series for the period 1953-2023 for 154 long-term stations in Canada. As detailed in Wang et al. (2025), the monthly dataset (CanHomW mlyV2) was produced using a modified version of the comprehensive semi-automatic changepoint detection procedure developed by Wang et al. (2023), which includes homogeneity testing with and without using a reference series. To produce the homogenized daily wind speed dataset (CanHomW dlyV2), daily wind speed data series were tested to find the most probable day of an artificial change detected in the corresponding monthly data series whenever the exact date of change in the daily series is undocumented. The Twentieth Century Reanalysis 20CRv3 ensemble-mean series of monthly wind speeds (Slivinski et al., 2019), 49 monthly mean geostrophic wind speeds derived from surface pressure data, and up to four nearest stations’ data series were used as reference in the homogeneity tests. However, no reference was used to adjust the data series to diminish the detected inhomogeneities. This is because the density of long-term wind observing stations in Canada is too low to find a representative reference series to use for estimating reliable adjustments to homogenize the data series. A modified version of the quantile matching (QM) adjustment method with no reference (Wang et al. 2010) was used to homogenize the data series. The QM method adjusts the whole distribution of the data in one segment to match another, rather than just adjust the mean. The modifications here include an approach to prevent having unphysical negative values in the homogenized wind speed series (see Wang et al. 2025 for more details). Despite the higher uncertainty arising from applying adjustments estimated without using a reference series, compared to when applying adjustments estimated using a representative reference series (if such a reference were available), this is the best (i.e., most usable for trend assessment) Canadian homogenized wind speeds dataset that has been produced to date. For transparency and traceability, the raw (original/unhomogenized) data series along with the station joining information are included in the CanHomW datasets. Trends in the raw and homogenized data are analyzed and discussed in Wang et al. (2025). References: Wang, X.L., Y. Feng, V. Isaac, F. W. Zwiers, L. A., Vincent, and M. Hartwell, 2025: Observed Surface Wind Speed Trends Inferred from Homogenized in Situ Data and Reanalysis Datasets. Atmosphere-Ocean iFirst article, 2025, 1-17, https://doi.org/10.1080/07055900.2025.2570920. Wang, X.L, Y. Feng, V. Y. S. Cheng, H. Xu, 2023: Observed precipitation trends inferred from Canada’s homogenized monthly precipitation dataset, J. Clim., 36, 7957-7971. DOI: 10.1175/JCLI-D-23-0193.1. Wang, X. L., Chen, H., Wu, Y., Feng, Y., & Pu, Q. (2010). New Techniques for the Detection and Adjustment of Shifts in Daily Precipitation Data Series. Journal of Applied Meteorology and Climatology, 49(12), 2416–2436. https://doi.org/10.1175/2010JAMC2376.1. Slivinski, L. and coauthors, 2019: Towards a more reliable historical reanalysis: Improvements for version 3 of the Twentieth Century Reanalysis system. Q. J. R. Meteor. Soc., 2876-2908, https://doi.org/10.1002/qj.3598.
-

The probability of the drying days occurring during the forecast period with an average wind speed greater than 30 km/h and a maximum temperature above 30°C (drying_prob). Week 1 and week 2 forecasted probability is available daily from September 1 to August 31. Week 3 and week 4 forecasted probability is available weekly (Thursday) from September 1 to August 31. Winds can significantly influence crop growth and yield mainly due to mechanical damage of plant vegetative and reproductive organs, an imbalance of plant-soil-atmosphere water relationships, and pest and disease distributions in agricultural fields. The maximum wind speed and the number of strong wind days over the forecast period represent short term and extended strong wind events respectively. Agriculture and Agri-Food Canada (AAFC) and Environment and Climate Change Canada (ECCC) have together developed a suite of extreme agrometeorological indices based on four main categories of weather factors: temperature, precipitation, heat, and wind. The extreme weather indices are intended as short-term prediction tools and generated using ECCC’s medium range forecasts to create a weekly index product on a daily and weekly basis.
-

This dataset includes five depth-attenuated relative wave exposure index layers in raster format. Relative Exposure Index (REI) values are calculated based on effective fetch (derived from fetch values) combined with modelled wind data. The output REI layers are attenuated by depth, resulting in greater values in shallow, nearshore areas (Bekkby et al. 2008). The cell values represent an estimate of wave exposure at bottom depth normalized between regions from 0 (protected) to 1 (exposed). The objective of this dataset is to provide an estimate of wave exposure at bottom depth, primarily for use in species distribution modelling. Each single-band raster corresponds to a marine region, which generally coincide with the following layers from the Species Distribution Modelling Boundaries (https://www.gis-hub.ca/dataset/sdm-boundaries) dataset: Nearshore_HG, Nearshore_NCC, Nearshore_QCS, Nearshore_QCS, and Shelf_SalishSea. These layers extend to 50 m depth and up to 5 km from shore. Tabular data (csv files) are also included as part of the data package. These data are the calculated Relative Exposure Index (REI) values with fields for position information. The fetch values from gridded nearshore fetch (https://gis-hub.ca/dataset/gridded-nearshore-fetch) are used as a source dataset and the locations in the REI are the same as the gridded fetch.
-

The probability of maximum wind above 50km/h (mdws50_prob). Week 1 and week 2 forecasted probability is available daily from September 1 to August 31. Week 3 and week 4 forecasted probability is available weekly (Thursday) from September 1 to August 31. Winds can significantly influence crop growth and yield mainly due to mechanical damage of plant vegetative and reproductive organs, an imbalance of plant-soil-atmosphere water relationships, and pest and disease distributions in agricultural fields. The maximum wind speed and the number of strong wind days over the forecast period represent short term and extended strong wind events respectively. Agriculture and Agri-Food Canada (AAFC) and Environment and Climate Change Canada (ECCC) have together developed a suite of extreme agrometeorological indices based on four main categories of weather factors: temperature, precipitation, heat, and wind. The extreme weather indices are intended as short-term prediction tools and generated using ECCC’s medium range forecasts to create a weekly index product on a daily and weekly basis.
-
The number of days during the forecast period with an average wind speed greater than 30 km/h (nswd_prob). Week 1 and week 2 forecasted probability is available daily from September 1 to August 31. Week 3 and week 4 forecasted probability is available weekly (Thursday) from September 1 to August 31. Winds can significantly influence crop growth and yield mainly due to mechanical damage of plant vegetative and reproductive organs, an imbalance of plant-soil-atmosphere water relationships, and pest and disease distributions in agricultural fields. The maximum wind speed and the number of strong wind days over the forecast period represent short term and extended strong wind events respectively. Agriculture and Agri-Food Canada (AAFC) and Environment and Climate Change Canada (ECCC) have together developed a suite of extreme agrometeorological indices based on four main categories of weather factors: temperature, precipitation, heat, and wind. The extreme weather indices are intended as short-term prediction tools and generated using ECCC’s medium range forecasts to create a weekly index product on a daily and weekly basis.
-

The number of days during the forecast period with an average wind speed greater than 30 km/h (nswd). Week 1 and week 2 forecasted index is available daily from September 1 to August 31. Week 3 and week 4 forecasted index is available weekly (Thursday) from September 1 to August 31. Winds can significantly influence crop growth and yield mainly due to mechanical damage of plant vegetative and reproductive organs, an imbalance of plant-soil-atmosphere water relationships, and pest and disease distributions in agricultural fields. The maximum wind speed and the number of strong wind days over the forecast period represent short term and extended strong wind events respectively. Agriculture and Agri-Food Canada (AAFC) and Environment and Climate Change Canada (ECCC) have together developed a suite of extreme agrometeorological indices based on four main categories of weather factors: temperature, precipitation, heat, and wind. The extreme weather indices are intended as short-term prediction tools and generated using ECCC’s medium range forecasts to create a weekly index product on a daily and weekly basis.
-

The number of days during the forecast period with an average wind speed greater than 30 km/h and a maximum temperature above 30°C (drying). Week 1 and week 2 forecasted index is available daily from September 1 to August 31. Week 3 and week 4 forecasted index is available weekly (Thursday) from September 1 to August 31. Winds can significantly influence crop growth and yield mainly due to mechanical damage of plant vegetative and reproductive organs, an imbalance of plant-soil-atmosphere water relationships, and pest and disease distributions in agricultural fields. The maximum wind speed and the number of strong wind days over the forecast period represent short term and extended strong wind events respectively. Agriculture and Agri-Food Canada (AAFC) and Environment and Climate Change Canada (ECCC) have together developed a suite of extreme agrometeorological indices based on four main categories of weather factors: temperature, precipitation, heat, and wind. The extreme weather indices are intended as short-term prediction tools and generated using ECCC’s medium range forecasts to create a weekly index product on a daily and weekly basis.
-

Offshore wind represents a potentially significant source of low-carbon energy for Canada, and ensuring that relevant, high-quality data and scientifically sound analyses are brought forward into decision-making processes will increase the chances of success for any future deployment of offshore wind in Canada. To support this objective, CanmetENERGY-Ottawa (CE-O), a federal laboratory within Natural Resources Canada (NRCan), completed a preliminary analysis of relevant considerations for offshore wind, with an initial focus on Atlantic Canada. To conduct the analysis, CE-O used geographic information system (GIS) software and methods and engaged with multiple federal government departments to acquire relevant data and obtain insights from subject matter experts on the appropriate use of these data in the context of the analysis. The purpose of this work is to support the identification of candidate regions within Atlantic Canada that could become designated offshore wind energy areas in the future. The study area for the analysis included the Gulf of St. Lawrence, the western and southern coasts of the island of Newfoundland, and the coastal waters south of Nova Scotia. Twelve input data layers representing various geophysical, ecological, and ocean use considerations were incorporated as part of a multi-criteria analysis (MCA) approach to evaluate the effects of multiple inputs within a consistent framework. Six scenarios were developed which allow for visualization of a range of outcomes according to the influence weighting applied to the different input layers and the suitability scoring applied within each layer. This preliminary assessment resulted in the identification of several areas which could be candidates for future designated offshore wind areas, including the areas of the Gulf of St. Lawrence north of Prince Edward Island and west of the island of Newfoundland, and areas surrounding Sable Island. This study is subject to several limitations, namely missing and incomplete data, lack of emphasis on temporal and cumulative effects, and the inherent subjectivity of the scoring scheme applied. Further work is necessary to address data gaps and take ecosystem wide impacts into account before deployment of offshore wind projects in Canada’s coastal waters. Despite these limitations, this study and the data compiled in its preparation can aid in identifying promising locations for further review. A description of the methodology used to undertake this study is contained in the accompanying report, available at the following link: https://doi.org/10.4095/331855. This report provides in depth detail into how these data layers were compiled and details any analysis that was done on the data to produce the final data layers in this package.
-

The maximum wind speed during the forecast period km/hr (mdws). Week 1 and week 2 forecasted index is available daily from September 1 to August 31. Week 3 and week 4 forecasted index is available weekly (Thursday) from September 1 to August 31. Winds can significantly influence crop growth and yield mainly due to mechanical damage of plant vegetative and reproductive organs, an imbalance of plant-soil-atmosphere water relationships, and pest and disease distributions in agricultural fields. The maximum wind speed and the number of strong wind days over the forecast period represent short term and extended strong wind events respectively. Agriculture and Agri-Food Canada (AAFC) and Environment and Climate Change Canada (ECCC) have together developed a suite of extreme agrometeorological indices based on four main categories of weather factors: temperature, precipitation, heat, and wind. The extreme weather indices are intended as short-term prediction tools and generated using ECCC’s medium range forecasts to create a weekly index product on a daily and weekly basis.
-
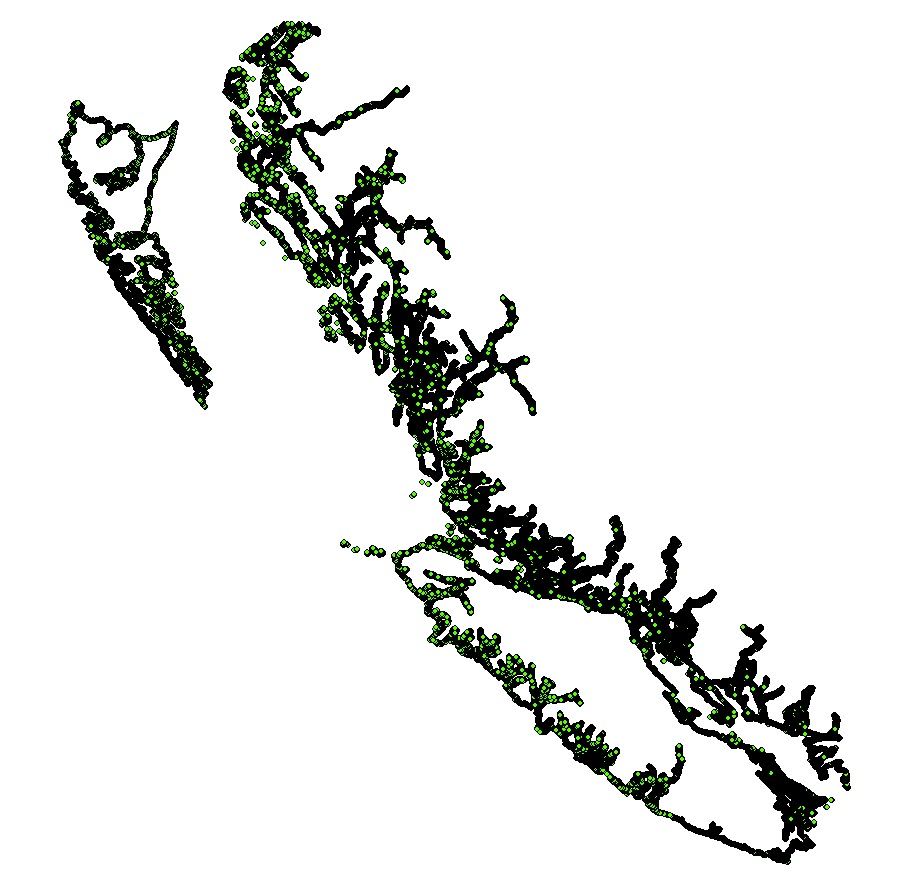
Fetch is a proxy for wind-wave action and exposure. Estimates of fetch over a total of 39,938 km of the BC coastline were calculated at 50 m intervals, yielding 799,220 near shore fetch points. Fetch was calculated for five regions in Pacific Canada: Haida Gwaii (HG), North and Central Coast (NCC), Queen Charlotte and Johnstone Straits (QCS), Salish Sea (SoG), and West Coast Vancouver Island (WCVI). For all regions, a bearing interval of 5 degrees was used to generate fetch lines for each point along the shoreline, resulting in 72 fetch lines per point. A maximum fetch distance of 200 km was used to ensure the barrier effect of Haida Gwaii was captured. Supplementary information provided includes the fetch geometry calculator script and user guide (Gregr 2014) and a report on the fetch processing objectives, process, and results (Gregr 2015).