 Arctic SDI catalogue
Inondation
Type of resources
Available actions
Keywords
Contact for the resource
Provided by
Years
Representation types
Update frequencies
status
Service types
-
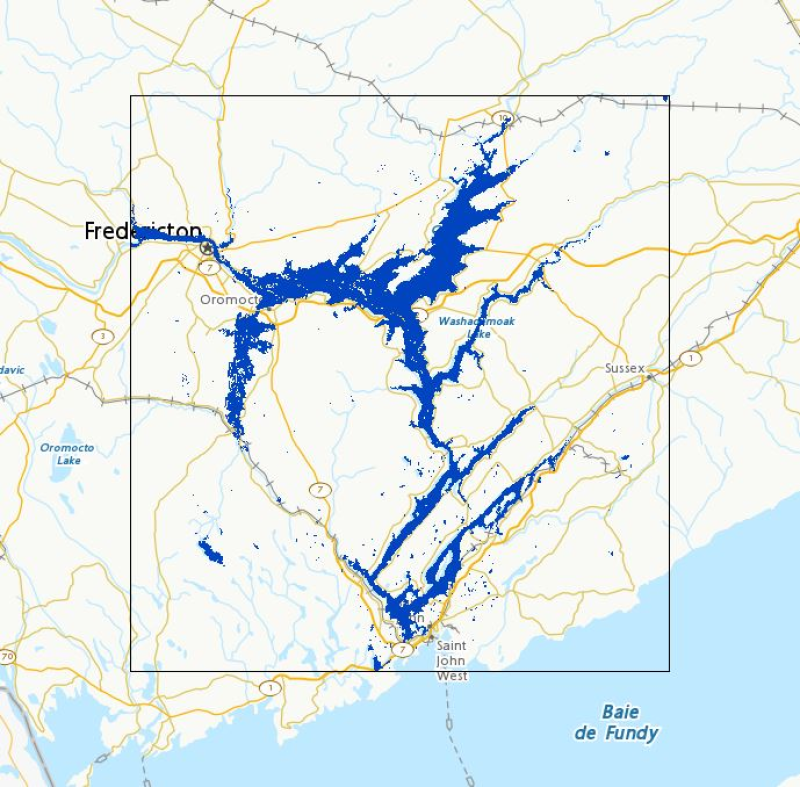
Flood extent polygons from the current calendar year in selected Canadian regions that have been designated for observation, monitored by Natural Resources Canada using satellite imagery for emergency response. Coverage is not comprehensive nationwide. In response to large flood events, Natural Resources Canada (NRCan), for the provision of emergency geomatics services, may be activated by Canada’s emergency management protocols. As new satellite imagery becomes available, NRCan will extract flood extent polygons and update the dataset in near real time (4 hours). This item contains the flood products generated in the past year. For any data relating to previous years, please refer to the [Floods in Canada – Archive]( https://open.canada.ca/data/en/dataset/74144824-206e-4cea-9fb9-72925a128189) entry. Please note that the web mapping service may not display data if flood polygons have not been published by the EGS for the current year. The flood products generated are validated on a best effort basis. Various factors may affect the quality of the flood polygons. These factors include, but are not limited to, sensor type, image resolution, cloud cover or limitations of the flood polygon extraction method. In this layer, where possible, a symbology is applied to the flood polygons based on the underlying land use classification, or is simply unclassified and shows the raw flood extent. When using Web mapping services, to display a specific product, filter by date (UTC Date) and area of interest (AOI). Also, a link to download each product is available in the Resources section. This prepackaged and compressed product contains a Shape file, a PDF file and a KMZ file. Disclaimer : Emergency response authorities are the primary users of these satellite-derived open water flood extent map products. These products are generated to provide analysis and emergency response situational awareness and to facilitate decision-making during major flood events. The open water flood extent products are generated rapidly and limited time is available for editing and validation. The flood products reflect the open water flood conditions at the date/time of acquisition. While efforts are made to produce high quality products, near-real time products may contain errors due to the limited time available for vector editing and validation. Please note that current algorithms do not map flooded areas under the forest canopy and are not optimized for urban flood mapping. Limitation of Liability : Accordingly, the information contained on this website is provided on an “as is” basis and Natural Resources Canada makes no representations or warranties respecting the information, either expressed or implied, arising by law or otherwise, including but not limited to, effectiveness, completeness, accuracy or fitness for a particular purpose. Natural Resources Canada does not assume any liability in respect of any damage or loss based on the use of this website. In no event shall Natural Resources Canada be liable in any way for any direct, indirect, special, incidental, consequential, or other damages based on any use of this website or any other website to which this site is linked, including, without limitation, any lost profits or revenue or business interruption. Parent Collection: - **[Floods in Canada - Cartographic Product Collection](https://open.canada.ca/data/en/dataset/08b810c2-7c81-40f1-adb1-c32c8a2c9f50)**
-

A limnimetric scale is a ruler, usually made of enamelled steel, that resists corrosion. They are generally attached by means of anchoring to existing infrastructures (bridge, quay, concrete wall) in order to ensure their durability. During periods of flooding, they allow municipalities to monitor and follow the rise in river levels. Purpose: Locate the speed scales that have been installed on waterways in the various administrative regions of Quebec as part of the vigilance project.**This third party metadata element was translated using an automated translation tool (Amazon Translate).**
-
Lignes de courbes de niveau générés à partir des données LiDAR capturés par McElhanney Consulting Services Ltd (MCSL). Les courbes de niveau relient les points de même élévation pour le paysage visé par le projet. Pour plus d'information, consulter : http://ouvert.canada.ca/data/fr/dataset/9bdc1a9c-baf7-4eb0-a532-c1057b284b8f
-
Ice maps produced for the prevention of flooding by ice jams and the monitoring of river ice during spring floods, winter temperatures or even during problems with ice jams. The maps are derived from radar satellite images, therefore available regardless of cloud cover, from several different sources, using algorithms to classify pixels into types of ice cover. Data is only processed and displayed on the main rivers at risk. The date the image was taken and the approximate region covered by the data is shown in the layer name. Data is added several times a week, but the frequency of revisits to each river can vary between 2 days and 2 weeks. The satellites and algorithms used according to the periods are summarized in this list: * __Image prefix__: period covered; source satellite; resolution of maps produced; algorithm used * __R2__: 2018 - 2022; Radarsat 2; 7m; ICEMAP-r * __RCM__: 2024 - now; Radarsat Constellation Mission; 5m; ICEMAP-r version 2024 * __S1__: 2018 - now; Sentinel 1; 12.5m; Arctus proprietary algorithm The different classes in the legend make it possible to differentiate the following types of ice: * __Water (dark blue) __: open water * __Water/Smooth Ice (blue) __: combination of water on ice, or spaced frasil rafts * __Smooth ice (cyan) __: or black ice, the exact term for this type of ice is “columnar ice”, due to the vertical and elongated shape of the crystals that compose it. Black ice is generally transparent because it contains few or no air bubbles. It is formed by cooling, in fairly calm water, which is why it is sometimes called “thermal ice”. Its surface is very smooth. * __Consolidated ice (light pink) __: includes Frasil ice or snow ice. Frasil ice forms in turbulent and very cold water. Composed of fine rounded crystals. These grains accumulate and rise to the surface to form moving ice rafts. These rafts end up close enough to freeze together (agglomerated ice). It contains a lot of air bubbles. Its surface is slightly to moderately rough. * __Consolidated ice with clusters (dark pink) __: ice cover formed by the stacking and freezing of various forms of moving ice; blocks that are superimposed or pieces of ice that are detached in one place and that are piled up in another. Moderately rough to very rough surface. The images from Radarsat-2 and RCM are obtained through a partnership between Public Safety Canada and the MSP. The ICEMAP-R algorithm developed by INRS makes it possible to identify the type of ice according to the internal roughness of the ice (presence of air bubbles) and the roughness of the surface of the ice cover (presence of blocks and accumulations). The initial version was usable for Radarsat 2. The 2022 and 2023 RCM ice maps are given as an indication (new algorithm in progress), only data since 2024 are processed with the Icemap-R algorithm adapted to RCM. Since 2018, the MSP has also used images from Sentinel-1, a radar satellite from the European Space Agency with a resolution of 10 m, resampled to 12.5m for ice maps. The images are then processed by the firm Arctus, which uses a proprietary algorithm. The output of the various algorithms has been reclassified to obtain a comparable legend. Historical data may have presented an alternative classification. Until 2022, the legend varied between winter and thaw. The web service also contains visible satellite images from Landsat satellites (the image prefixes are then L8, L9) or Sentinel 2 (prefix S2). In this case, colored compounds (false colors to benefit from infrared bands in particular) are used to best visualize the presence of ice. From 2024, the colored compound S2 used is as follows: * Red: 8A band (Near Infrared - VNIR) 20m (resampled to 10m) * Green: band 3 (Green) 10m * Blue: band 2 (Blue) 10m **This third party metadata element was translated using an automated translation tool (Amazon Translate).**
-

Flood extent polygons from the last three days in selected Canadian regions that have been designated for observation, monitored by Natural Resources Canada using satellite imagery for emergency response. Coverage is not comprehensive nationwide. In response to large flood events, Natural Resources Canada (NRCan), for the provision of emergency geomatics services, may be activated by Canada’s emergency management protocols. As new satellite imagery becomes available, NRCan will extract flood extent polygons and update the dataset in near real time (4 hours). This item contains the latest flood products generated in the past three days. For any data older than 72 hours, please refer to the [Floods in Canada - Current Year](https://open.canada.ca/data/en/dataset/b1afd8d2-6e14-4ec4-9a09-652221a6cb71) entry. Note that the web mapping service may not display data if flood polygons have not been published by the EGS in the past three days. The flood products generated are validated on a best effort basis. Various factors may affect the quality of the flood polygons. These factors include, but are not limited to, sensor type, image resolution, cloud cover or limitations of the flood polygon extraction method. In this layer, where possible, a symbology is applied to the flood polygons based on the underlying land use classification, or is simply unclassified and shows the raw flood extent. When using Web mapping services, to display a specific product, filter by date (UTC Date) and area of interest (AOI). Also, a link to download each product directly is available in the Resources section. This prepackaged and compressed product contains a Shape file, a PDF file and a KMZ file. Disclaimer: Emergency response authorities are the primary users of these satellite-derived open water flood extent map products. These products are generated to provide analysis and emergency response situational awareness and to facilitate decision-making during major flood events. The open water flood extent products are generated rapidly and limited time is available for editing and validation. The flood products reflect the open water flood conditions at the date/time of acquisition. While efforts are made to produce high quality products, near-real time products may contain errors due to the limited time available for vector editing and validation. Please note that current algorithms do not map flooded areas under the forest canopy and are not optimized for urban flood mapping. Limitation of Liability: Accordingly, the information contained on this website is provided on an “as is” basis and Natural Resources Canada makes no representations or warranties respecting the information, either expressed or implied, arising by law or otherwise, including but not limited to, effectiveness, completeness, accuracy or fitness for a particular purpose. Natural Resources Canada does not assume any liability in respect of any damage or loss based on the use of this website. In no event shall Natural Resources Canada be liable in any way for any direct, indirect, special, incidental, consequential, or other damages based on any use of this website or any other website to which this site is linked, including, without limitation, any lost profits or revenue or business interruption. Parent Collection: - **[Floods in Canada - Cartographic Product Collection](https://open.canada.ca/data/en/dataset/08b810c2-7c81-40f1-adb1-c32c8a2c9f50)**
-

This layer shows the delineation of the perimeter of the Special Intervention Zone (ZIS) of decree called “Declaration of a special intervention zone in order to promote better management of flood zones”. This area was created from a variety of sources of data showing the flooded areas of 2017 and 2019. Since the adoption of Decree 817-2019, this dataset is no longer in force. For more information on the mapping of flood zones in Quebec, consult the Information available on the Ministry's website using the following link: http://www.cehq.gouv.qc.ca/zones-inond/zone-intervention-speciale.htm **This third party metadata element was translated using an automated translation tool (Amazon Translate).**
-
Delimitation of territories for which a ministerial order has been published in the Official Gazette of Quebec in order to exempt them from the application of the regulations provided for in the territory of the ZIS. Territories other than those shown may be subtracted later. For more information on the mapping of flood zones in Quebec, consult the information available on the Ministry's website using the following link: http://www.cehq.gouv.qc.ca/zones-inond/zone-intervention-speciale.htm**This third party metadata element was translated using an automated translation tool (Amazon Translate).**
-
This layer shows the delimitation of the perimeter of the 2017-2019 flooded area found in Annex 2 of the decree called “Declaration of a special intervention zone in order to promote better management of flood zones”. This zone was created using a variety of data sources presenting the 2017 and 2019 flooded areas. For more information on the mapping of flood zones in Quebec, consult the Information available on the Ministry's website using the following link: http://www.cehq.gouv.qc.ca/zones-inond/zone-intervention-speciale.htm**This third party metadata element was translated using an automated translation tool (Amazon Translate).**
-

McElhanney Consulting Services Ltd (MCSL) has performed a LiDAR and Imagery survey in southern Saskatchewan. The purpose was to generate DEMs for hydraulic modeling of floodplain, digital terrain maps, and other products for portions of the Swift Current Creek valley and other miscellaneous tributaries and related water course valleys in and around the City of Swift Current. The acquisition was completed between the 16th and 25th of October, 2009. The survey consisted of approximately 790 square kilometers of coverage. While collecting the LiDAR data, we also acquired aerial photo in RGB and NIR modes consisting of 1649 frames each. In addition to the main area of interest, McElhanney has acquired some LiDAR and photo of low lying areas adjacent to the project area. This additional area was acquired on speculation that the data may be required in the future. The 3Dimensional laser returns (point cloud) were classified using Microstation (v8), Terrascan and TerraModeler. A series of algorithms based on topography were created to separate laser returns that hit the ground from the ones that hit objects above the ground. Steps taken are: Classified LiDAR surface as Bare earth, Classified other features as non-bare earth or default, Formatted to ASPRS .LAS V1.1 (Class 1 - Default (non-bare earth), Class 2 – Ground points (bare earth)), 239 tiles each 2km x2km generated for LiDAR data, File prefix FF – Classified (Non-Bare Earth and Bare Earth), File Prefix BE – Bare Earth only, Bare Earth Model Key Point (MKPts) surface files are thinned Bare earth LiDAR points. MKPts files generate a virtually identical surface without the large file size, MKPts file format is ASCII (Easting Northing Z-elevation) xyz and LAS format.