 Arctic SDI catalogue
Glace
Type of resources
Available actions
Topics
Keywords
Contact for the resource
Provided by
Years
Formats
Representation types
Update frequencies
status
Service types
Scale
-

River ice roughness products from the last three days in selected Canadian regions that have been designated for observation, monitored by Natural Resources Canada using satellite imagery for emergency response. Coverage is not comprehensive nationwide. In order to mitigate ice jam induced flood risks, Natural Resources Canada emergency geomatics service (EGS) may be activated by Canada’s emergency management authorities. As new satellite imagery becomes available, NRCan will produce river ice roughness maps and update the dataset in near real time (4 hours). This item contains the latest river ice roughness products generated in the past three days. For any data older than 72 hours, please refer to the [River Ice in Canada - Current Year](https://open.canada.ca/data/en/dataset/8ca6f047-ddef-43d7-81c2-47654f4c69bd) entry. The river ice product is generated and validated on a best effort basis. Various factors may affect the quality of the river ice roughness maps. Those factors include but are not limited to: environmental condition at the time of acquisition, image resolution or the limitations of the methodology used. To view a specific product in Web Services, filter the data by date (UTC Date) and area of interest (AOI). A link to download specific EGS products is available in the Resources section. Disclaimer: Emergency response authorities are the primary users of these satellite-derived river ice roughness map products. These products are generated to provide analysis and emergency response situational awareness and to facilitate decision-making during major flood events. The river ice roughness products are generated rapidly and limited time is available for editing and validation. The river ice roughness products reflect the river ice surface roughness conditions at the date/time of acquisition. While efforts are made to produce high quality products, near-real time products may contain errors due to the limited time available for validation and the limited availability of ground truthing data. Limitation of Liability: Accordingly, the information contained on this website is provided on an “as is” basis and Natural Resources Canada makes no representations or warranties respecting the information, either expressed or implied, arising by law or otherwise, including but not limited to, effectiveness, completeness, accuracy or fitness for a particular purpose. Natural Resources Canada does not assume any liability in respect of any damage or loss based on the use of this website. In no event shall Natural Resources Canada be liable in any way for any direct, indirect, special, incidental, consequential, or other damages based on any use of this website or any other website to which this site is linked, including, without limitation, any lost profits or revenue or business interruption. Parent Collection: - **[River Ice State in Canada - Cartographic Product Collection](https://open.canada.ca/data/en/dataset/d1fcb44f-5f86-4957-bdb4-e6fd1aa69283)**
-

River ice roughness products from the current calendar year in selected Canadian regions that have been designated for observation, monitored by Natural Resources Canada using satellite imagery for emergency response. Coverage is not comprehensive nationwide. In order to mitigate ice jam induced floods risks, Natural Resources Canada emergency geomatics service (EGS) may be activated by Canada’s emergency management authorities. As new satellite imagery becomes available, NRCan will produce river ice roughness maps and update the dataset in near real time (4 hours). This item contains record of the river ice roughness products generated in the current year. For the complete archive, please refer to the [River Ice in Canada - Archive](https://open.canada.ca/data/en/dataset/5e6b40bf-299f-4e05-87c8-d10b9c8210f9) entry. The river ice product is generated and validated on a best effort basis. Various factors may affect the quality of the river ice roughness maps. Those factors include but are not limited to: environmental condition at the time of acquisition, image resolution or the limitations of the methodology used. To view a specific product, filter the data by date (UTC Date) and area of interest (AOI). Links to download specific EGS product are available in the Resources section. Disclaimer: Emergency response authorities are the primary users of these satellite-derived river ice roughness map products. These products are generated to provide analysis and emergency response situational awareness and to facilitate decision-making during major flood events. The river ice roughness products are generated rapidly and limited time is available for editing and validation. The river ice roughness products reflect the river ice surface roughness conditions at the date/time of acquisition. While efforts are made to produce high quality products, near-real time products may contain errors due to the limited time available for validation and the limited availability of ground truthing data. Limitation of Liability: Accordingly, the information contained on this website is provided on an “as is” basis and Natural Resources Canada makes no representations or warranties respecting the information, either expressed or implied, arising by law or otherwise, including but not limited to, effectiveness, completeness, accuracy or fitness for a particular purpose. Natural Resources Canada does not assume any liability in respect of any damage or loss based on the use of this website. In no event shall Natural Resources Canada be liable in any way for any direct, indirect, special, incidental, consequential, or other damages based on any use of this website or any other website to which this site is linked, including, without limitation, any lost profits or revenue or business interruption. Parent Collection: - **[River Ice State in Canada - Cartographic Product Collection](https://open.canada.ca/data/en/dataset/d1fcb44f-5f86-4957-bdb4-e6fd1aa69283)**
-

This data layer comes from information recorded to the Operations Directorate of the Ministry of Public Security (MSP) during winter heat or spring flooding. The compilation was carried out using digital documents, papers, event reports or situation reports. The database also contains field observations made by municipal stakeholders grouped into river monitoring committees. These committees are set up and coordinated by the regional directorates of the MSP. Field observation is the collection of qualitative or quantitative data on the state of the river at a specific time. The level of the river can, when the situation applies, be measured using a limnimetric scale or evaluated using a geographic coordinate system as well as its trend (increasing, stable, or decreasing). General information characterizing the ice cover may also be recorded by the observer. The information in the database is consistent with the Canadian Common Alert Protocol Profile (PC-PAC). The PC-PAC is a set of rules and controlled values that support the translation and composition of a message to facilitate its sending by different means and from different sources. The PC-PAC formats used are as follows: SEVERITY LEVEL The severity level of the event based on the harm to life of persons or damage to property. The severity of observations on past events can therefore be estimated from the consequences recorded at the time of the events. For field observations by river committees, the degree of severity is generally estimated directly by the observer. The definitions are as follows: Extreme: Extraordinary threat to life or property. Significant: a significant threat to life or property. Moderate: possible threat to life or property. Minor: low threat to life or property. Normal: there is no threat to life or property. Unknown: severity unknown. EMERGENCY The emergency level is determined based on the reactive measures that need to be taken in response to the current situation. The definitions are as follows: Immediate: reactive action must be taken immediately. Expected: Reactive action should be taken soon (within the next hour). Future: reactive action needs to be taken in the near future. Past: reactive action is no longer necessary. Unknown: emergency unknown. STATE The state refers to the context of the observation, real or simulated. Current: information about a real event or situation. Purpose: To obtain an overall picture of the situation concerning ice jam flooding problems in order to estimate the risk of flooding along river sections subject to this problem. Geographically locate the ice jams listed on Quebec waterways. Characterize each case listed according to the severity level as defined in the PC-CAP common alert protocol.**This third party metadata element was translated using an automated translation tool (Amazon Translate).**
-

This dataset uses RADARSAT Constellation Mission (RCM) Synthetic Aperture Radar (SAR) satellite images to identify open water regions within ice-covered rivers during winter, with the aim to assess hydrokinetic resources near remote communities reliant on diesel fuel for electricity generation. The data is processed with the HyRASS, a machine learning-based SAR image processing and classification algorithm. Disclaimer: This dataset was designed to identify open water regions within ice-covered rivers for assessing hydrokinetic resources near remote communities reliant on diesel fuel for electricity generation and is subject to the following limitations: • This dataset was derived from RADARSAT Constellation Mission (RCM) Synthetic Aperture Radar (SAR) satellite images. While these images are generally reliable, they are subject to inherent limitations, including resolution constraints, potential distortion, and occasional inaccuracies in real-time conditions capture. • The HyRASS algorithm is designed to pinpoint open water areas using satellite images, with a particular emphasis on RCM quad polarization (QP) imagery. This specialization means that its effectiveness depends on the accessibility of this specific type of imagery. Consequently, the data it produces might not cover a broad spectrum of time periods. For more reliable results, it's essential to classify areas more regularly, ensuring that detected open water regions are consistent over time. This dataset is intended for preliminary assessment and should not be the sole basis for making critical decisions or investments related to hydrokinetic energy projects. Further validation and in-depth analysis are strongly recommended, and users should conduct their own due diligence and additional research to verify the data accuracy and relevance for specific applications. By accessing and using this dataset, users acknowledge and accept these disclaimers. The providers of this dataset explicitly absolve themselves of any responsibility or liability for any consequences arising from the use, reliance upon, or interpretation of this dataset. Users are advised that their use of the dataset is at their own risk, and they assume full responsibility for any actions or decisions made based on the information contained therein. This disclaimer is in accordance with applicable laws and regulations, and by accessing or utilizing the dataset, users agree to release the providers of this dataset from any legal claims, damages, or liabilities that may arise from such use.
-
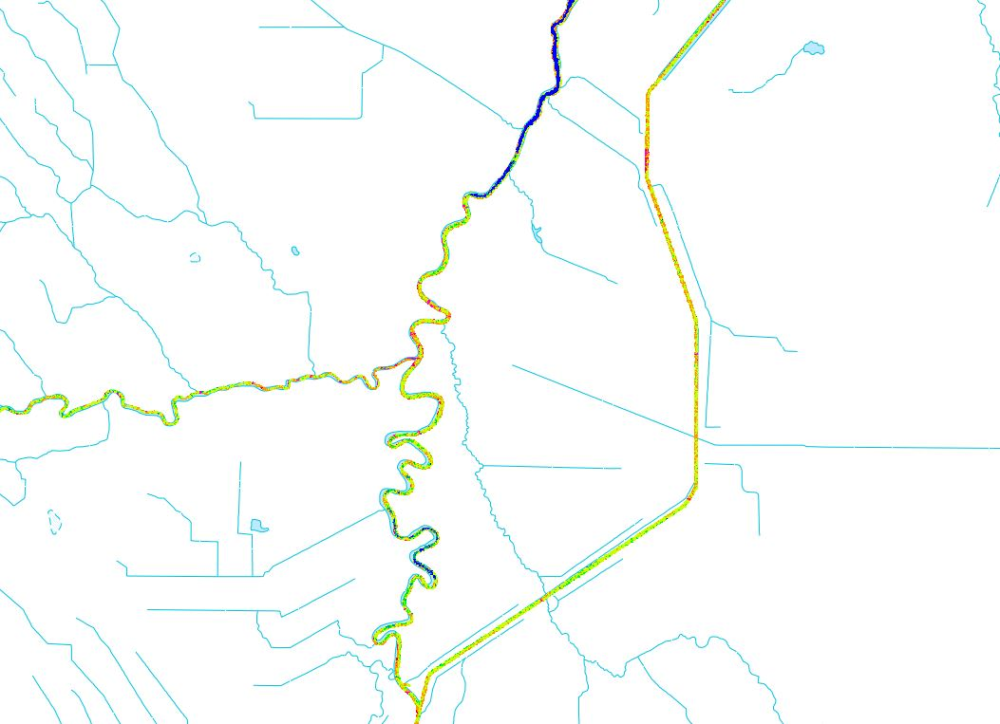
River ice roughness products from past years in selected Canadian regions that have been designated for observation, monitored by Natural Resources Canada using satellite imagery for emergency response. Coverage is not comprehensive nationwide. In order to mitigate ice jam induced floods risks, Natural Resources Canada emergency geomatics service (EGS) may be activated by Canada’s emergency management authorities. As new satellite imagery becomes available, NRCan will produce river ice roughness maps and update the dataset in near real time (4 hours). This item contains the complete record of the river ice roughness products generated in past years. For any data to the current year, please refer to the [River Ice in Canada - Seasonal](https://open.canada.ca/data/en/dataset/8ca6f047-ddef-43d7-81c2-47654f4c69bd) entry. The river ice product is generated and validated on a best effort basis. Various factors may affect the quality of the river ice roughness maps. Those factors include but are not limited to: sensor type, image resolution or the limitations of the methodology used. To view a specific product in Web Services, filter the data by date (UTC Date) and area of interest (AOI). A link to download specific EGS products is available in the Resources section. Disclaimer: Emergency response authorities are the primary users of these satellite-derived river ice roughness map products. These products are generated to provide analysis and emergency response situational awareness and to facilitate decision-making during major flood events. The river ice roughness products are generated rapidly and limited time is available for editing and validation. The river ice roughness products reflect the river ice surface roughness conditions at the date/time of acquisition. While efforts are made to produce high quality products, near-real time products may contain errors due to the limited time available for validation and the limited availability of ground truthing data. Limitation of Liability: Accordingly, the information contained on this website is provided on an “as is” basis and Natural Resources Canada makes no representations or warranties respecting the information, either expressed or implied, arising by law or otherwise, including but not limited to, effectiveness, completeness, accuracy or fitness for a particular purpose. Natural Resources Canada does not assume any liability in respect of any damage or loss based on the use of this website. In no event shall Natural Resources Canada be liable in any way for any direct, indirect, special, incidental, consequential, or other damages based on any use of this website or any other website to which this site is linked, including, without limitation, any lost profits or revenue or business interruption. Parent Collection: - **[River Ice State in Canada - Cartographic Product Collection](https://open.canada.ca/data/en/dataset/d1fcb44f-5f86-4957-bdb4-e6fd1aa69283)**
-

Collection of monitoring products of river ice roughness from current and past winter seasons throughout Canada as monitored by Natural Resources Canada using satellite imagery. This collection of cartographic products regroups river ice state monitoring products and their associated footprints. Three visualization timeframes are available: - **[Active Monitoring of River Ice in Canada](https://open.canada.ca/data/en/dataset/7b210c58-2fc7-47c5-8b8a-2605c77d725c)** - **[River Ice in Canada - Current](https://open.canada.ca/data/en/dataset/8ca6f047-ddef-43d7-81c2-47654f4c69bd)** - **[River Ice in Canada - Archive](https://open.canada.ca/data/en/dataset/5e6b40bf-299f-4e05-87c8-d10b9c8210f9)**
-
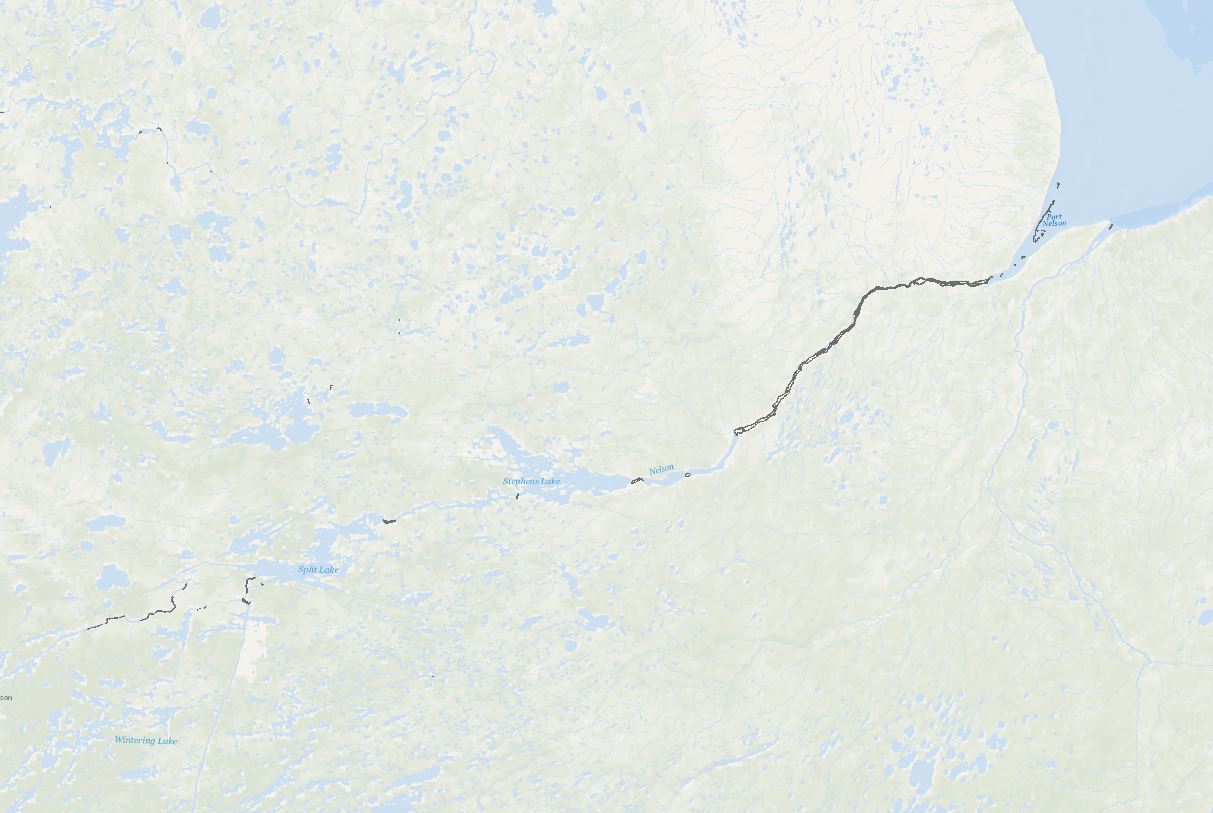
Building on the initial effort (“Database of Open Water Areas in River Ice for Provinces of Manitoba, Ontario, Quebec, and the Maritimes - Potential Locations For River Hydrokinetic Energy Extraction Identified Through Optical Satellite Imager”; weblink: https://search.open.canada.ca/openmap/d9823004-29aa-40e2-aa47-9c54cf88c309), a follow-up research project has led to the publication of this extensive analysis encompassing the entirety of Canada’s major freezing rivers. This work has applied advanced image processing and classification algorithms to the selected images, elevating the classification and analysis to a higher level of accuracy and providing a more comprehensive dataset for exploring river hydrokinetic energy prospects across the country. This dataset identifies open water areas within ice-covered major Canadian rivers, aiming to evaluate potential hydrokinetic resources. The data is derived from high-resolution optical satellite imagery obtained from Landsat and Sentinel satellites corresponding to National Research Council (NRC) 2014 flow data of river reaches with water depths of at least 10 meters and a flow velocity of a minimum of 0.5 meters per second. Using advanced image processing and machine learning algorithms, the dataset efficiently differentiates between ice-covered and open water regions, providing a reliable basis for assessing hydrokinetic energy potential in the identified areas. Disclaimer: This dataset is subject to the following limitations: • Landsat and Sentinel optical satellite images are high-resolution, but they may contain resolution errors, possible distortions, and inaccuracies in depicting on-ground conditions. • Despite advanced image processing and machine learning algorithms, errors or biases may exist. • The dataset's reliability is also influenced by the NRC flow data. Therefore, users should view this dataset as a preliminary assessment tool, not a definitive guide for decision-making or investment in hydrokinetic projects. It is strongly recommended to validate its accuracy and suitability for specific applications through additional research and studies. By accessing and using this dataset, users acknowledge and accept these disclaimers. The providers of this dataset explicitly absolve themselves of any responsibility or liability for any consequences arising from the use, reliance upon, or interpretation of this dataset. Users are advised that their use of the dataset is at their own risk, and they assume full responsibility for any actions or decisions made based on the information contained therein. This disclaimer is in accordance with applicable laws and regulations, and by accessing or utilizing the dataset, users agree to release the providers of this dataset from any legal claims, damages, or liabilities that may arise from such use.
-

Snow and ice are important hydrological resources. Their minimum spatial extent here referred to as annual minimum snow/ice (MSI) cover, plays a very important role as an indicator of long-term changes and baseline capacity for surface water storage. The MSI probability is derived from sequence of seventeen 10-day clear-sky composites corresponding to April, 1 to September, 20 warm period for each year since 2000. Data from Moderate Resolution Imaging Spectroradiometer (MODIS) on Terra satellite for the period since 2000 have been processed with the special technology developed at the Canada Centre for Remote Sensing (CCRS) as described in Trishchenko, 2016; Trishchenko et al., 2016; 2009, 2006, Trishchenko and Ungureanu, 2021, Khlopenkov and Trishchenko, 2008, Luo et al., 2008. The presence of snow or ice is determined for each pixel of the image based on snow/ice scene identification procedure and the probability if computed for the entire warm season as a ratio of number of snow/ice flags to the total number of pixels available (less or equal to 17). The minimum snow and ice extent can be derived from the probability map by applying a certain threshold. New data version V5.0 replaces previous version V4.0 for all data available since 2000. All MSI files were reprocessed for all MODIS input data based on collection 6.1. The output format has not changed since previous version. It is described in Trishchenko (2024). The impact of input data change is small and can be detected only for time interval 2000-2015. Data starting 2016 has been already derived using MODIS collection 6.1 input. The differences between the MSI data based on MODIS Collection 5 (i.e. MSI V4) versus MODIS Collection 6.1 (i.e. MSI V5), on average, are quite small. The region-wide relative difference in the MSI extent varies from -3.97% to +1.75%. The mean value is -0.14%, the median value is 0.18% and standard deviation is 1.83%. As such, we do not expect any sizeable impact of the version change on our previous conclusions regarding trends and climate variations, except for refining the relative values of statistical parameters within the range of a few percents. References: TRISHCHENKO, A.P., 2024: Probability maps of the annual minimum snow and ice (MSI) presence over April,1 to September, 20 period since 2000 derived from MODIS 250m imagery over Canada and neighbouring regions. Data format description. CCRS, NRCan. 4pp.
-
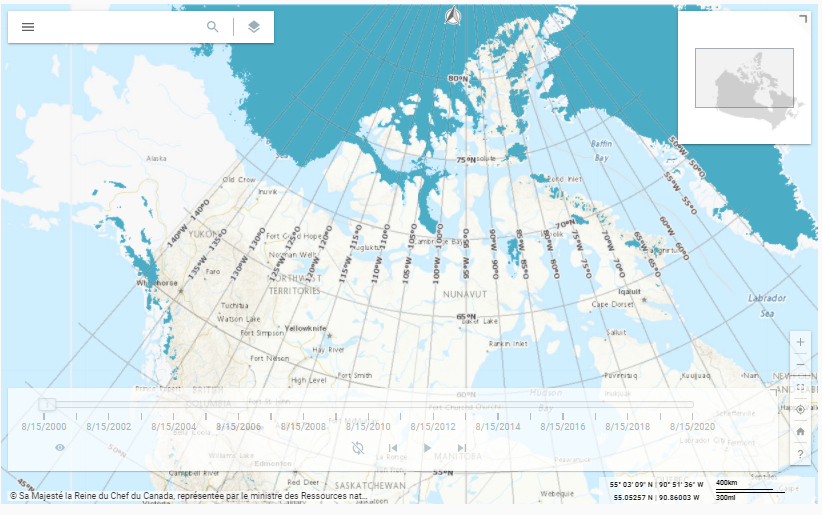
The Annual Minimum Snow and Ice (MSI) Extent of the Atlas of Canada National Scale Data, are data sets compiled containing annual data from 2000 to present. The data sets were derived from research published by the Canada Centre for Remote Sensing which classified satellite imagery over Canada and neighbouring regions for the continued presence or absence of snow and ice from April 1 to September 20 each year. The Atlas of Canada MSI products consist of a vector dataset and a raster time-series animation application. VECTOR DATASET The vector dataset has been generalized to display at the scale of 1:1,000,000. TIME-SERIES ANIMATION APPLICATION The time-series animation application has not been generalized from its original scale (250 m pixels). The application is disseminated through the Data Cube Platform, implemented by the Canada Centre for Mapping and Earth Observation, Natural Resources Canada using geospatial big data management techniques. These technologies enable the rapid and efficient visualization of high-resolution geospatial data and allow for the rapid generation of dynamically derived products. The time-series is also available as a Web Map Service (WMS) and Web Coverage Service (WCS). CREDIT Source data provided by Alexander P. Trishchenko, Canada Centre for Remote Sensing, Natural Resources Canada Metadata record: https://open.canada.ca/data/en/dataset/808b84a1-6356-4103-a8e9-db46d5c20fcf
-
Environment and Climate Change Canada provides global sea-ice analysis fields produced by its operational Global Deterministic Prediction System (GDPS) and interpolated to a rotated latitude-longitude grid with 0.09 x 0.09 degree resolution. The data files are in NetCDF format (NetCDF-4 classic model) and comply with the Climate and Forecast Conventions. The Global Sea-Ice Analysis System is an analysis system based on 3D-Var assimilation covering all waters (ocean and lakes) at a 10km horizontal resolution on a YIN-YANG grid and using a 6 hours persistence forecast for the background state. This analysis assimilates 4 times a day satellite remote sensing data and Canadian Ice Service ice charts.