 Arctic SDI catalogue
Vessels
Type of resources
Available actions
Topics
Keywords
Contact for the resource
Provided by
Formats
Representation types
Update frequencies
status
-
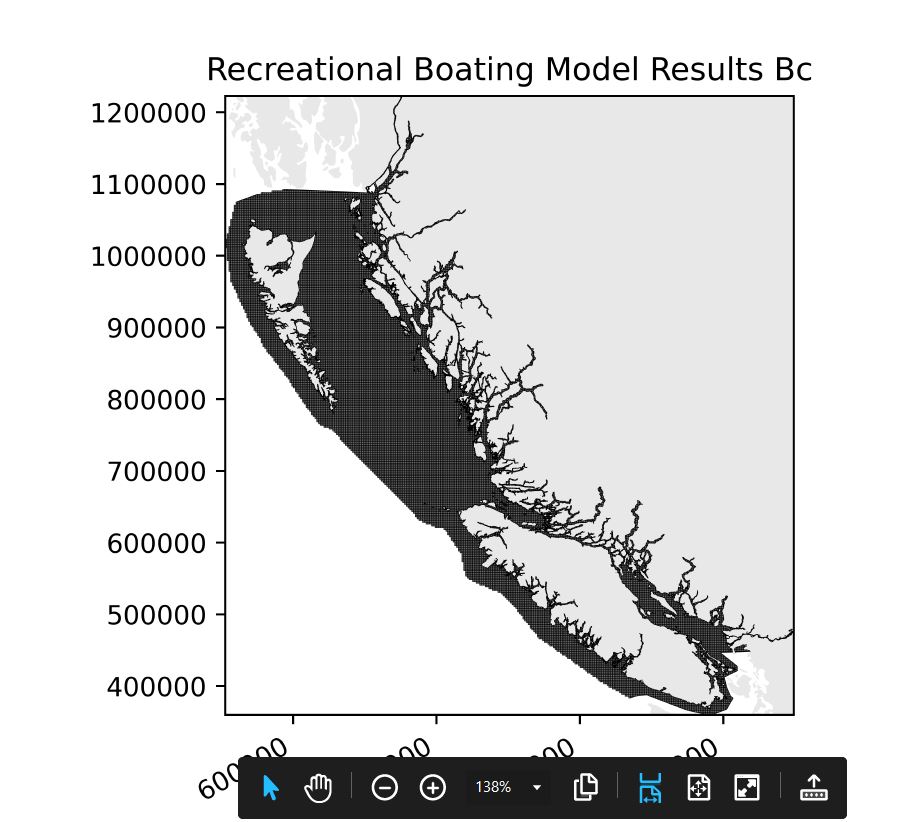
Description: Data on recreational boating are needed for marine spatial planning initiatives in British Columbia (BC). Vessel traffic data are typically obtained by analyzing automatic identification system (AIS) vessel tracking data, but recreational vessels are often omitted or underrepresented in AIS data because they are not required to carry AIS tracking devices. Transport Canada’s National Aerial Surveillance Program (NASP) conducted aerial surveys to collect information on recreational vessels along several sections of the BC coast between 2018 and 2022. Recreational vessel sightings were modeled against predictor variables (e.g., distance to shore, water depth, distance to, and density of marinas) to predict the number of recreational vessels along coastal waters of BC. The files included here are: --A Geodatabase (‘Recreational_Boating_Data_Model’), which includes: (1) recreational vessel sightings data collected by NASP in BC and used in the recreational vessel traffic model (‘Recreational_Vessels_PointData_BC’); (2) aerial survey effort (or number of aerial surveys) raster dataset (‘surveyeffort’); and (3) a vector grid dataset (2.5 km resolution) containing the predicted number of recreational vessels per cell and predictor variables (‘Recreational_Boating_Model_Results_BC). --Scripts folder which includes R Markdown file with R code to run the modelling analysis (‘Recreational_Boating_Model_R_Script’) and data used to run the code. Methods: Data on recreational vessels were collected by NASP during planned aerial surveys along pre-determined routes along the BC coast from 2018 to 2022. Data on non-AIS recreational vessels were collected using video cameras onboard the aircraft, and data on AIS recreational vessels using an AIS receiver also onboard the aircraft. Recreational boating predictors explored were: water depth, distance to shore, distance to marinas, density of marinas, latitude, and longitude. Recreational vessel traffic models were fitted using Generalized Linear Models (GLM) R packages and libraries used here include: AED (Roman Lustrik, 2021) and MASS (Venables, W. N., Ripley, 2002), pscl package (Zeileis, Kleiber, and Jackman, 2008) for zeroinfl() and hurdle() function. Final model was selected based on the Akaike’s information criterion (AIC) and the Bayes’ information criterion (BIC). An R Markdown file with code use to run this analysis is included in the data package in a folder called Script. Spatial Predictive Model: The selected model, ZINB, consist of two parts: one with a binomial process that predicts the probability of encountering a recreational vessel, and a second part that predicts the number of recreational vessels via a count model. The closer to shore and to marinas, and the higher the density of marinas, the higher the predicted number of recreational vessels. The probability of encountering recreational vessels is driven by water depth and distance to shore. For more information on methodology, consult metadata pdf available with the Open Data record. References: Serra-Sogas, N. et al. 2021. Using aerial surveys to fill gaps in AIS vessel traffic data to inform threat assessments, vessel management and planning. Marine Policy 133: 104765. https://doi.org/10.1016/j.marpol.2021.104765 Data Sources: Recreational vessel sightings and survey effort: Data collected by NASP and analyzed by Norma Serra to extract vessel information and survey effort (more information on how this data was analyzed see SerraSogas et al, 2021). Bathymetry data for the whole BC coast and only waters within the Canadian EEZ was provided by DFO – Science (Selina Agbayani). The data layer was presented as a raster file of 100 meters resolution. Coastline dataset used to estimate distance to shore and to clip grid was provided by DFO – Science (Selina Agbayani), created by David Williams and Yuriko Hashimoto (DFO – Oceans). Marinas dataset was provided by DFO – Science (Selina Agbayani), created by Josie Iacarella (DFO – Science). This dataset includes large and medium size marinas and fishing lodges. The data can be downloaded from here: Floating Structures in the Pacific Northwest - Open Government Portal (https://open.canada.ca/data/en/dataset/049770ef-6cb3-44ee-afc8-5d77d6200a12) Uncertainties: Model results are based on recreational vessels sighted by NASP and their related predictor variables and not always might reflect real-world vessel distributions. Any biases caused by the opportunistic nature of the NASP surveys were minimized by using survey effort as an offset variable.
-
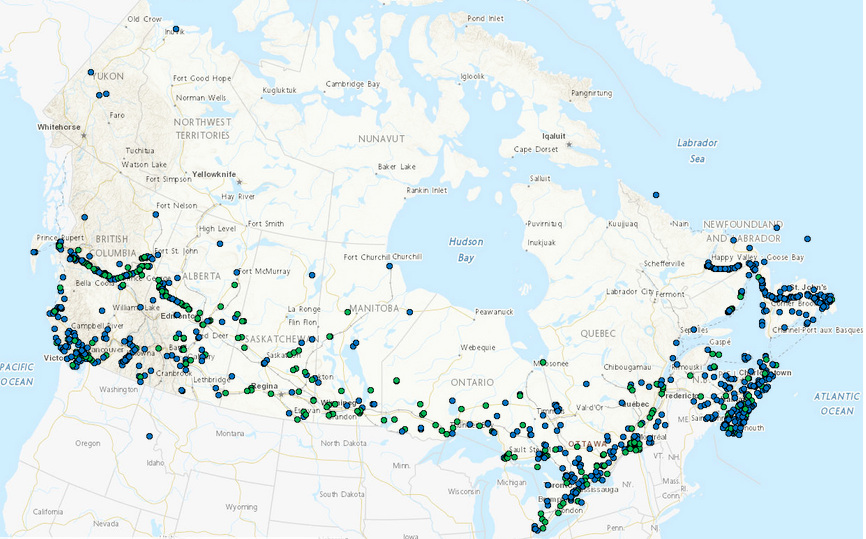
Projects submitted to Transport Canada’s Navigation Protection Program. Please note that where appropriate, the content is displayed in the language of the original submission and has not been altered.
-

This service provides routeing measures. These include established (mandatory) direction of traffic flow, recommended direction of traffic flow, separation lines, separation zones, limits of restricted routeing measure, limits of routeing measures, precautionary areas, archipelagic sea lanes (axis line and limit beyond which vessels shall not navigate) and fairways designated by regulatory authority.
-

The Automatic Identification System (AIS) is a global, satellite-based and terrestrial-based ship tracking system that uses shipborne equipment to remotely track vessel identification and positional information and is typically required on vessels of 300 gross tonnage or more on an international voyage, of 500 gross tonnage or more not on an international voyage, and passenger ships of all sizes. AIS tracking technologies are primarily used in support of real-time maritime domain awareness and for maritime security and safety of life at sea. This report describes a geographic information system (GIS) analysis of 2019 AIS data to produce yearly and monthly vessel density maps of all vessel classes combined and yearly density maps of each vessel class. The year 2019 was selected to portray shipping densities in a pre-COVID 19 pandemic depiction of the maritime transport sector in the Northwest Atlantic. Vessel density map applications include use in spatial analysis and decision support for marine spatial planning. In 2023 the process was applied to the years 2013 through to 2022 and were made available using the same processes that were applied to the original 2019 datasets.