 Arctic SDI catalogue
plants
Type of resources
Available actions
Topics
Keywords
Contact for the resource
Provided by
Years
Formats
Representation types
Update frequencies
status
Service types
-
The Plant Hardiness Zones map outlines the different zones in Canada where various types of trees, shrubs and flowers will most likely survive. It is based on the average climatic conditions of each area. The first such map for North America, released by the United States Department of Agriculture in 1960, was based only on minimum winter temperatures. In 1967, Agriculture Canada scientists created a plant hardiness map using Canadian plant survival data and a wider range of climatic variables, including minimum winter temperatures, length of the frost-free period, summer rainfall, maximum temperatures, snow cover, January rainfall and maximum wind speed. Natural Resources Canada's Canadian Forest Service scientists have now updated the plant hardiness zones using the same variables and more recent climate data (1961-90). They have used modern climate mapping techniques and incorporated the effect of elevation. The new map indicates that there have been changes in the hardiness zones that are generally consistent with what is known about climate change. These changes are most pronounced in western Canada. The new hardiness map is divided into nine major zones: the harshest is 0 and the mildest is 8. Subzones (e.g., 4a or 4b, 5a or 5b) are also noted in the map legend. These subzones are most familiar to Canadian gardeners. Some significant local factors, such as micro-topography, amount of shelter and subtle local variations in snow cover, are too small to be captured on the map. Year-to-year variations in weather and gardening techniques can also have a significant impact on plant survival in any particular location. For more information see: http://open.canada.ca/data/en/dataset/50f9f293-f288-4de6-98ad-f69cf85d21ea
-
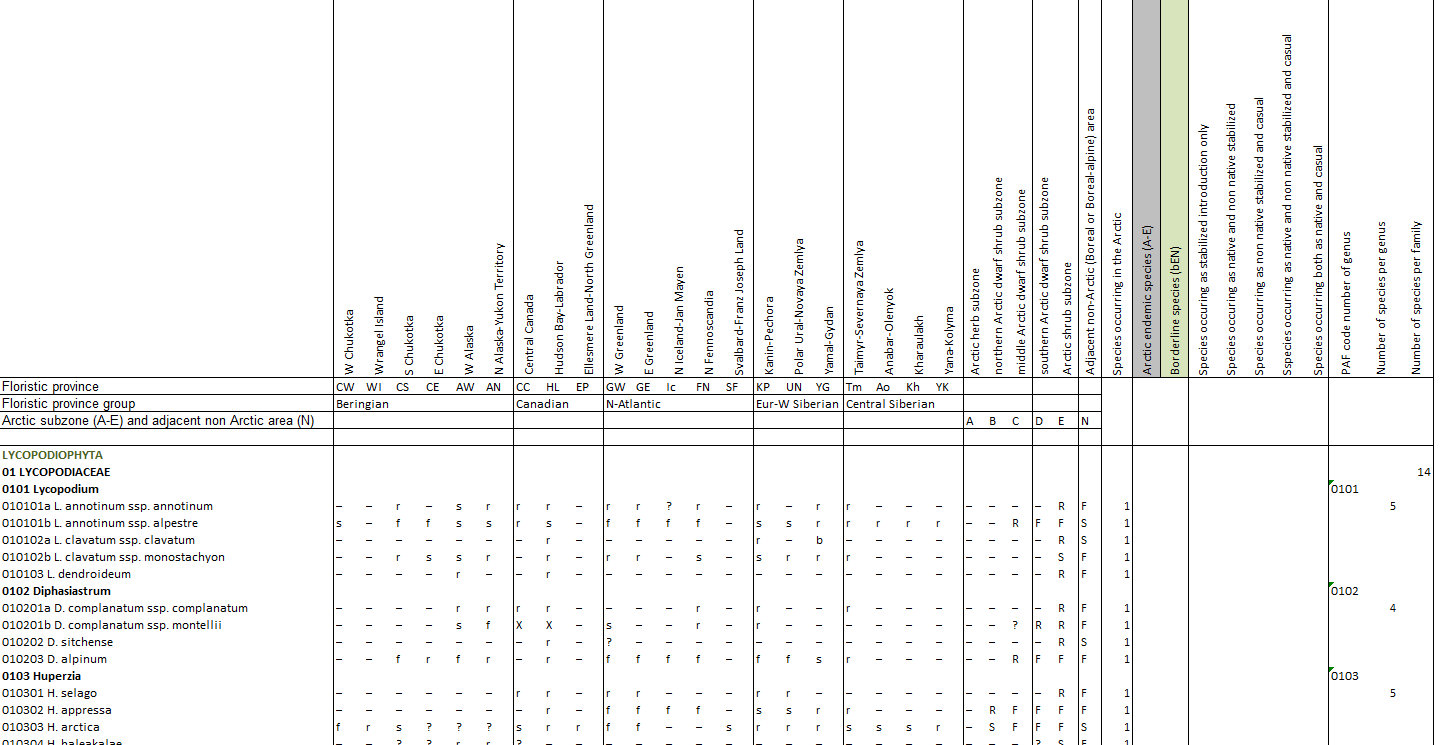
Appendix 9.1 List of all Arctic vascular plant species (with PAF code number) and their distribution in the 21 Arctic floristic provinces and 5 subzones based on Elven (2007).
-
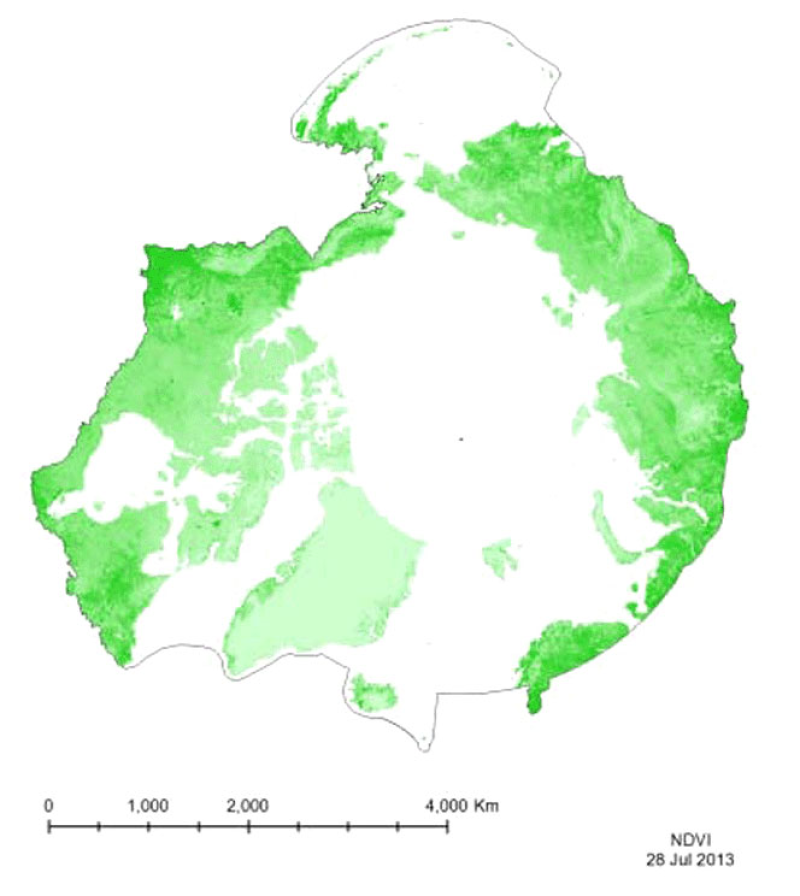
Vegetation indices quantify the concentrations of green leaf vegetation (chlorophyll)around the globe, in an attempt to monitor and correlate vegetation health and stress. The MODIS vegetation products include the Normalized Difference Vegetation Index (NDVI)and an Enhanced Vegetation Index (EVI). Included in the MOD13C1 product is both NDVIand EVI, so both have been provided for the CAFF Dedicated Pan-Arctic Satellite RemoteSensing Products and Distribution System. These indices come in a variety of resolutions,but MTRI has provided a monthly global composite on a 0.05° Climate Model GRID(CMG).
-
Une version en français est disponible à http://atlas.agr.gc.ca/ogc/phz-zrp_wms_fr?service=wms&request=getcapabilities
-

Site locations of aquatic invasive species occurrences throughout the province. The aquatic invasive species include species of amphibians, fishes, invertebrates, plants, alga and turtles. This spatial dataset was compiled from a number of data sources including The Invasive Plant Council of BC; the Beaty Biodiversity Museum; the Royal BC Museum; the Fisheries Information Summary System; E-Flora BC; Electronic Atlas of Plants of BC; and from private data compilations(spreadsheets) and personal consultation with BC Ministry of Environment staff and other local experts, peer-reviewed articles and other unpublished technical reports. Full Citations are included
-
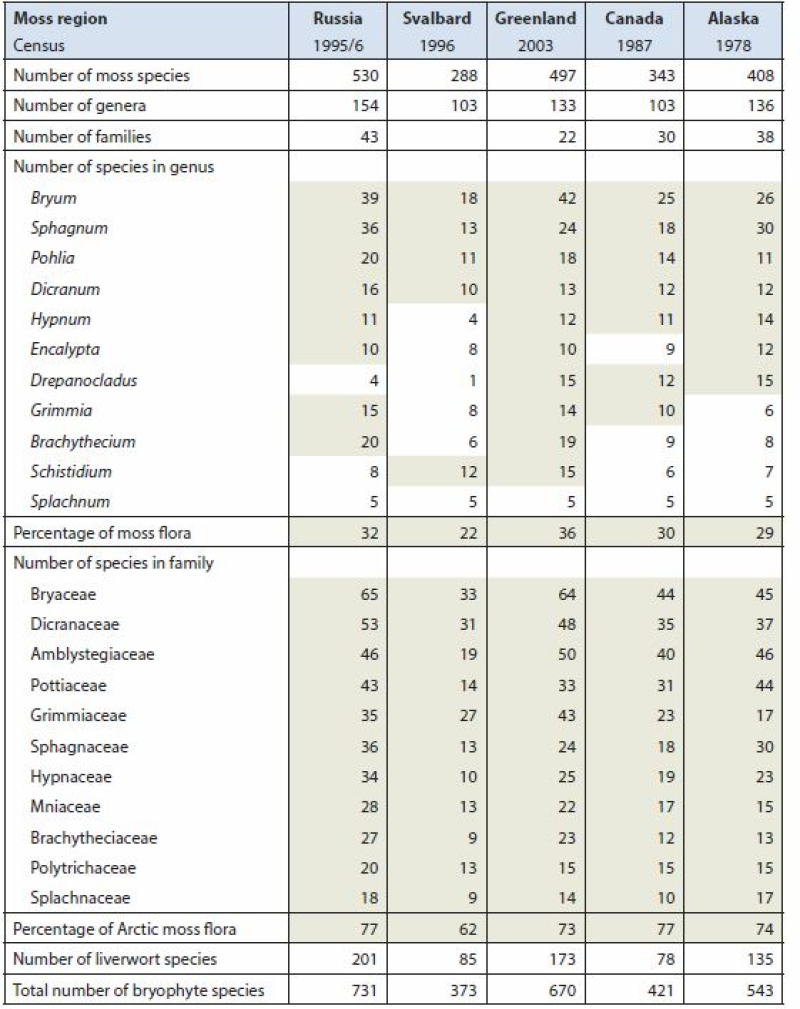
Arctic Biodiversity Assessment (ABA) 2013. Table 9.5. Species numbers of species-rich moss genera and families. Numbers highlighted in grey fields are used in calculating the percentage of the total moss flora. Listed are Splachnum, genera with at least 10 species and families with at least nine species. Conservation of Arctic Flora and Fauna, CAFF 2013 - Akureyri . Arctic Biodiversity Assessment. Status and Trends in Arctic biodiversity. - Plants(Chapter 9) page 333
-
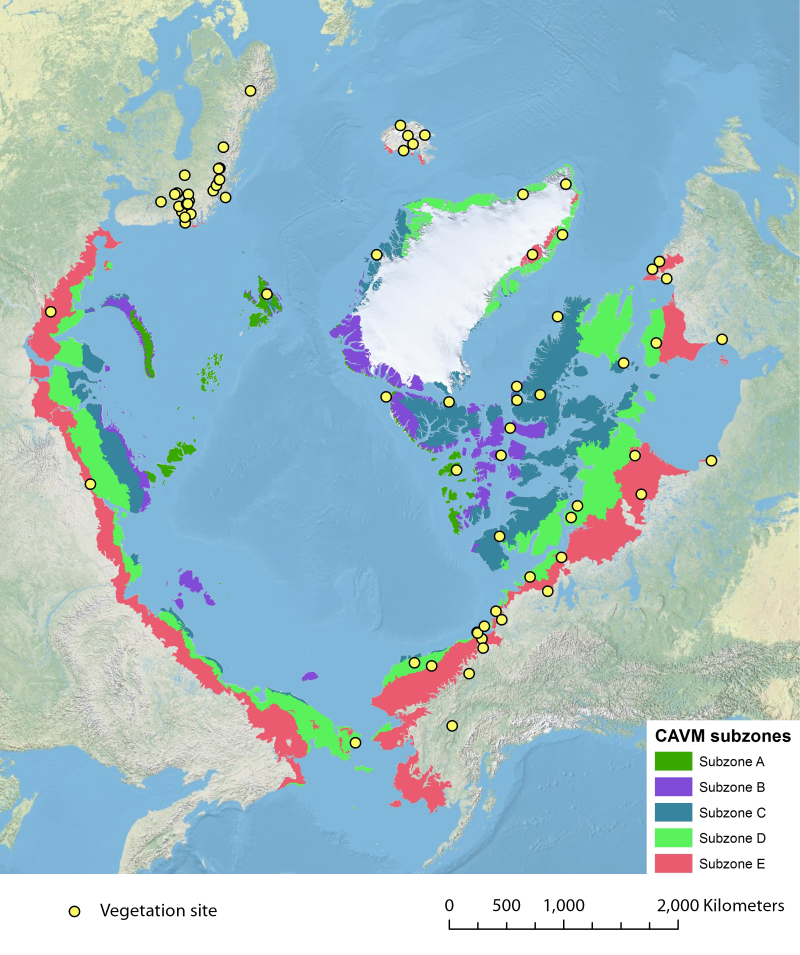
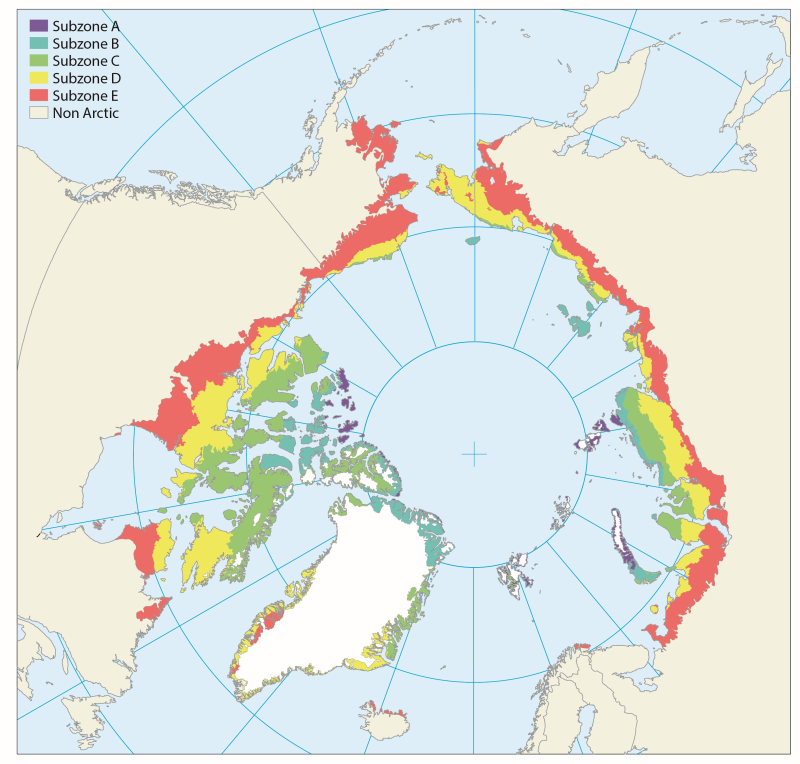
Location of long-term vegetation (including fungi, non-vascular and vascular plants) monitoring sites and programs. Comes from the Arctic Terrestrial Biodiversity Monitoring Plan is developed to improve the collective ability of Arctic traditional knowledge holders, northern communities and scientists to detect, understand and report on long-term change in Arctic terrestrial ecosystems and biodiversity. The report can be seen here http://www.caff.is/publications/view_document/256-arctic-terrestrial-biodiversity-monitoring-plan The monitoring locations are place over the Circumpolar Arctic bioclimate subzones (CAVM Team 2003) http://www.caff.is/flora-cfg/circumpolar-arctic-vegetation-map
-
Based on published scientific literature, the diversity of plants in the Arctic is reviewed. The plants are divided into three main groups according to essential differences in anatomy, morphology and reproduction. These are vascular plants, bryophytes (mosses and liverworts) and algae (micro- and macroalgae). As a whole, these three plant groups have the ability to perform photosynthesis. As primary producers they play a key role in the environment, since photosynthesis provides resources for all other organisms. Vascular plants and bryophytes (together with the lichenized fungi, the lichens) are the main structural components of terrestrial vegetation and ecosystems, while algae are more abundant in fresh water and marine ecosystems. Conservation of Arctic Flora and Fauna, CAFF 2013 - Akureyri . Arctic Biodiversity Assessment. Status and Trends in Arctic biodiversity. - Plants (Chapter 9)