 Arctic SDI catalogue
substrate
Type of resources
Available actions
Topics
Keywords
Contact for the resource
Provided by
Formats
Representation types
Update frequencies
status
-

These data sets provide information pertaining to epifauna and substrate estimates collected at dockside perimeters of floating docks located in Burrard Inlet and Fraser River Delta, British Columbia, between August and November, 2020. Data sets were compiled and formatted by Meagan Mak. Epifauna diversity was examined along surface perimeters of floating docks in Burrard Inlet and Fraser River Delta in southwestern British Columbia. Diversity estimates were obtained from video surveys collected over three depth-intervals: 1) Splash zone (SZ): depth-interval directly 15-cm above air-water interface; 2) Subsurface zone (SSZ): depth-interval (0-21 cm) below air-water interface; and 3) Deep-water zone (DZ): depth-interval below the SSZ (21-41 cm). Dock substrate consisted of combinations of wood, concrete, tires, plastic-floats, and metal, while epifauna and epiflora included anemones, tunicates, sponge, tube-worms, sea stars, bivalves, crabs, nudibranchs, urchins, barnacles, limpets, chitons, isopods, macroalgae and seagrass. Mussels ranged between 46% and 95% coverage across docks (median: 93%), while frequency of occurrence ranged between 85% and 100% (median: 99%), providing a biological-based substrate for other epifauna. The splash-zone consisted of outcropped mussels, encroached macroalgae from the waterline, and invertebrates above the waterline (limpets, chiton). If present, Ulva spp. typically formed a consistent narrow band (2-3 cm) above the waterline across all docks. Benthic (pipefish, sculpin) and pelagic (perch) fish were associated with epifaunal coverage and pelagic (open-water medium) settings. The Coast Guard Sea Island dock may experience episodic low-salinity intrusions supporting marine organisms at this site (ochre star, sculpin, limpet).
-

This dataset is derived from analyses of photo samples obtained by deploying drop camera photo (DCP) systems conducted during various research surveys in coastal areas of the north shore of the St. Lawrence Estuary and the Gulf between Portneuf-sur-Mer and Sept-Îles between June and October of 2019 to 2022. It contains 4866 species occurrence data of 109 different taxa for epibenthic invertebrates and submerged aquatic vegetation (including algae) at depths ranging from 0 to more than 50 meters. Additional information about this dataset is available in the “Method step description” section. The research surveys were undertaken by the Department of Fisheries and Oceans Canada as part of the baseline program of the Ocean Protection Plan. This initiative aims to acquire environmental baseline data contributing to the characterization of important coastal areas and to support evidence-based assessments and management decisions for preserving marine ecosystems. Data acquired during the research surveys additionally include: 1) fish and invertebrate species occurrence data derived from analyses of video samples collected using a stereoscopic baited remote underwater camera video systems (stereo-BRUVs) 2) fish and invertebrates catch data from beam trawl sampling (occurrence and catch weights by species), 3) substrate classification based on drop camera samples, 4) oceanographic measurements of the water column from Seabird 19plus V2 profiling CTD (conductivity, temperature, depth, photosynthetic active radiation, pH, dissolved oxygen), 5) nutrients (NO2, NO3, NH4, PO4, SiO3) and dissolve organic carbon (DOC) concentrations, and 6) current speed and direction from tilt meters. The datasets of the first two elements will also be available as independent datasets on the OBIS/GBIF portal. To obtain data from items 3-6 and/or biological data collected on fish and invertebrate taxa, please contact David Lévesque or Marie-Julie Roux. The elaboration of conservation objectives based on an ecosystem assessment approach for fishery stock assessment requires the development of sampling methods to maximize the data collection on the ecosystem, while minimizing the impact on organisms and the marine environment. This project aims at characterising the coastal ecosystem of the St. Lawrence Estuary and Gulf between Portneuf-sur-Mer and Sept-Îles (QC), including the physico-chemistry of water, phytoplankton, zooplankton, submerged vegetation, benthic habitats as well as assemblages of fish and invertebrates. Sampling was performed by combining conventional methods such as CTD profiling, zooplankton nets, and beam trawl, with non-extractive methods such as drop camera photo (DCP) and stereoscopic baited remote underwater camera video systems (stereo-BRUVs). The data collected will help define baseline ecosystem conditions in the study area; explore the links between environmental conditions, habitat structure and biological assemblages; identify important habitats for marine species; as well as the evaluation of the performance of visual sampling methods compared to conventional methods. The results will make it possible to optimize the seasonal or annual monitoring in order to better understand the direct and indirect effects of human activities in coastal environments. Method Step Description: 1. Acquisition of photo samples in sequence: The drop camera photo (DCP) system used to sample underwater pictures is a stainless steel frame in the shape of a triangular prism of 50 cm wide, 100 cm long and 76 cm high at the level of the central eyelet. The sampling area is a quadrat of 0.25 m2 (interior dimensions of 50 cm by 50 cm). The system consists of two GoPro Hero 5 cameras (4000 × 3000 pixels) and two 8000 lumens dive lights (Big Blue VL8000). The first camera captures the elements located in the quadrat when viewed from above. The second camera offers an oblique view facilitating the evaluation of the elements present in the quadrat. At all sampling stations, five to nine system deployments (replicas) capturing photos every 10 seconds for 60 to 120 seconds were performed. Surveys took place between : June 28th to July 5th 2019 July 13th to July 20th 2019 September 30th to October 9th 2019 August 10th to August 20th 2020 October 1st to October 10th 2020 April 22nd to May 5th 2021 July 27th to August 10th 2021 October 15th to October 24th 2021 June 24th to Jully 5th 2022 August 15th to August 26th 2022 2. Image analysis: A photo image analysis method with sequence (moving images) was used for the occurrence data extraction and organism counts; measurements were taken to obtain vegetation cover percentages and substrate analyzes were also carried out. Analyzes were performed with the open-source Fiji software from ImageJ. A quality/visibility rating was assigned to the analyzed image sequences. 3. Taxonomic approach: Epibenthic organisms were identified at the lowest possible taxonomic rank. A morphotype approach has been systematically used (during annotations) for the identification of sponges, hydrozoans and bryozoans, and occasionally for other organisms such as algae. Species codes were also used to distinguish certain species that could not be identified at the time of the annotations (see verbatim Identification). To eliminate observer bias, the same person analyzed all images used in this database. The organisms were identified from underwater images using a combination of identification guides and scientific papers. 4. Open nomenclature: The concept of open nomenclature has been integrated into occurrence data to support taxonomic identifications with their level of certainty, as recommended by Horton et al., 2021. The abbreviation stet. (stetit) was used when the decision not to go lower was made but an identification might be possible, whereas indet (Indeterminabilis) was used when a lower level identification was considered uncertain or impossible (see identificationqualifier). In addition, the abbreviation Confer (cf.) was used and integrated into the data tables (see occurrenceRemarks) in order to link identifications that could potentially and/or possibly be associated. 5. Remarks: Several remarks have also been incorporated (see organismRemarks, identificationRemarks and taxonRemarks), and are intended to provide additional information that may be useful to some data users; Please note that these sections could be modified or improved. 6. Quality control: The taxonomic identifications were verified through a validation process, in collaboration with various expert taxonomists. All scientific names have been checked against the World Register of Marine Species (WoRMS) to match currently recognized standards. The WoRMS match was placed in the taxonID field of the instance file. Data quality control was performed using Robistools and worms packages. All sample locations were plotted on a map for visual verification that the latitude and longitude coordinates were within the described sample area. 7. Data sharing: Only metadata and biodiversity occurrence data are shared in this dataset. The two files provided (DarwinCore format) are complementary and are linked by the "eventID" key. The "event" file includes generic event information, including date and location. The "occurrence" file includes the original identifiers of the observed organisms, identification comments and their taxonomy. A data dictionary is also provided to explain the fields used. For access to other data or images, contact David Lévesque. For more details about the project and the methodology, a technical report (Scallon-Chouinard et al., 2022) including sampling methods with drop camera photo systems (DCP) and stereoscopic baited remote underwater camera video systems (stereo-BRUVs) is currently available online (https://waves-vagues.dfo-mpo.gc.ca/library-bibliotheque/41081225.pdf); another technical report detailing photo and video image analysis methods will also be available. This project was funded by the Department of Fisheries and Oceans Canada as part of the baseline program of the Ocean Protection Plan.
-

This dataset derives from a series of beam trawl tows conducted during several research surveys in coastal areas of the St. Lawrence Estuary, between Portneuf-sur-Mer and Pointe-des-Monts, and between June and October of 2019, 2020, 2021 and 2022. It contains catch data for fish and invertebrates (occurrence and catch weights by species), in trawl tows conducted at depths ranging from 10 to 50 meters. Data were collected in various cruises: • June 28th to July 5th 2019 (NGCC Leim) • September 30th to October 9th 2019 (NGCC Leim) • October 1st to October 10th 2020 (NGCC Leim) • April 22nd to May 5th 2021 (NGCC Perley) • October 15th to October 24th 2021 (NGCC Perley) • June 24th to July 15th 2022 (NGCC LEIM) The beam trawl used to generate this data set consists of a frame (width of 2.8 m, height of 0.8 m) equipped with a 6.5 m long net with 40 mm diamond mesh, which is lined with a net (skirt) of square mesh (5 mm) at the cod-end (length 2 m) and a protective apron (75 mm mesh) on the ventral portion. Three skid chains are linked at the base of the skates. Each station corresponds to a 5 to 10 minutes tow along an isobath at a speed of about 2 knots. At each haul, the trawl catch was placed on a sorting table on the deck and the organisms were sorted and identified at the best possible taxonomic resolution. Most taxa were independently weighed. Some invertebrates taxa were subsampled, counted and weighted in order to estimate their contribution (weight and number) to the total catch. Additionally, the first 30 fish of each species were measured and weighed individually. Taxonomic names were verified on the World Register of Marine Species (WoRMS) to match recognized standards. The WoRMS match has been put in the scientificNameID field in the occurrence file. Data quality control was performed using the R packages obistools and worrms. All sampling locations were plotted on a map to perform a visual check confirming that the latitude and longitude coordinates were within the described sampling area. Data acquired during the research surveys additionally included: 1) occurrence data on epibenthic invertebrates and submerged aquatic vegetation in photo samples from a drop camera system, 2) occurrence data on fish and invertebrate taxa in video samples collected using a baited underwater video system (BUV), 3) substrate classification based on drop camera photo samples, 4) oceanographic measurements of the water column from Seabird 19plus V2 profiling CTD (conductivity, temperature, depth, photosynthetic active radiation, pH, dissolved oxygen), 5) nutrients (NO2, NO3, NH4, PO4, SiO3) and dissolve organic carbon (DOC) concentrations, and 6) current speed and direction from tilt meters. The first two items are available as independent data on the OBIS portal. To obtain data from items 3-6 and/or biological data collected on fish and invertebrate taxa, please contact David Lévesque or Marie-Julie Roux. The research surveys were undertaken by the Department of Fisheries and Oceans Canada as part of the baseline program of the Ocean Protection Plan. This initiative aimed to acquire environmental baseline data contributing to the characterization of important coastal areas and in support of evidence-based assessments and management decision-making for preserving marine ecosystems. Which contribute to the elaboration of conservation objectives based on an ecosystem assessment approach for fishery stock assessment requires the development of sampling methods to maximize the data collection on the ecosystem, while minimizing the impact on organisms and the marine environment. This project aims at characterising the coastal ecosystem of the St. Lawrence Estuary between Portneuf-sur-Mer and Godbout (QC), including the physico-chemistry of water, phytoplankton, zooplankton, submerged vegetation, benthic habitats as well as assemblages of fish and invertebrates. Sampling was performed by combining conventional methods such as CTD profiling, zooplankton nets, and beam trawl, with non-extractive methods such as dropped photo cameras and stereoscopic baited video camera systems. The data collected will help define baseline ecosystem conditions in the study area; explore the links between environmental conditions, habitat structure and biological assemblages; identify important habitats for marine species; as well as the evaluation of the performance of visual sampling methods compared to conventional methods. The results will make it possible to optimize the seasonal or annual monitoring in order to better understand the direct and indirect effects of human activities in coastal environments. This project was funded by the Department of Fisheries and Oceans Canada as part of the baseline program of the Ocean Protection Plan.
-
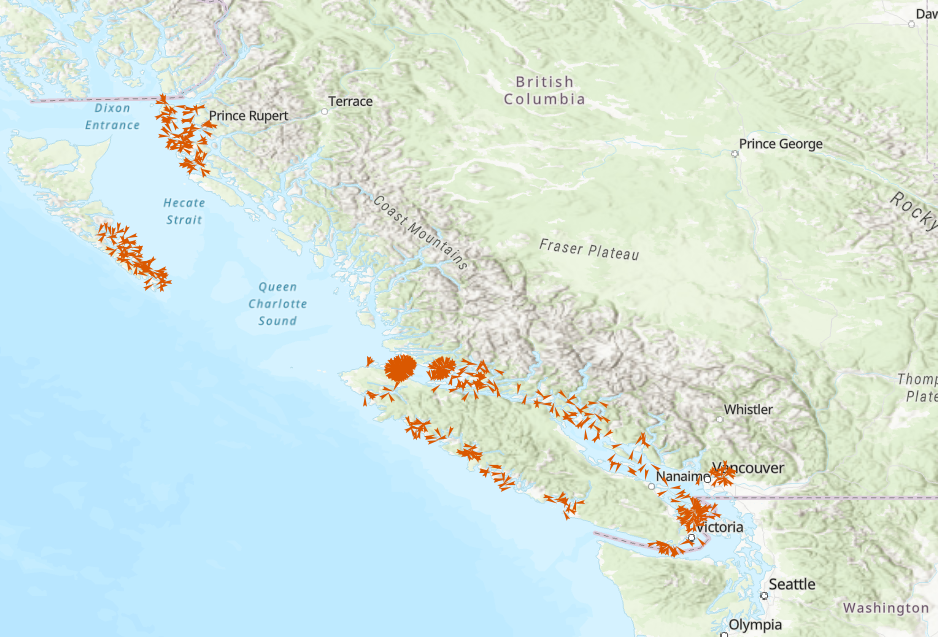
The Department of Fisheries and Oceans (DFO) Science Branch has designed a multispecies dive survey protocol to provide unbiased, coast wide monitoring of benthic invertebrate stocks (as may be required under the updated Fisheries Act) and associated habitat information for a suite of benthic marine invertebrate species (Green (Strongylocentrotus droebachiensis), Purple (S. purpuratus) and Red Sea Urchin (Mesocentrotus franciscanus), Geoduck (Panopea generosa), Giant Red Sea Cucumber (Apostichopus californicus), Northern Abalone (Haliotis kamtschatkana), and Sunflower Sea Star (Pycnopodia helianthoides)). Based on information available at this time, the proposed survey design can provide estimates of coast wide stock status for Red Sea Urchin and Giant Red Sea Cucumber, and relative abundance indices for Geoduck, Green Sea Urchin, Purple Sea Urchin, Northern Abalone and Sunflower Sea Star. The new protocol was tested through a series of pilot surveys conducted on a subset of areas of the BC coast each September from 2016-2021. Design of the pilot surveys was based on previous dive survey data and experience and demonstrated the practical feasibility of the protocol, while also gathering preliminary information to guide recommendations about the statistical design of the survey. The dataset consists of a relational database containing tables representing each component of the survey methodology. The primary component of the survey is a transect location. Along each transect, systematically spaced quadrats are sampled, and on each quadrat, substrate observations are recorded, multiple species of algae are recorded, and multiple individual invertebrates are measured or counted. The tables are linked by transect number and quadrat number.
-

Terrestrial Ecosystem Mapping (TEM) project boundaries contains (study areas) and attributes describing each project (project level metadata), plus links to the locations of other data associated with the project (e.g., reports, polygon datasets, plotfiles, field data, legends).TEM divides the landscape into units according to a variety of ecological features including climate, physiography, surficial material, bedrock geology, soils and vegetation. This layer is derived from the STE_TEI_PROJECT_BOUNDARIES_SP layer by filtering on the PROJECT_TYPE attribute. Project Types include: TEM, NEM, TEMNSS, NEMNSS, TEMPRE, NEMPRE, TEMSEI, TEMSET, TEMTSM, TEMWHR, TEMSDM, TEMPRW, NEMPRW, and TEMSEW. Current version: v11 (published on 2024-10-03) Previous versions: v10 (published on 2023-11-14), v9 (published on 2023-03-01), v8 (published on 2016-09-01)
-
Terrain Mapping (TER) project boundaries contains (study areas) and attributes describing each project (project level metadata), plus links to the locations of other data associated with the project (e.g., reports, polygon datasets, plotfiles, legends) for terrain inventory, bioterrain and terrain stability mapping projects. TER divides the landscape into units according to surficial materials, landforms and geomorphological processes using the Terrain Classification System for British Columbia. This layer is derived from the STE_TEI_PROJECT_BOUNDARIES_SP layer by filtering on the PROJECT_TYPE attribute. Project types include: TEM, TEMNSS, TEMPRE, TEMSEI, TEMSET, TEMTSM, TSM, TSMREC, TSMDET, TIM, TBS, TBT, TIMSOI, TEMWHR, TEMSDM, TEMPRW, NEMPRW, and TEMSEW. Current version: v11 (published on 2024-10-03) Previous versions: v10 (published on 2023-11-14), v9 (published on 2023-03-01), v8 (published on 2016-09-01)