 Arctic SDI catalogue
Polar Scientific Research Institute of Fishery and Oceanography
Type of resources
Available actions
Topics
Keywords
Contact for the resource
Provided by
Years
Formats
Resolution
-
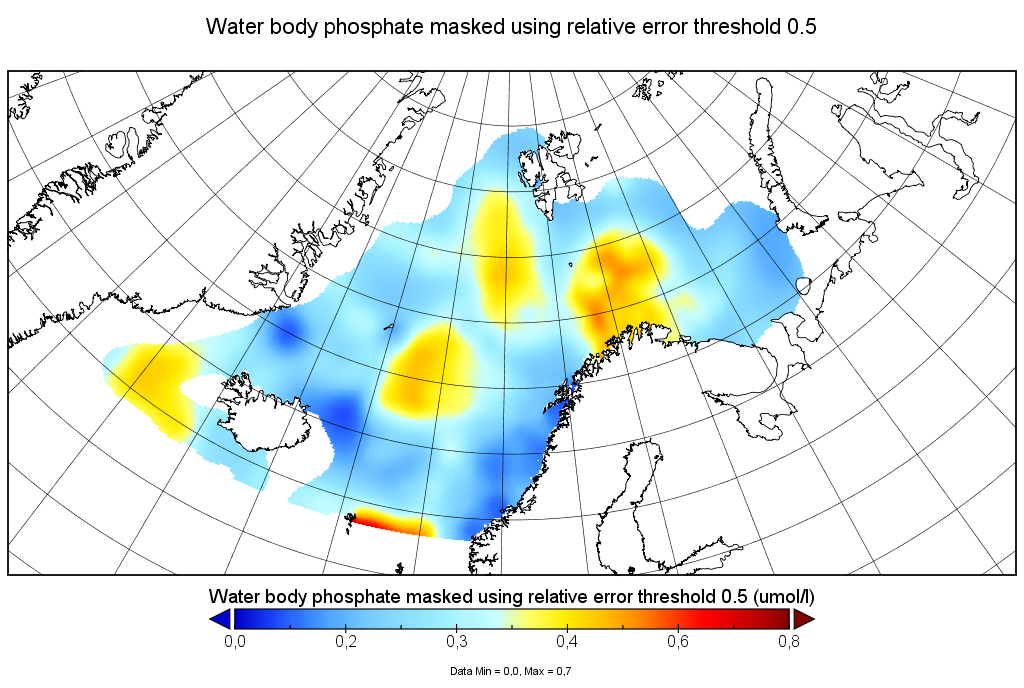
Moving 6-year analysis of Water body phosphate in the Arctic Ocean, for each season in the period 1965-2017. Every year of the time dimension corresponds to the 6-year centered average for each season. Winter: December-February, Spring: March-May, Summer: June-August, Autumn: September-November. Depth range (IODE standard depths): 0, 5, 10, 20, 30, 40, 50, 75, 100, 125, 150, 200, 250, 300, 400, ..., 1500, 1750, 2000, 2500m. Units: umol/l. Description of DIVA analysis: The computation was done with the DIVAnd (Data-Interpolating Variational Analysis in n dimensions), version 2.6.6, using GEBCO 30sec topography for the spatial connectivity of water masses. The horizontal resolution of the produced DIVAnd maps grids is 0.1 degrees. Signal-to-noise ratio was fixed to 2.0, horizontal correlation length to 100 km, and vertical correlation length varying between 25 and 200 m. Logarithmic transformation is applied to the data prior to the analysis. Background field: the data mean value is subtracted from the data.
-
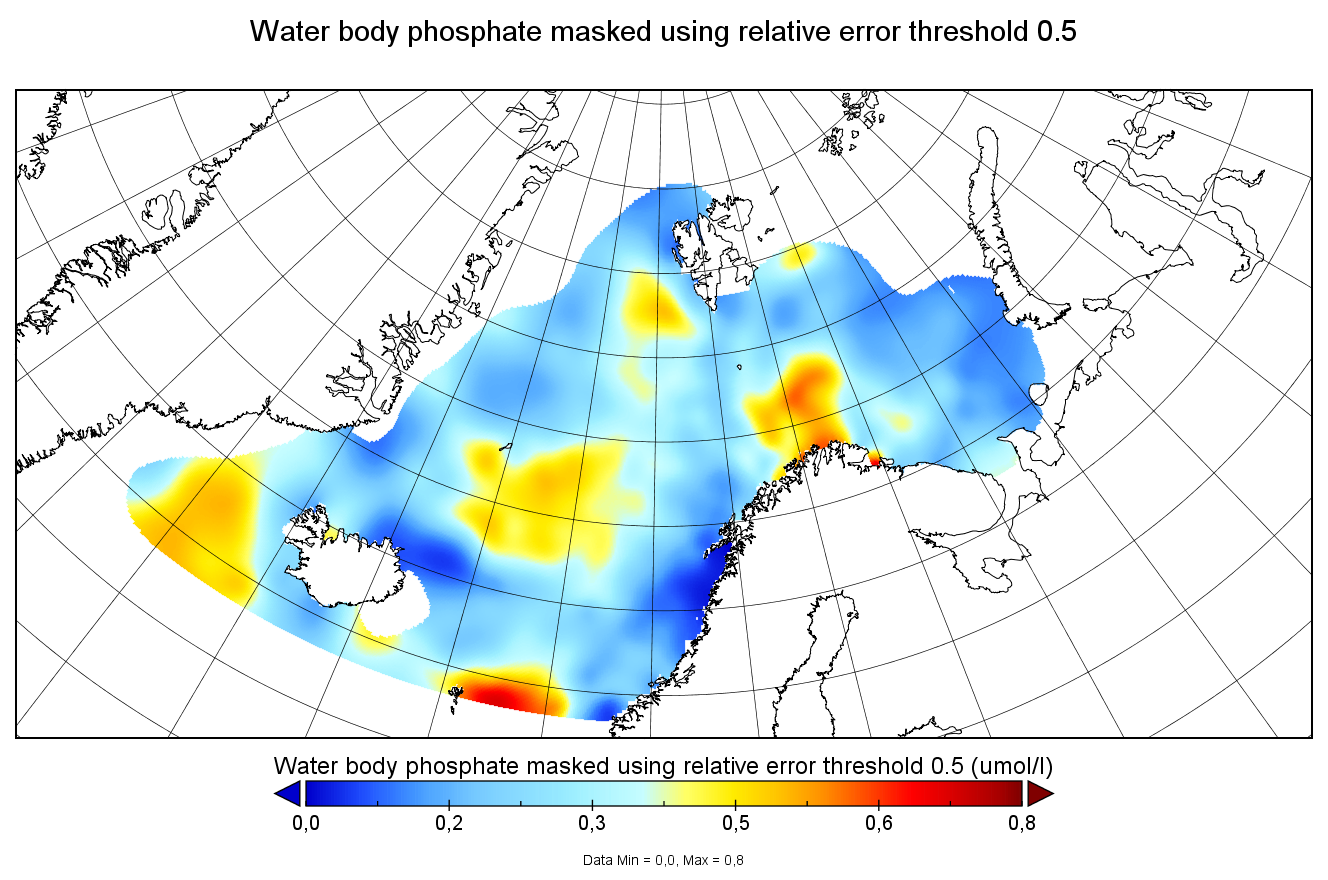
Moving 6-year analysis of phosphate in the Arctic Ocean, for each season in the period 1970-2017. Every year of the time dimension corresponds to the 6-year centered average for each season. Winter: December-February, Spring: March-May, Summer: June-August, Autumn: September-November. Depth range (IODE standard depths): 0, 5, 10, 20, 30, 40, 50, 75, 100, 125, 150, 200, 250, 300, 400, ..., 1500, 1750, 2000, 2500m. Units: umol/l. Description of DIVA analysis: The computation was done with DIVAnd (Data-Interpolating Variational Analysis in n dimensions), version 2.7.9, using GEBCO 30sec topography for the spatial connectivity of water masses. The horizontal resolution of the produced DIVAnd maps grids is 0.1 degrees. Signal-to-noise ratio was fixed to 3.0, horizontal correlation length varying from 45 km near the coast to 150 km, and vertical correlation length varying between 25 and 1000 m. Logarithmic transformation is applied to the data prior to the analysis. Background field: analysis with signal-to-noise ratio = 10, horizontal correlation length 60-200 km, and vertical correlation length 25-1000 m.
-

Moving 6-year analysis of phosphate in the Arctic Ocean, for each season in the period 1965-2024. Every year of the time dimension corresponds to the 6-year centered average for each season. Winter: December-February, Spring: March-May, Summer: June-August, Autumn: September-November. Depth range (IODE standard depths): 0, 5, 10, 20, 30, 40, 50, 75, 100, 125, 150, 200, 250, 300, 400, ..., 1500, 1750, 2000, 2500m. Units: umol/l. Description of DIVA analysis: The computation was done with DIVAnd (Data-Interpolating Variational Analysis in n dimensions), version 2.7.13, using GEBCO 30sec topography for the spatial connectivity of water masses. The horizontal resolution of the produced DIVAnd maps grids is 0.125 degrees. Signal-to-noise ratio was fixed to 3.0, horizontal correlation length varying from 45 km near the coast to 150 km, and vertical correlation length varying between 25 and 1000 m. Logarithmic transformation is applied to the data prior to the analysis. Background field: analysis with signal-to-noise ratio = 20, horizontal correlation length 50-200 km, and vertical correlation length 25-1000 m.
-

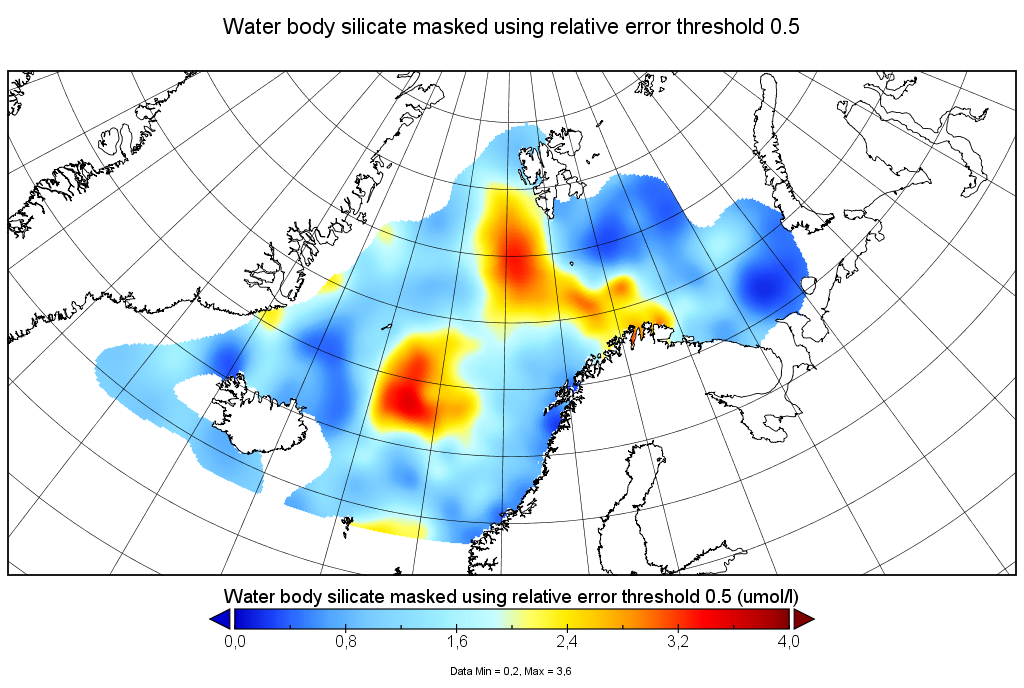
Moving 6-year analysis of silicate in the Arctic Ocean, for each season in the period 1970-2024. Every year of the time dimension corresponds to the 6-year centered average for each season. Winter: December-February, Spring: March-May, Summer: June-August, Autumn: September-November. Depth range (IODE standard depths): 0, 5, 10, 20, 30, 40, 50, 75, 100, 125, 150, 200, 250, 300, 400, ..., 1500, 1750, 2000, 2500m. Units: umol/l. Description of DIVA analysis: The computation was done with DIVAnd (Data-Interpolating Variational Analysis in n dimensions), version 2.7.13, using GEBCO 30sec topography for the spatial connectivity of water masses. The horizontal resolution of the produced DIVAnd maps grids is 0.125 degrees. Signal-to-noise ratio was fixed to 3.0, horizontal correlation length varying from 45 km near the coast to 150 km, and vertical correlation length varying between 25 and 1000 m. Logarithmic transformation is applied to the data prior to the analysis. Background field: analysis with signal-to-noise ratio = 20, horizontal correlation length 50-200 km, and vertical correlation length 25-1000 m.
-
Moving 6-year analysis of silicate in the Arctic Ocean, for each season in the period 1970-2017. Every year of the time dimension corresponds to the 6-year centered average for each season. Winter: December-February, Spring: March-May, Summer: June-August, Autumn: September-November. Depth range (IODE standard depths): 0, 5, 10, 20, 30, 40, 50, 75, 100, 125, 150, 200, 250, 300, 400, ..., 1500, 1750, 2000, 2500m. Units: umol/l. Description of DIVA analysis: The computation was done with DIVAnd (Data-Interpolating Variational Analysis in n dimensions), version 2.7.9, using GEBCO 30sec topography for the spatial connectivity of water masses. The horizontal resolution of the produced DIVAnd maps grids is 0.1 degrees. Signal-to-noise ratio was fixed to 3.0, horizontal correlation length varying from 45 km near the coast to 150 km, and vertical correlation length varying between 25 and 1000 m. Logarithmic transformation is applied to the data prior to the analysis. Background field: analysis with signal-to-noise ratio = 10, horizontal correlation length 60-200 km, and vertical correlation length 25-1000 m.
-
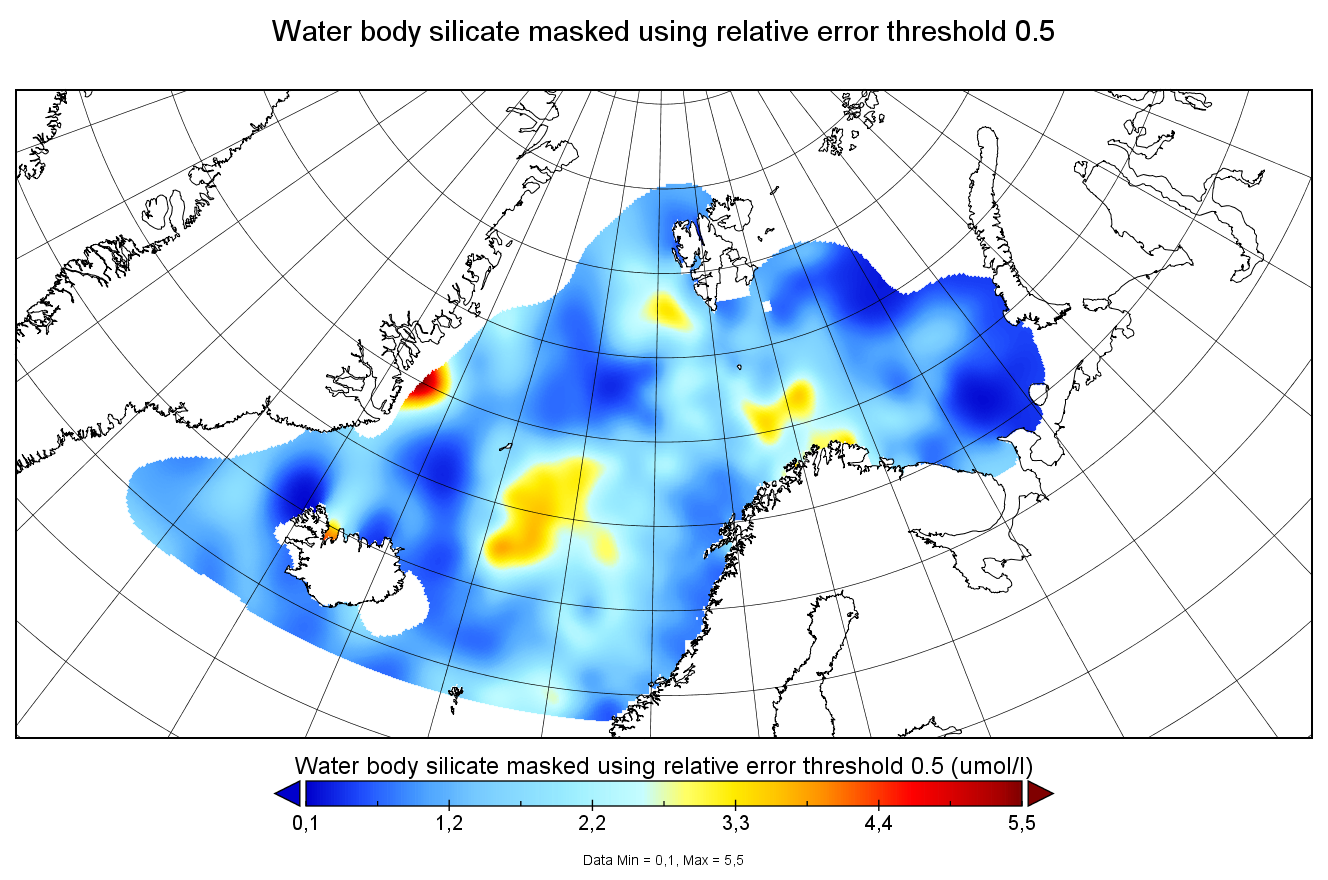
Moving 6-year analysis of Water body silicate in the Arctic Ocean, for each season in the period 1965-2017. Every year of the time dimension corresponds to the 6-year centered average for each season. Winter: December-February, Spring: March-May, Summer: June-August, Autumn: September-November. Depth range (IODE standard depths): 0, 5, 10, 20, 30, 40, 50, 75, 100, 125, 150, 200, 250, 300, 400, ..., 1500, 1750, 2000, 2500m. Units: umol/l. Description of DIVA analysis: The computation was done with the DIVAnd (Data-Interpolating Variational Analysis in n dimensions), version 2.6.6, using GEBCO 30sec topography for the spatial connectivity of water masses. The horizontal resolution of the produced DIVAnd maps grids is 0.1 degrees. Signal-to-noise ratio was fixed to 2.0, horizontal correlation length to 100 km, and vertical correlation length varying between 25 and 200 m. Logarithmic transformation is applied to the data prior to the analysis. Background field: the data mean value is subtracted from the data.
-

Moving 6-year analysis of dissolved oxygen concentration in the Arctic Ocean, for each season in the period 1965-2024. Every year of the time dimension corresponds to the 6-year centered average for each season. Winter: December-February, Spring: March-May, Summer: June-August, Autumn: September-November. Depth range (IODE standard depths): 0, 5, 10, 20, 30, 40, 50, 75, 100, 125, 150, 200, 250, 300, 400, ..., 1500, 1750, 2000, 2500m. Units: umol/l. Description of DIVA analysis: The computation was done with DIVAnd (Data-Interpolating Variational Analysis in n dimensions), version 2.7.13, using GEBCO 30sec topography for the spatial connectivity of water masses. The horizontal resolution of the produced DIVAnd maps grids is 0.125 degrees. Signal-to-noise ratio was fixed to 3.0, horizontal correlation length varying from 45 km near the coast to 150 km, and vertical correlation length varying between 25 and 1000 m. Logarithmic transformation is applied to the data prior to the analysis. Background field: analysis with signal-to-noise ratio = 20, horizontal correlation length 50-200 km, and vertical correlation length 25-1000 m.
-
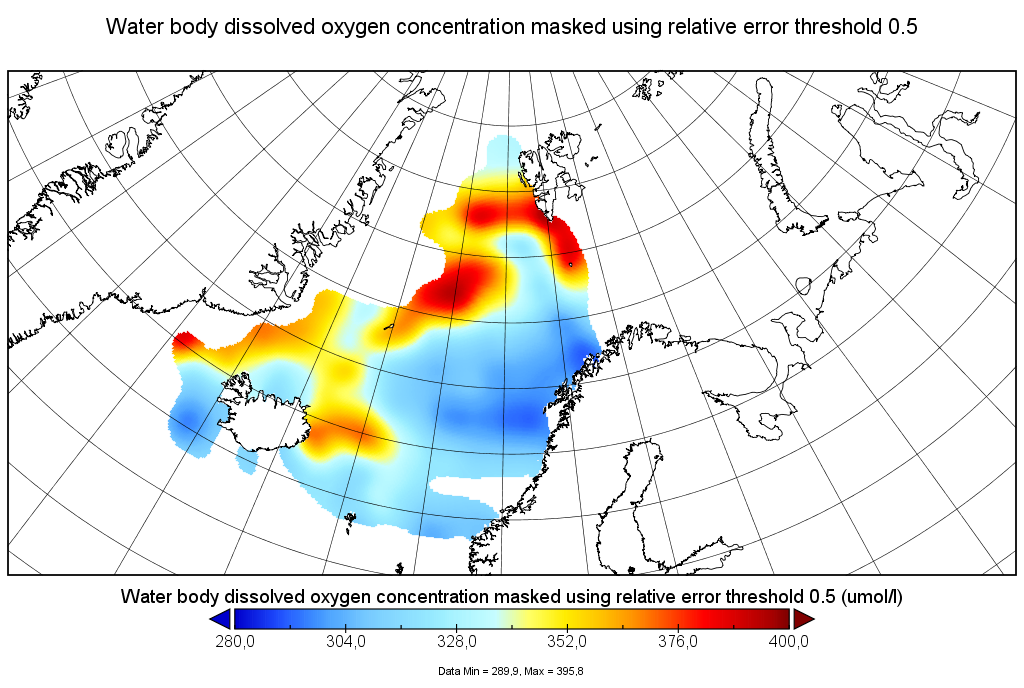
Moving 6-year analysis of Water body dissolved oxygen concentration in the Arctic Ocean, for each season in the period 1965-2017. Every year of the time dimension corresponds to the 6-year centered average for each season. Winter: December-February, Spring: March-May, Summer: June-August, Autumn: September-November. Depth range (IODE standard depths): 0, 5, 10, 20, 30, 40, 50, 75, 100, 125, 150, 200, 250, 300, 400, ..., 1500, 1750, 2000, 2500m. Units: umol/l. Description of DIVA analysis: The computation was done with the DIVAnd (Data-Interpolating Variational Analysis in n dimensions), version 2.6.6, using GEBCO 30sec topography for the spatial connectivity of water masses. The horizontal resolution of the produced DIVAnd maps grids is 0.1 degrees. Signal-to-noise ratio was fixed to 2.0, horizontal correlation length to 100 km, and vertical correlation length varying between 25 and 200 m. Logarithmic transformation is applied to the data prior to the analysis. Background field: the data mean value is subtracted from the data.
-
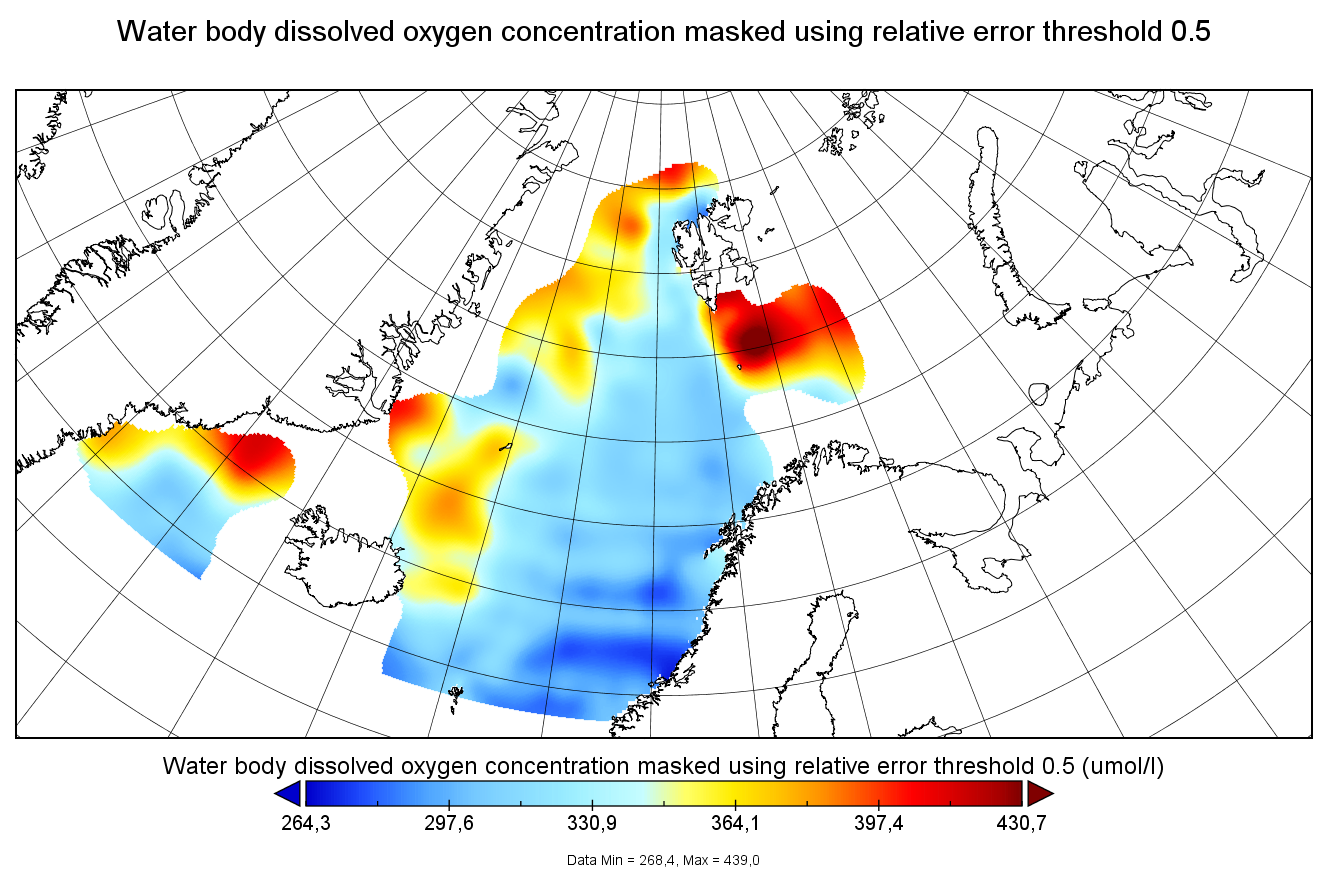
Moving 6-year analysis of dissolved oxygen concentration in the Arctic Ocean, for each season in the period 1965-2022. Every year of the time dimension corresponds to the 6-year centered average for each season. Winter: December-February, Spring: March-May, Summer: June-August, Autumn: September-November. Depth range (IODE standard depths): 0, 5, 10, 20, 30, 40, 50, 75, 100, 125, 150, 200, 250, 300, 400, ..., 1500, 1750, 2000, 2500m. Units: umol/l. Description of DIVA analysis: The computation was done with DIVAnd (Data-Interpolating Variational Analysis in n dimensions), version 2.7.9, using GEBCO 30sec topography for the spatial connectivity of water masses. The horizontal resolution of the produced DIVAnd maps grids is 0.1 degrees. Signal-to-noise ratio was fixed to 3.0, horizontal correlation length varying from 45 km near the coast to 150 km, and vertical correlation length varying between 25 and 1000 m. Logarithmic transformation is applied to the data prior to the analysis. Background field: analysis with signal-to-noise ratio = 10, horizontal correlation length 60-200 km, and vertical correlation length 25-1000 m.
-
Moving 6-year analysis and visualization of Water body silicate in the North Sea. Four seasons (December-February, March-May, June-August, September-November). Data Sources: observational data from SeaDataNet/EMODnet Chemistry Data Network. Description of DIVA analysis: Geostatistical data analysis by DIVAnd (Data-Interpolating Variational Analysis) tool, version 2.7.9. results were subjected to the minfield option in DIVAnd to avoid negative/underestimated values in the interpolated results; error threshold masks L1 (0.3) and L2 (0.5) are included as well as the unmasked field. The depth dimension allows visualizing the gridded field at various depths.