 Arctic SDI catalogue
2026
Type of resources
Categories
Available actions
Topics
Keywords
Contact for the resource
Provided by
Years
Formats
Update frequencies
Service types
Scale
Resolution
-
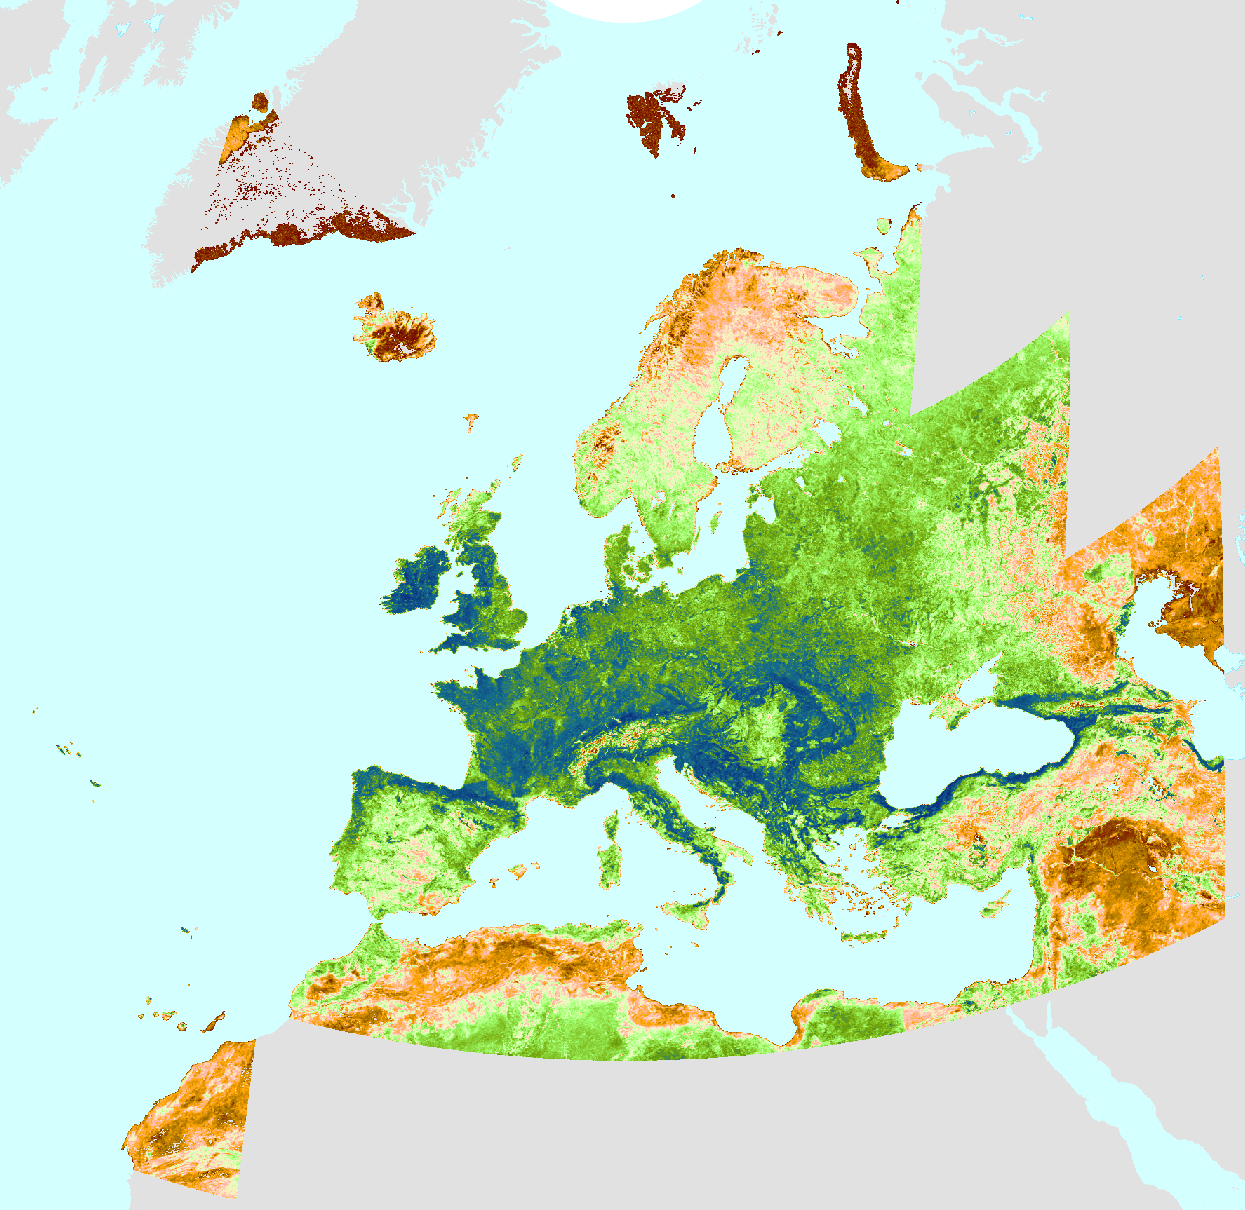
The seasonal productivity (SPROD), one of the Vegetation Phenology and Productivity (VPP) parameters, is a product of the pan-European Medium Resolution Vegetation Phenology and Productivity (MR-VPP) component of the Copernicus Land Monitoring Service (CLMS). The SPROD defined as the cumulative sum of daily deviations from the base level between the start and end of the growing season. The Plant Phenology Index (PPI) is a physically based vegetation index, developed for improving the monitoring of the vegetation growth cycle. The PPI index values, withwith daily inputs, are first used in a function fitting to derive the PPI Seasonal Trajectories. From these Seasonal Trajectories, a suite of 13 Vegetation Phenology and Productivity (VPP) parameters are then computed and provided, for up to two seasons each year. The SPROD is one of the 13 parameters. The SPROD time series dataset is made available as raster files with 500 x 500m resolution, in ETRS89-LAEA projection corresponding to the MCD43 tiling grid.
-
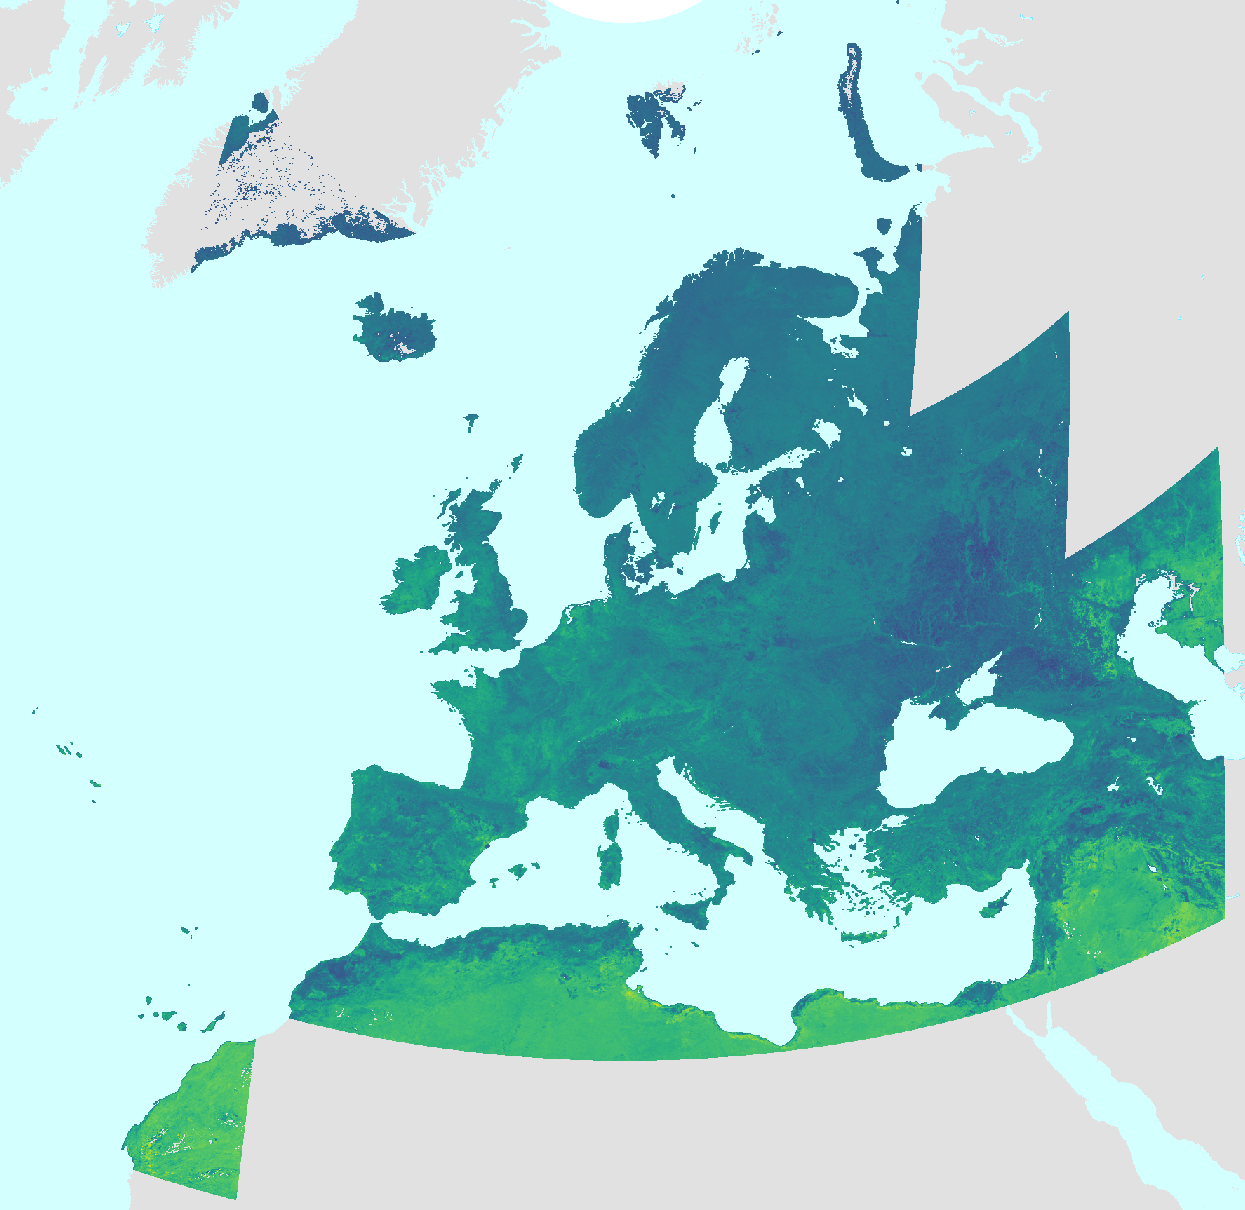
The season length (LENGTH), one of the Vegetation Phenology and Productivity (VPP) parameters, is a product of the pan-European High Resolution Vegetation Phenology and Productivity (MR-VPP) component of the Copernicus Land Monitoring Service (CLMS). The LENGTH is the number of days between the start and end dates of the vegetation growing season in the time profile of the Plant Phenology Index (PPI). The Plant Phenology Index (PPI) is a physically based vegetation index, developed for improving the monitoring of the vegetation growth cycle. The PPI index values, withwith daily inputs, are first used in a function fitting to derive the PPI Seasonal Trajectories. From these Seasonal Trajectories, a suite of 13 Vegetation Phenology and Productivity (VPP) parameters are then computed and provided, for up to two seasons each year. The LENGTH is one of the 13 parameters. The LENGTH time series dataset is made available as raster files with 392 x 392m resolution, in ETRS89-LAEA projection corresponding to the MCD43 tiling grid. IMPORTANT: The full access to open and free data for this resource will be made available upon request.
-
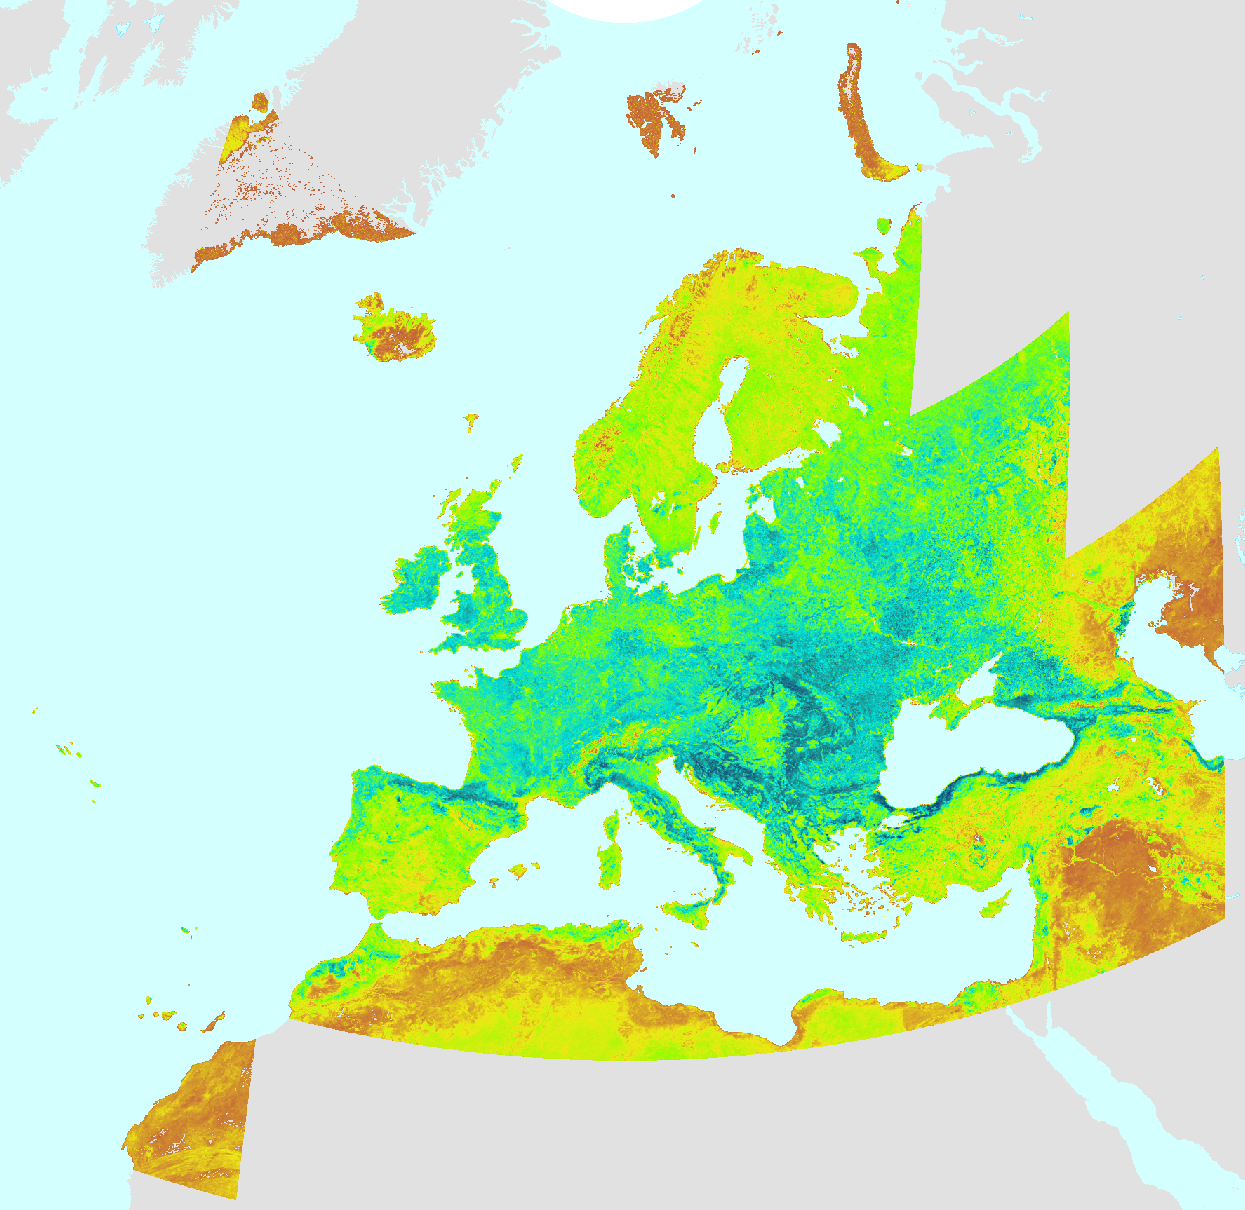
The season amplitude (AMPL), one of the Vegetation Phenology and Productivity (VPP) parameters, is a product of the pan-European Medium Resolution Vegetation Phenology and Productivity (MR-VPP) component of the Copernicus Land Monitoring Service (CLMS). The AMPL is the difference between the maximum and minimum Plant Phenology Index (PPI) values reached during the season. The Plant Phenology Index (PPI) is a physically based vegetation index, developed for improving the monitoring of the vegetation growth cycle. The PPI index values, with daily inputs, are first used in a function fitting to derive the PPI Seasonal Trajectories. From these Seasonal Trajectories, a suite of 13 Vegetation Phenology and Productivity (VPP) parameters are then computed and provided, for up to two seasons each year. The AMPL is one of the 13 parameters. The AMPL time series dataset is made available as raster files with 500 x 500m resolution, in ETRS89-LAEA projection corresponding to the MCD43 tiling grid.
-
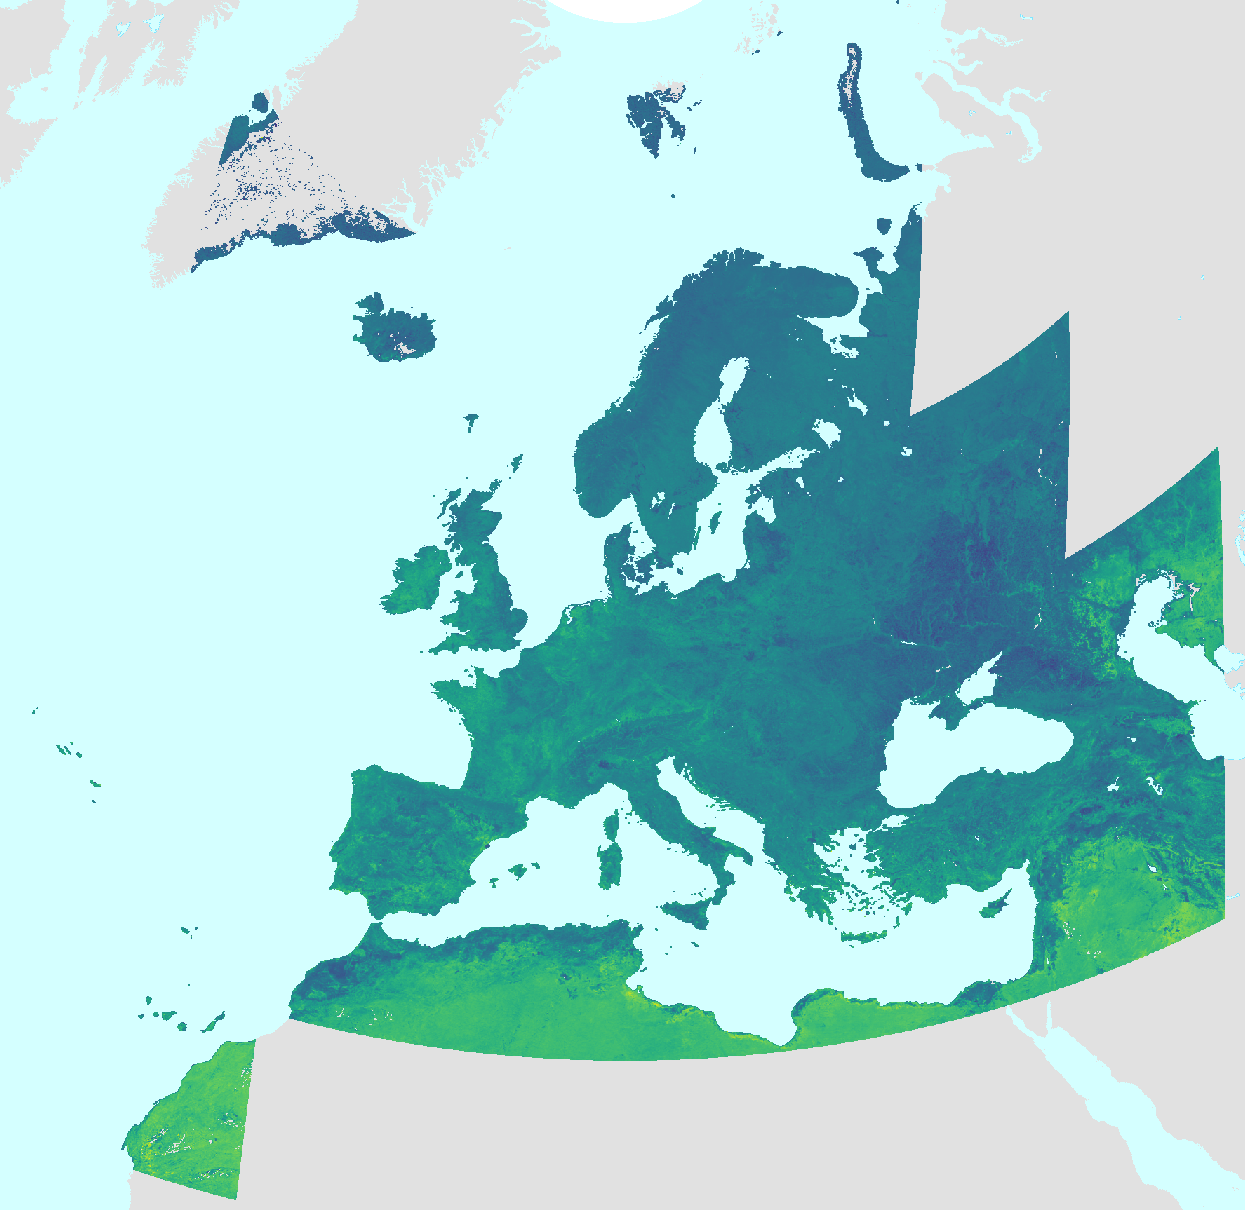
The slope of the green-down period (RSLOPE), one of the Vegetation Phenology and Productivity (VPP) parameters, is a product of the pan-European Medium Resolution Vegetation Phenology and Productivity (MR-VPP) component of the Copernicus Land Monitoring Service (CLMS). The RSLOPE expresses the rate of change in the values of the Plant Phenology Index (PPI) at the day when the vegetation growing season ends. The Plant Phenology Index (PPI) is a physically based vegetation index, developed for improving the monitoring of the vegetation growth cycle. The PPI index values, withwith daily inputs, are first used in a function fitting to derive the PPI Seasonal Trajectories. From these Seasonal Trajectories, a suite of 13 Vegetation Phenology and Productivity (VPP) parameters are then computed and provided, for up to two seasons each year. The RSLOPE is one of the 13 parameters. The RSLOPE time series dataset is made available as raster files with 392 x 392m resolution, in ETRS89-LAEA projection corresponding to the MCD43 tiling grid. IMPORTANT: The full access to open and free data for this resource will be made available upon request.
-
Medium Resolution Vegetation Phenology and Productivity: End-of-season value 2000-2025 (raster 392m)
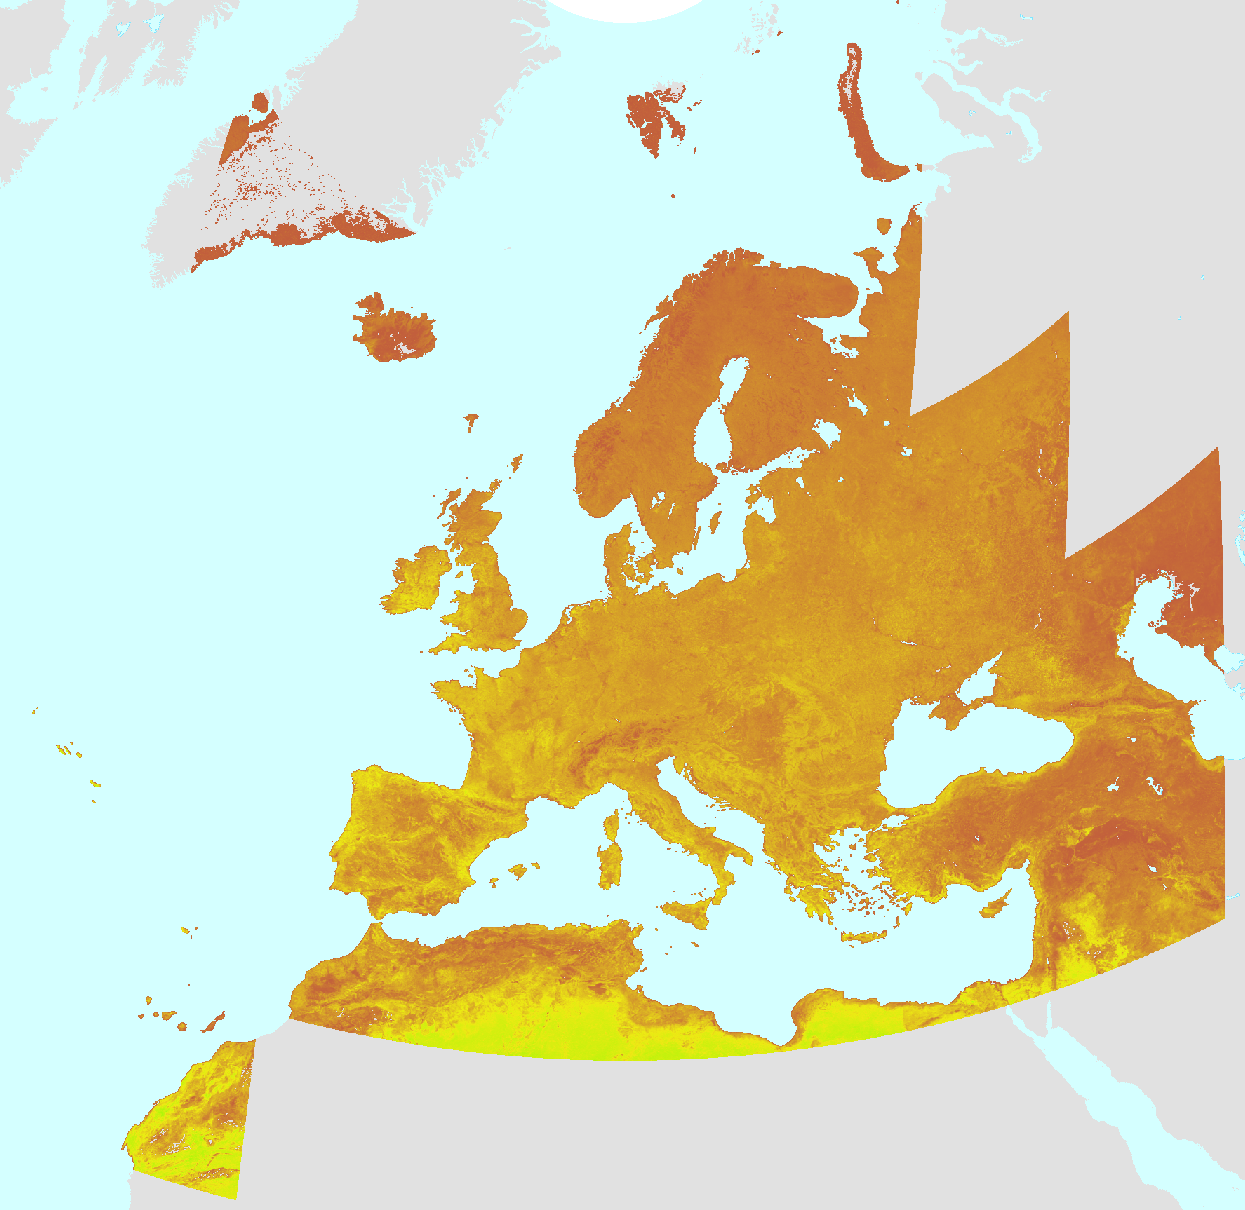
The end-of-season value (EOSV), one of the Vegetation Phenology and Productivity (VPP) parameters, is a product of the pan-European Medium Resolution Vegetation Phenology and Productivity (MR-VPP) component of the Copernicus Land Monitoring Service (CLMS). The EOSV provides the value of the Plant Phenology Index (PPI) at the end of the vegetation growing season. The Plant Phenology Index (PPI) is a physically based vegetation index, developed for improving the monitoring of the vegetation growth cycle. The PPI index values with daily inputs, are first used in a function fitting to derive the PPI Seasonal Trajectories. From these Seasonal Trajectories, a suite of 13 Vegetation Phenology and Productivity (VPP) parameters are then computed and provided, for up to two seasons each year. The EOSV is one of the 13 parameters. The EOSV time series dataset is made available as raster files with 392 x 392m resolution, in ETRS89-LAEA projection corresponding to the MCD43 tiling grid. IMPORTANT: The full access to open and free data for this resource will be made available upon request.
-

The Impervious Built-Up Change (IBUC) 2021-2024 layer is part of the High Resolution Layer (HRL) Imperviousness and provides categorical information on the change of built-up per pixel as derived from the difference between the Impervious Built-Up (IBU) status layers for the reference years 2021 and 2024. The production of the HRL Imperviousness is coordinated by EEA in the frame of Copernicus, the Earth observation component of the European Union’s Space programme. The product is a raster dataset with 20-meter grid spacing (spatial resolution) that covers the 38 Eionet member and cooperating countries as well as the United Kingdom (i.e. EEA38+UK). It is distributed as 100 x 100 km tiles that are fully conformant with the EEA reference grid.
-
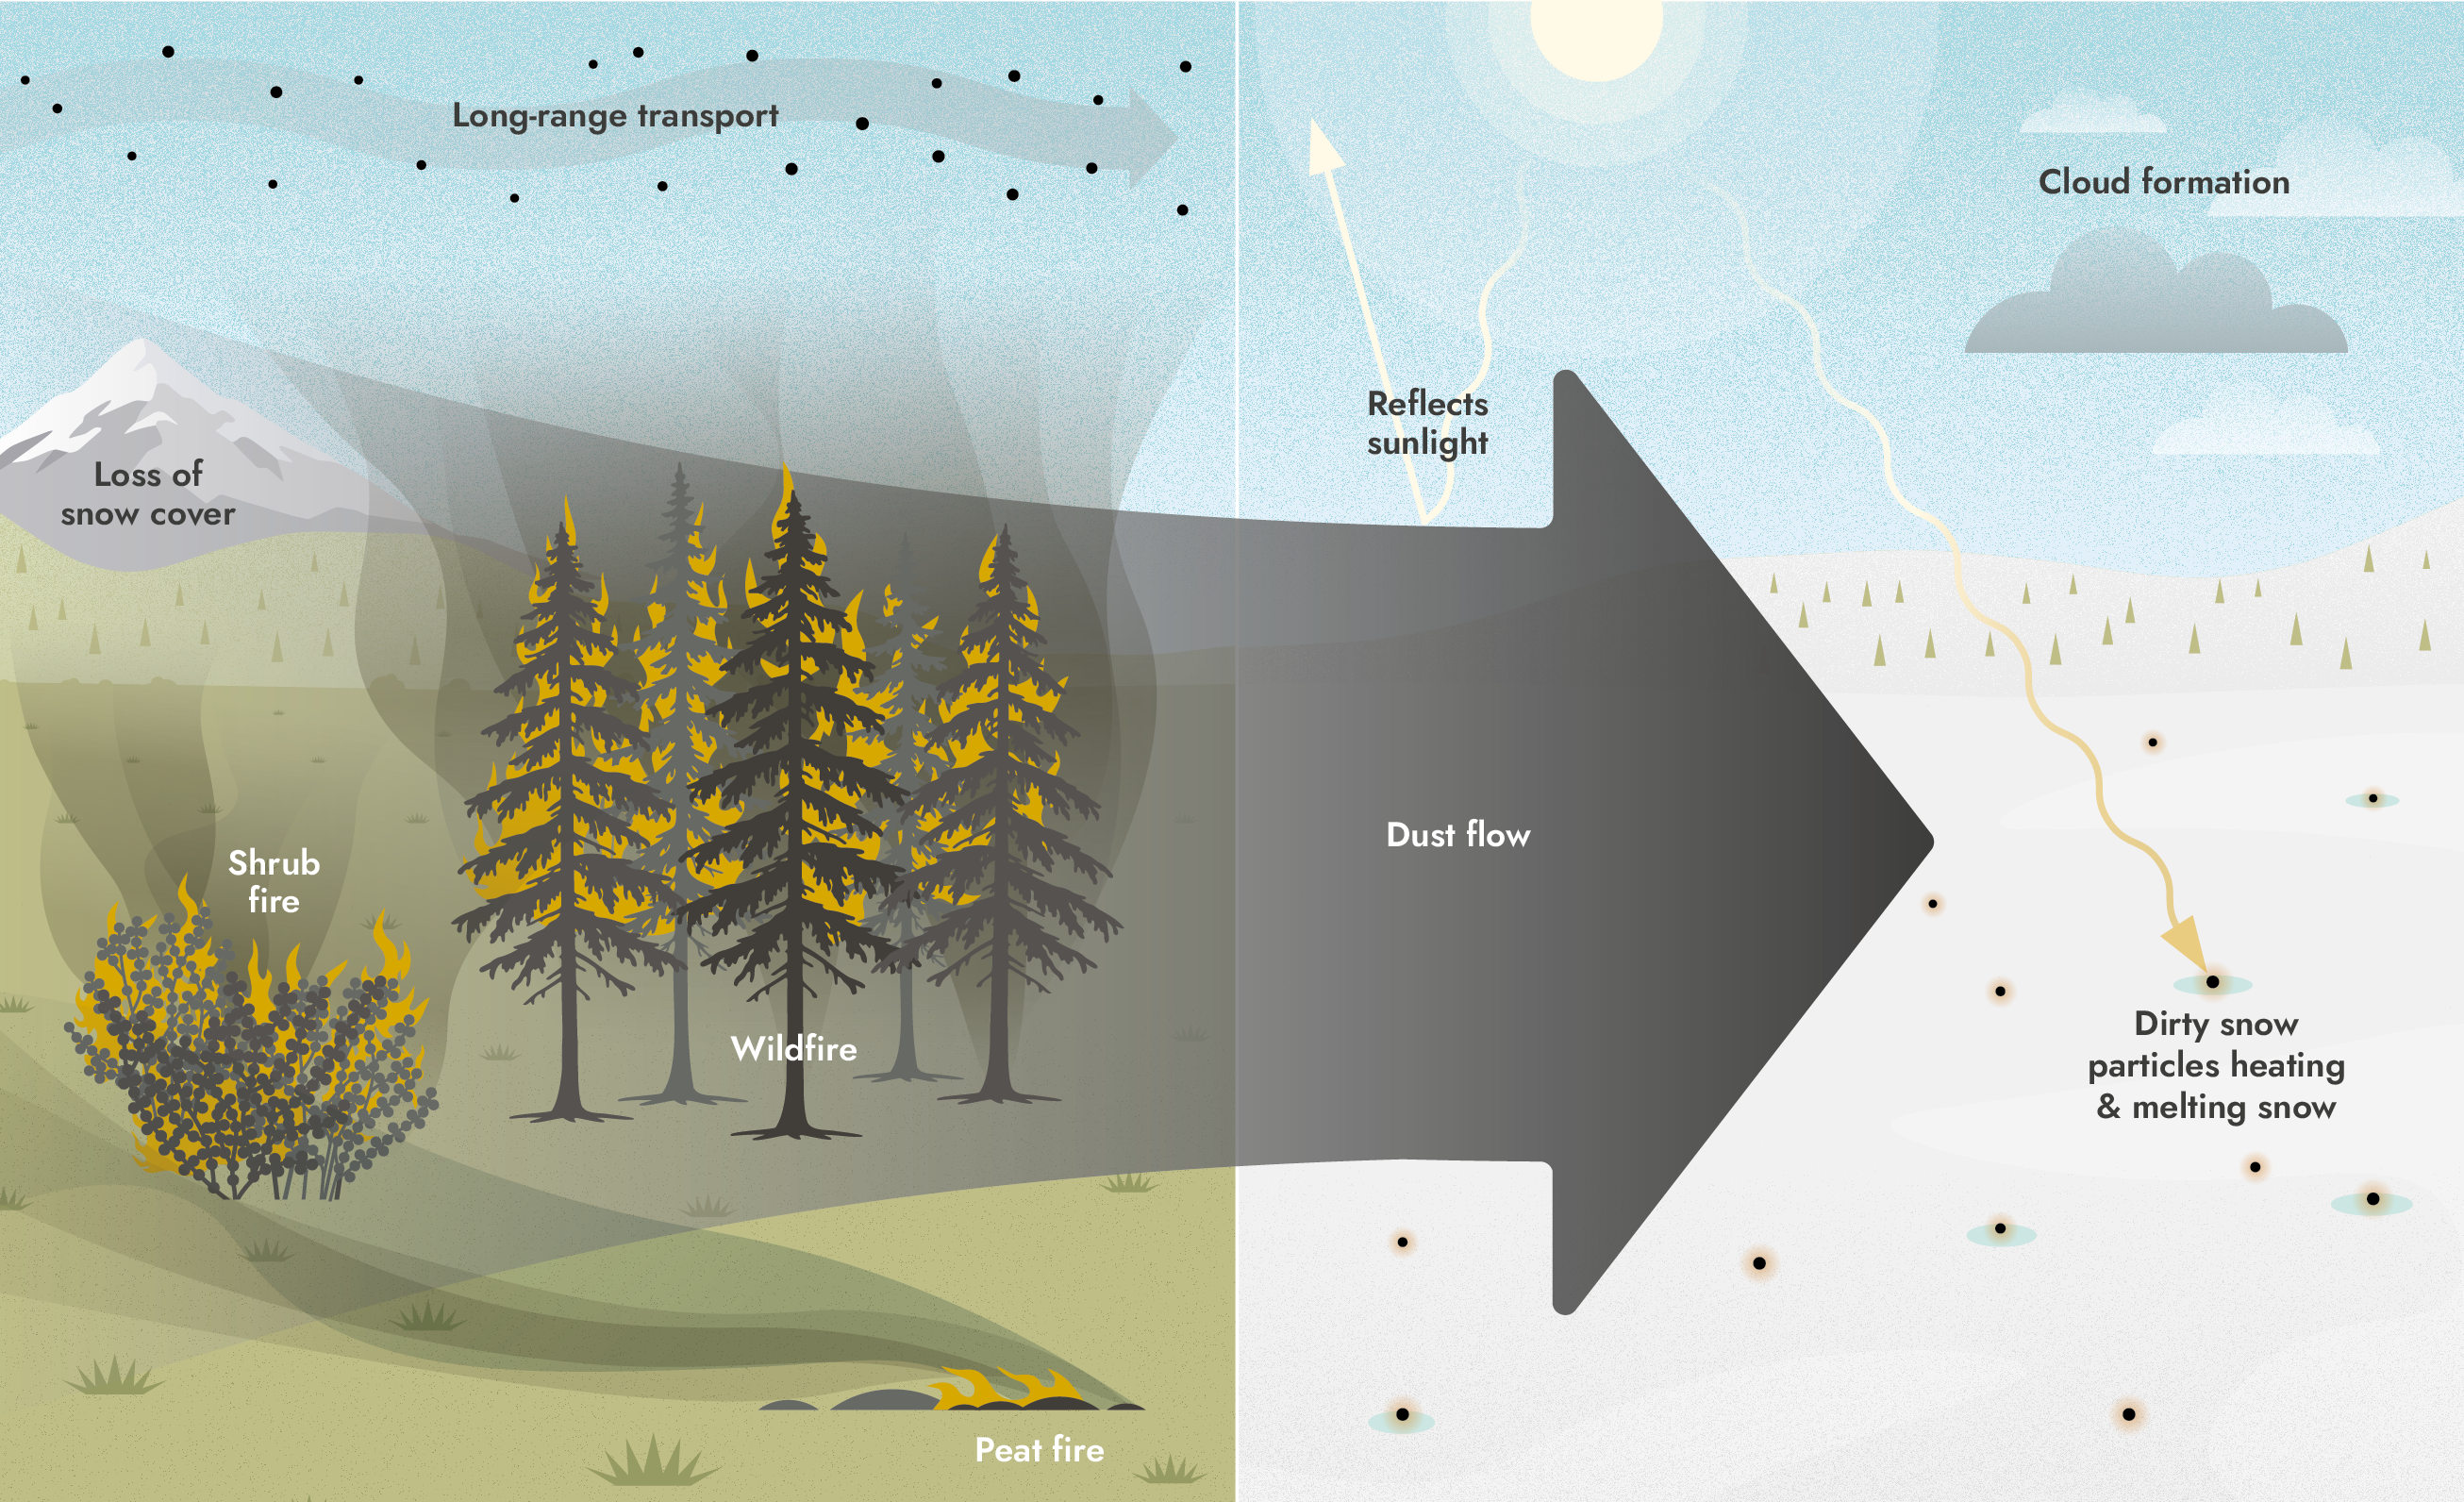
Wildfires, loss of snow cover, glacier retreat, permafrost thaw, and rising drought intensity all contribute to increased dust and aerosol production in the arctic. These particles can be transported over long distances, engaging in complex interactions with both climate and ecosystems, including radiative forcing (positive and negative), cloud formation, albedo and fertilization of aquatic ecosystems CAFF and AMAP are jointly reviewing and assessing climate impacts on Arctic marine, freshwater and terrestrial ecosystems, and ecosystem feedbacks to climate. Understanding how climate change will affect ecosystems and ecosystem services is key to human livelihoods in the Arctic. From the policy perspective, an assessment of how climate change affects species and ecosystems upon which Arctic residents depend, particularly Indigenous Peoples, has been identified as a high priority in the Arctic Council.
-
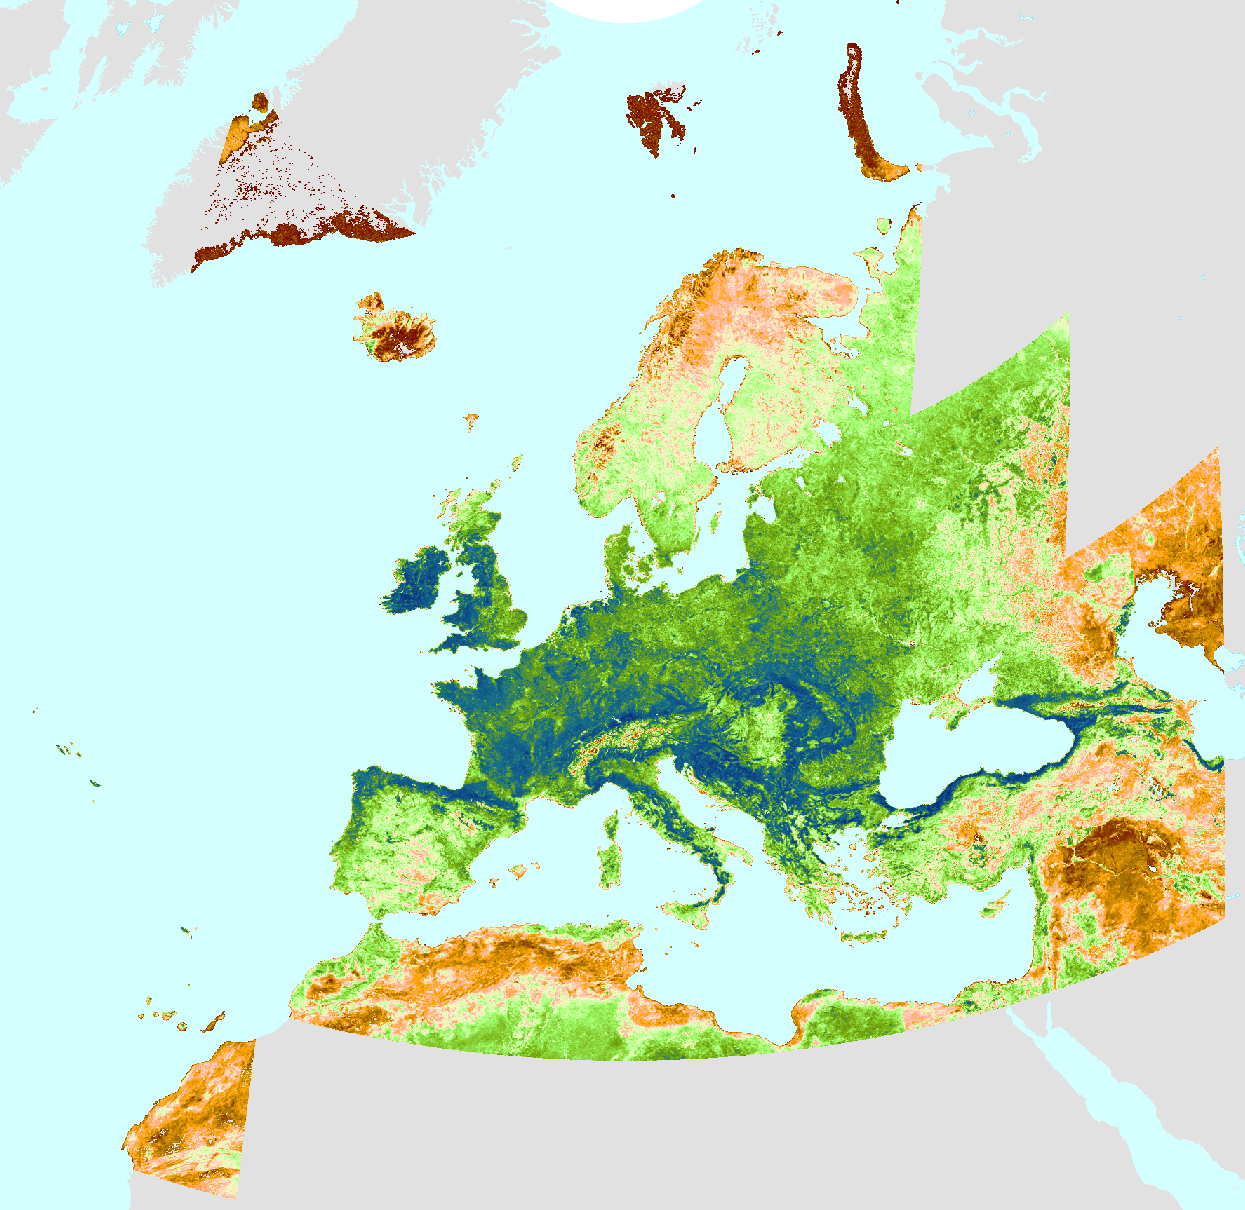
The seasonal productivity (SPROD), one of the Vegetation Phenology and Productivity (VPP) parameters, is a product of the pan-European Medium Resolution Vegetation Phenology and Productivity (MR-VPP) component of the Copernicus Land Monitoring Service (CLMS). The SPROD defined as the cumulative sum of daily deviations from the base level between the start and end of the growing season. The Plant Phenology Index (PPI) is a physically based vegetation index, developed for improving the monitoring of the vegetation growth cycle. The PPI index values, withwith daily inputs, are first used in a function fitting to derive the PPI Seasonal Trajectories. From these Seasonal Trajectories, a suite of 13 Vegetation Phenology and Productivity (VPP) parameters are then computed and provided, for up to two seasons each year. The SPROD is one of the 13 parameters. The SPROD time series dataset is made available as raster files with 392 x 392m resolution, in ETRS89-LAEA projection corresponding to the MCD43 tiling grid. IMPORTANT: The full access to open and free data for this resource will be made available upon request.
-

The Share of Built-Up (SBU) 2024 is part of the High Resolution Layer (HRL) Imperviousness and contains the share (percentage) of built-up per pixel for the reference year 2024 as derived from a pixel aggregation of the binary Impervious Built-Up (IBU) 2024 layer. The production of the HRL Imperviousness is coordinated by EEA in the frame of Copernicus, the Earth observation component of the European Union’s Space programme. The product is a raster dataset with 100-meter grid spacing (spatial resolution) that covers the 38 Eionet member and cooperating countries as well as the United Kingdom (i.e. EEA38+UK). It is distributed as 100 x 100 km tiles that are fully conformant with the EEA reference grid.
-
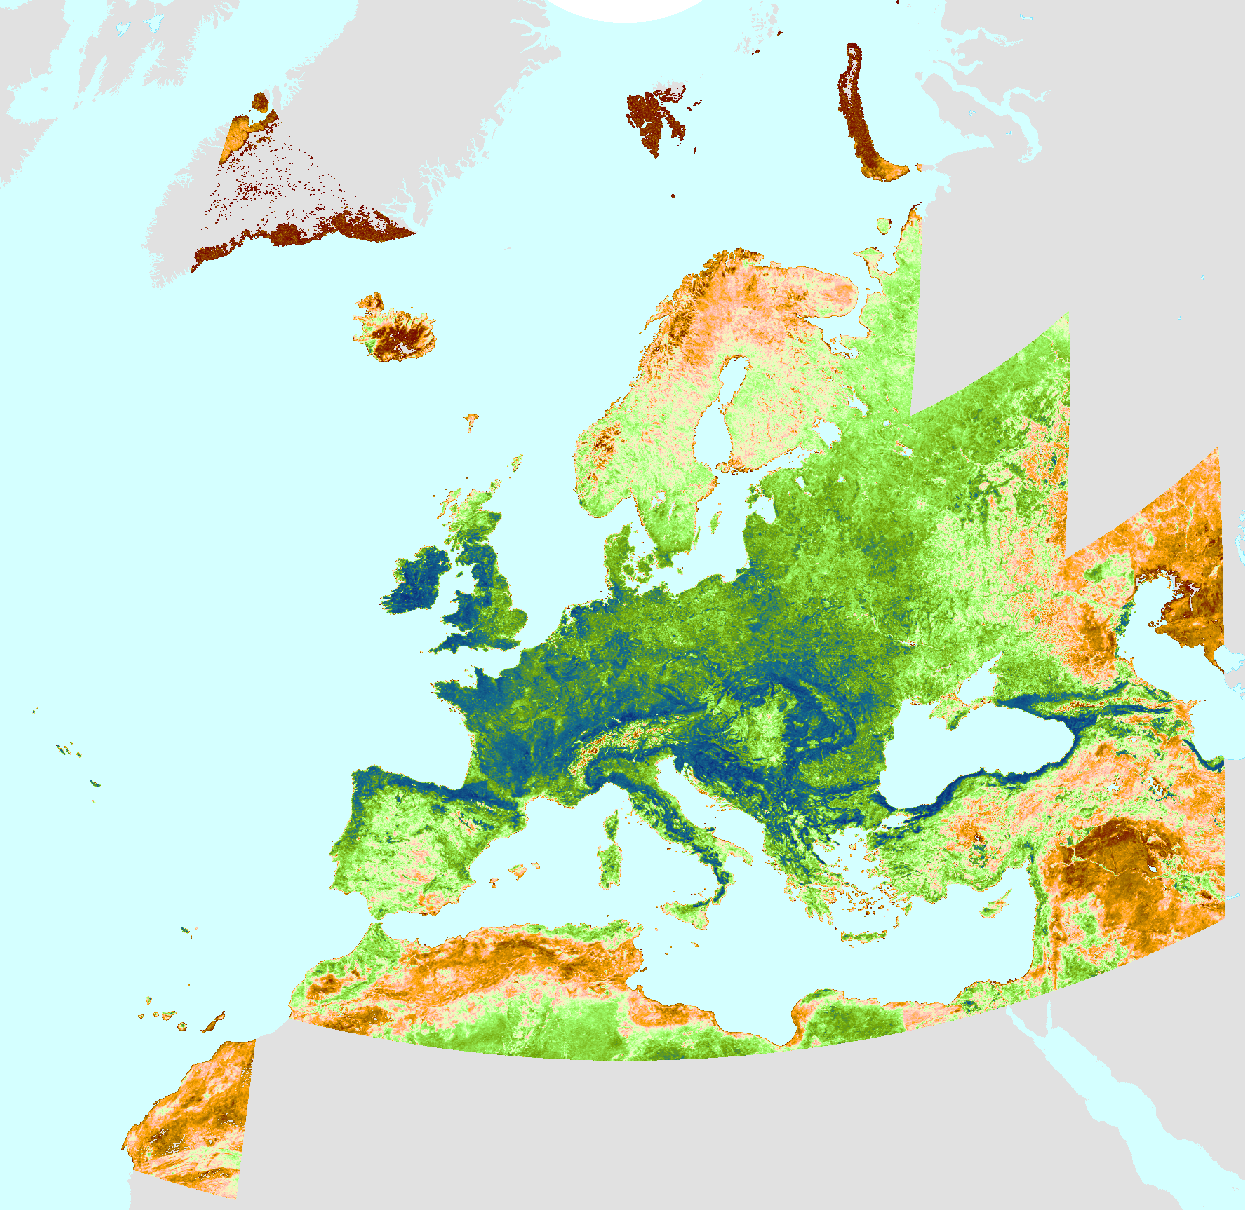
The season amplitude (AMPL), one of the Vegetation Phenology and Productivity (VPP) parameters, is a product of the pan-European Medium Resolution Vegetation Phenology and Productivity (MR-VPP) component of the Copernicus Land Monitoring Service (CLMS). The AMPL is the difference between the maximum and minimum Plant Phenology Index (PPI) values reached during the season. The Plant Phenology Index (PPI) is a physically based vegetation index, developed for improving the monitoring of the vegetation growth cycle. The PPI index values, with daily inputs, are first used in a function fitting to derive the PPI Seasonal Trajectories. From these Seasonal Trajectories, a suite of 13 Vegetation Phenology and Productivity (VPP) parameters are then computed and provided, for up to two seasons each year. The AMPL is one of the 13 parameters. The AMPL time series dataset is made available as raster files with 392 x 392m resolution, in ETRS89-LAEA projection corresponding to the MCD43 tiling grid. IMPORTANT: The full access to open and free data for this resource will be made available upon request.