 Arctic SDI catalogue
2015
Type of resources
Available actions
Topics
Keywords
Contact for the resource
Provided by
Years
Formats
Update frequencies
status
Service types
Scale
Resolution
-
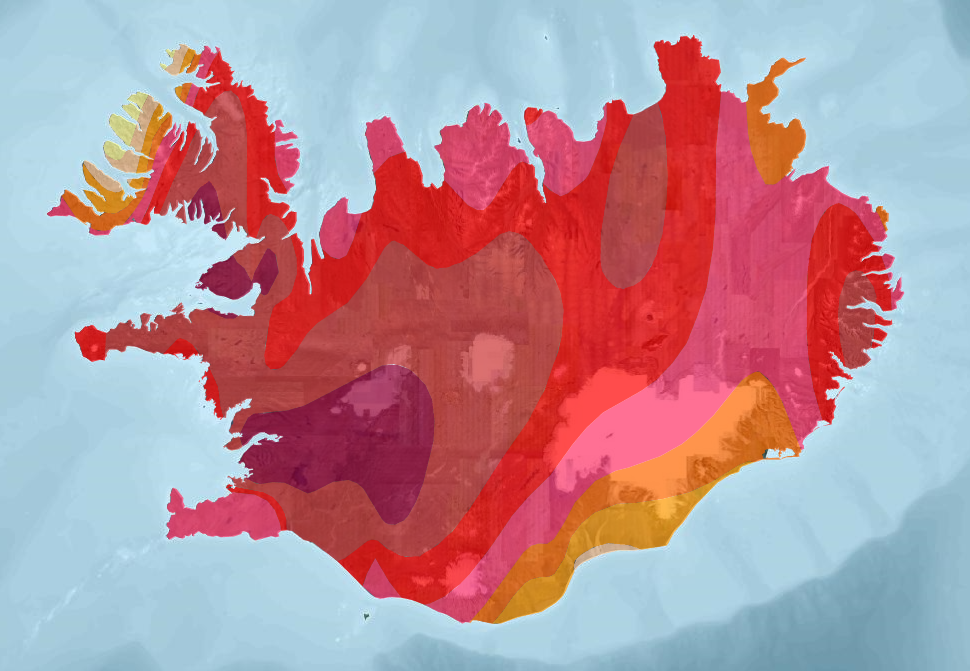
The dataset presents three layers of geothermal data from Iceland based on "Atlas of Geothermal Resources in Europe" (2002). Heat-flow density, Temperature at 1000 meters and Temperature at 2000 meters (1:10 000 000).
-
Mineral deposits are natural accumulations of one or more useful minerals that may provide society with metallic or non-metallic raw materials. The Geological Survey of Canada has been compiling databases for major metallic mineral deposits on Canada-wide and world-wide scale over a three decade period. The most recent compilation was enabled by industry-sponsored World Map and World Minerals Geoscience Database Projects. Global databases for seven important metallic deposit types: lode gold, porphyry-related, nickel-platinum group-chromite, sedimentary exhalative lead-zinc, Mississippi Valley-type zinc-lead, iron oxide-copper-gold (IOCG), and sediment-hosted copper deposits are now available On-Line. Five easy-to-use thematic world geology datasets provide generalized geological context for the global databases.
-
-
-
The geographical names WFS allows a connection to the Canadian Geographical Names Database (CGNDB). The CGNDB is composed of official and former names approved by the Geographical Names Board of Canada (GNBC). / Le WFS de toponymie permet une connexion à la base de données des toponymes du Canada (BNDT). La BNDT est composée de tous les noms officiels et historiques approuvés par la Commission de Toponymie du Canada (CTC).
-
Web Feature Service
-
MapPlace OGC WMS 1.1.1 Compliant Server
-
-
Data managed by the Canadian Geographical Names Service
-
GDR_F Web Map Service (ArcIMS 9.3.1)