 Arctic SDI catalogue
U.S. Geological Survey
Type of resources
Available actions
Topics
Keywords
Contact for the resource
Provided by
Years
Formats
Service types
Scale
-
The goal of this project is to quantify, at the National scale, the relative susceptibility of the Nation's coast to sea- level rise through the use of a coastal vulnerability index (CVI). This initial classification is based upon the variables coastal geomorphology, regional coastal slope, tidal range, wave height, historical rates of relative sea-level rise and shoreline erosion and accretion rates. The combination of these variables furnishes a broad overview of regions where physical changes are likely to occur due to sea-level rise.
-
Garrity, C.P., and Soller, D.R., in review, Geologic database of the Geologic Map of North America (v.1.0), adapted from Reed et al. (2005): U.S. Geological Survey Data Product, to be available on CDROM and WWW. [Source map is: Reed, J.C., Wheeler, J.O., and Tucholke, B.E., 2005, Geologic Map of North America, South Sheet, Geological Society of America Continent-Scale Map 001, scale 1:5000000, available at http://www.geosociety.org/bookstore/default.asp?oID=0&catID=12&pID=CSM001F]. Information on digital conversion of this map will, by late August, become available in technical paper by Garrity and Soller, at http://ngmdb.usgs.gov/Info/dmt/DMT07presentations.html. Preparation for OneGeology WMS by S.M. Richard (Arizona Geological Survey and U.S. Geological Survey), C.P. Garrity (USGS), D.C. Percy (Portland State University and U.S. Geological Survey), and D.R. Soller (USGS).
-
In 1999, the USGS, in partnership with the South Carolina Sea Grant Consortium, began a study to investigate processes affecting shoreline change along the northern coast of South Carolina, focusing on the Grand Strand region. By defining the geologic framework and identifying the transport pathways and sinks of sediment, geoscientists are developing conceptual models of the present-day physical processes shaping the South Carolina coast.
-
Published data layers and information from the U.S. Atlantic Coast, U.S. Gulf Coast, Caribbean region (Puerto Rico and Virgin Islands), and U.S. Pacific Coast from the usSEABED project of the U.S. Geological Survey, Coastal and Marine Geology Program (CMGP) and the University of Colorado.
-
There are critical needs for a nationwide compilation of reliable shoreline data. To meet these needs, the USGS has produced a comprehensive database of digital vector shorelines by compiling shoreline positions from pre-existing historical shoreline databases and by generating historical and modern shoreline data. Shorelines are compiled by state and generally correspond to one of four time periods: 1800s, 1920s-1930s, 1970s, and 1997-2002. Each shoreline may represent a compilation of data from one or more sources for one or more dates provided by one or more agencies. Details regarding source are provided in the 'Data Quality Information' section of this metadata report. Shoreline vectors derived from historic sources (first three time periods) represent the high water line at the time of the survey, whereas modern shorelines (final time period) represent the mean high water line.
-
This map consists of short-term (~50 years) shoreline change rates for the lower 48 states of the United States and Hawaii. Rate calculations were computed within a GIS using the Digital Shoreline Analysis System (DSAS) version 4.1, an ArcGIS extension developed by the U.S. Geological Survey. Short-term rates of shoreline change for the lower 48 states were calculated using an end-point rate method based on shorelines from 1970 or 1978 and 2000 to provide an approximately 30-yr short-term rate. Short-term rates of shoreline change for Hawaii were calculated using a weighted linear regression rate based on all available shoreline data between 1950 and 2008. A reference baseline was used as the originating point for the orthogonal transects cast by the DSAS software. The transects intersect each shoreline establishing measurement points, which are then used to calculate short-term rates.
-
This dataset includes a reference baseline used by the Digital Shoreline Analysis System (DSAS) to calculate rate-of-change statistics. This baseline layer serves as the starting point for all transects cast by the DSAS application. The transects intersect each shoreline and establish measurement points used to calculate shoreline-change rates.
-
This dataset consists of transects intersect points used by the Digital Shoreline Analysis System (DSAS) to calculate rate-of-change statistics. Rate calculations were computed within a GIS using the DSAS, an ArcGIS extension developed by the U.S. Geological Survey. Long-term rates of shoreline change were calculated using a linear regression rate based on all available shoreline data. A reference baseline was used as the originating point for the orthogonal transects cast by the DSAS software. The transects intersect each shoreline establishing measurement points, which are then used to calculate long-term rates.
-
This map consists of long-term (100+ years) shoreline change rates for the lower 48 states of the United States and Hawaii. Rate calculations were computed within a GIS using the Digital Shoreline Analysis System (DSAS) version 4.1, an ArcGIS extension developed by the U.S. Geological Survey. Long-term rates of shoreline change for the lower 48 states were calculated using a linear regression rate based on all available shoreline data. Long-term rates of shoreline change for Hawaii were calculated using a weighted linear regression rate based on all available shoreline data. A reference baseline was used as the originating point for the orthogonal transects cast by the DSAS software. The transects intersect each shoreline establishing measurement points, which are then used to calculate long-term rates.
-
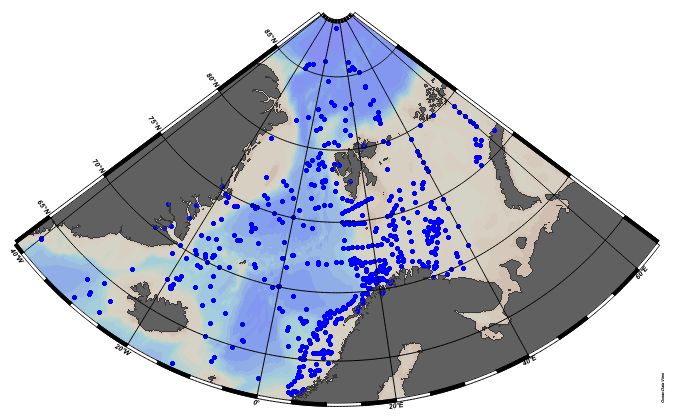
EMODnet Chemistry aims to provide access to marine chemistry datasets and derived data products concerning eutrophication, acidity and contaminants. The importance of the selected substances and other parameters relates to the Marine Strategy Framework Directive (MSFD). This aggregated dataset contains all unrestricted EMODnet Chemistry data on potential hazardous substances, despite the fact that some data might not be related to pollution (e.g. collected by deep corer). Temperature, salinity and additional parameters are included when available. It covers the Norwegian Sea, Barents Sea, Greenland Sea and Icelandic Waters. Data were harmonised and validated by the 'Institute of Marine Research - Norwegian Marine Data Centre (NMD)' in Norway. The dataset contains water and sediment profiles. The temporal coverage is 1974–2011 for water measurements and 1974–2021 for sediment measurements. Regional datasets concerning contaminants are automatically harvested and the resulting collections are harmonised and validated using ODV Software and following a common methodology for all sea regions ( https://doi.org/10.6092/8b52e8d7-dc92-4305-9337-7634a5cae3f4). Parameter names are based on P01 vocabulary, which relates to BODC Parameter Usage Vocabulary and is available at: https://vocab.nerc.ac.uk/search_nvs/P01/. The harmonised dataset can be downloaded as as an ODV spreadsheet, which is composed of a metadata header followed by tab separated values. This spreadsheet can be imported into ODV Software for visualisation (more information can be found at: https://www.seadatanet.org/Software/ODV). In addition, the same dataset is offered also as a txt file in a long/vertical format, in which each P01 measurement is a record line. Additionally, there are a series of columns that split P01 terms into subcomponents (substance, CAS number, matrix...).This transposed format is more adapted to worksheet applications (e.g. LibreOffice Calc).