 Arctic SDI catalogue
392 m
Type of resources
Categories
Topics
Keywords
Contact for the resource
Provided by
Years
Formats
Resolution
-
Medium Resolution Vegetation Phenology and Productivity: End-of-season value 2000-2025 (raster 392m)
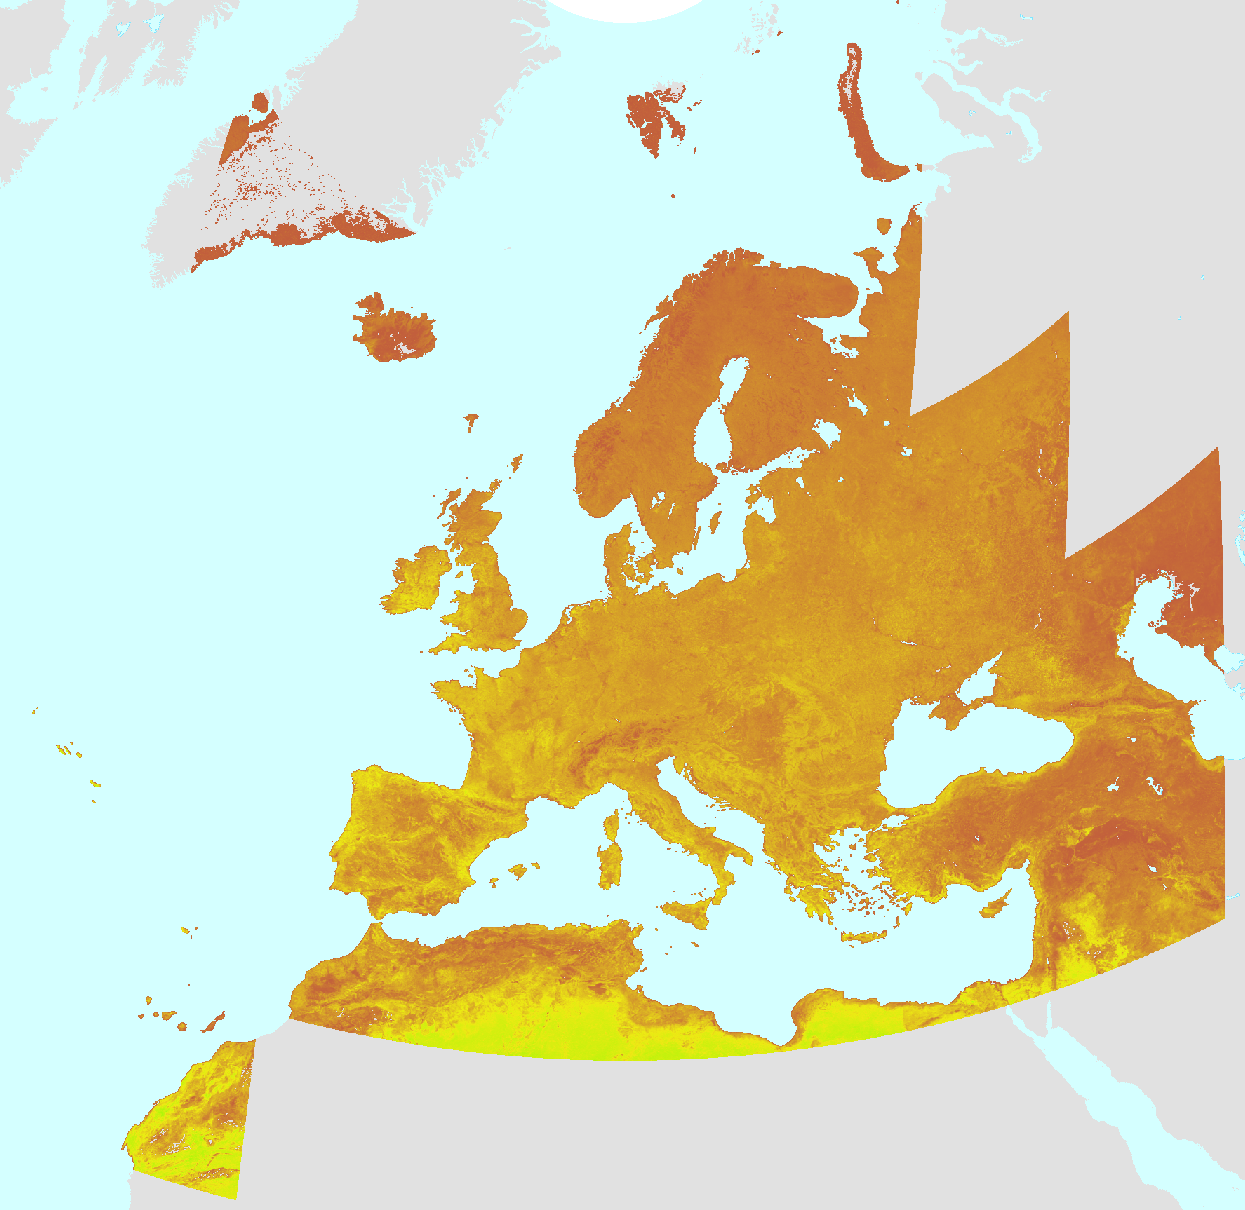
The end-of-season value (EOSV), one of the Vegetation Phenology and Productivity (VPP) parameters, is a product of the pan-European Medium Resolution Vegetation Phenology and Productivity (MR-VPP) component of the Copernicus Land Monitoring Service (CLMS). The EOSV provides the value of the Plant Phenology Index (PPI) at the end of the vegetation growing season. The Plant Phenology Index (PPI) is a physically based vegetation index, developed for improving the monitoring of the vegetation growth cycle. The PPI index values with daily inputs, are first used in a function fitting to derive the PPI Seasonal Trajectories. From these Seasonal Trajectories, a suite of 13 Vegetation Phenology and Productivity (VPP) parameters are then computed and provided, for up to two seasons each year. The EOSV is one of the 13 parameters. The EOSV time series dataset is made available as raster files with 392 x 392m resolution, in ETRS89-LAEA projection corresponding to the MCD43 tiling grid. IMPORTANT: The full access to open and free data for this resource will be made available upon request.
-
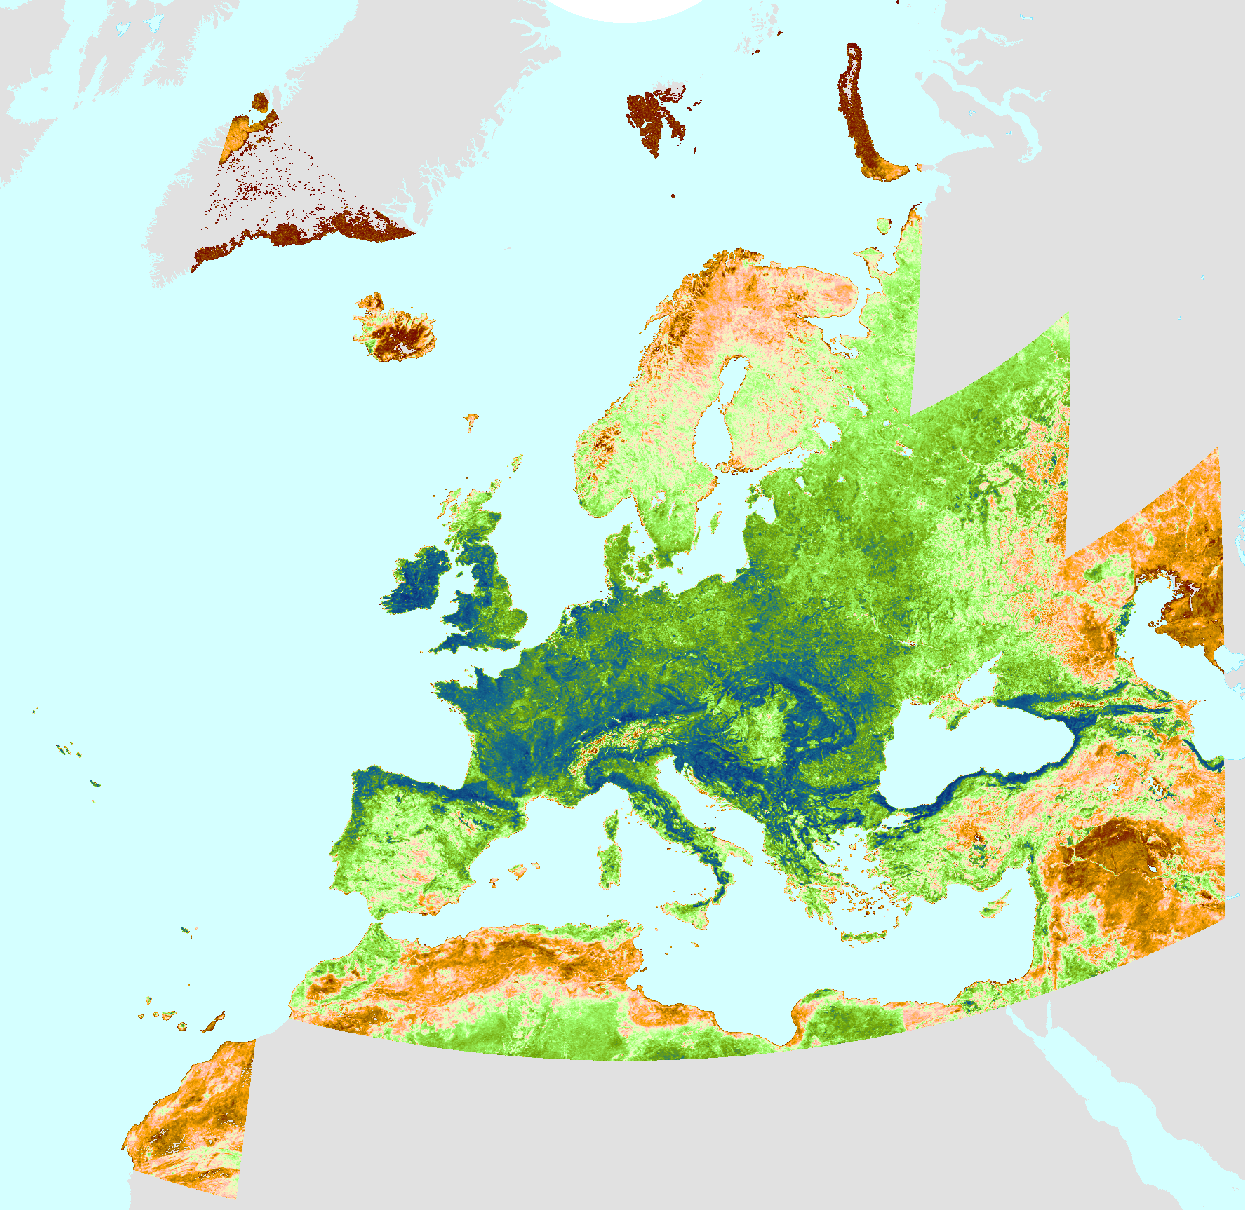
The season amplitude (AMPL), one of the Vegetation Phenology and Productivity (VPP) parameters, is a product of the pan-European Medium Resolution Vegetation Phenology and Productivity (MR-VPP) component of the Copernicus Land Monitoring Service (CLMS). The AMPL is the difference between the maximum and minimum Plant Phenology Index (PPI) values reached during the season. The Plant Phenology Index (PPI) is a physically based vegetation index, developed for improving the monitoring of the vegetation growth cycle. The PPI index values, with daily inputs, are first used in a function fitting to derive the PPI Seasonal Trajectories. From these Seasonal Trajectories, a suite of 13 Vegetation Phenology and Productivity (VPP) parameters are then computed and provided, for up to two seasons each year. The AMPL is one of the 13 parameters. The AMPL time series dataset is made available as raster files with 392 x 392m resolution, in ETRS89-LAEA projection corresponding to the MCD43 tiling grid. IMPORTANT: The full access to open and free data for this resource will be made available upon request.
-
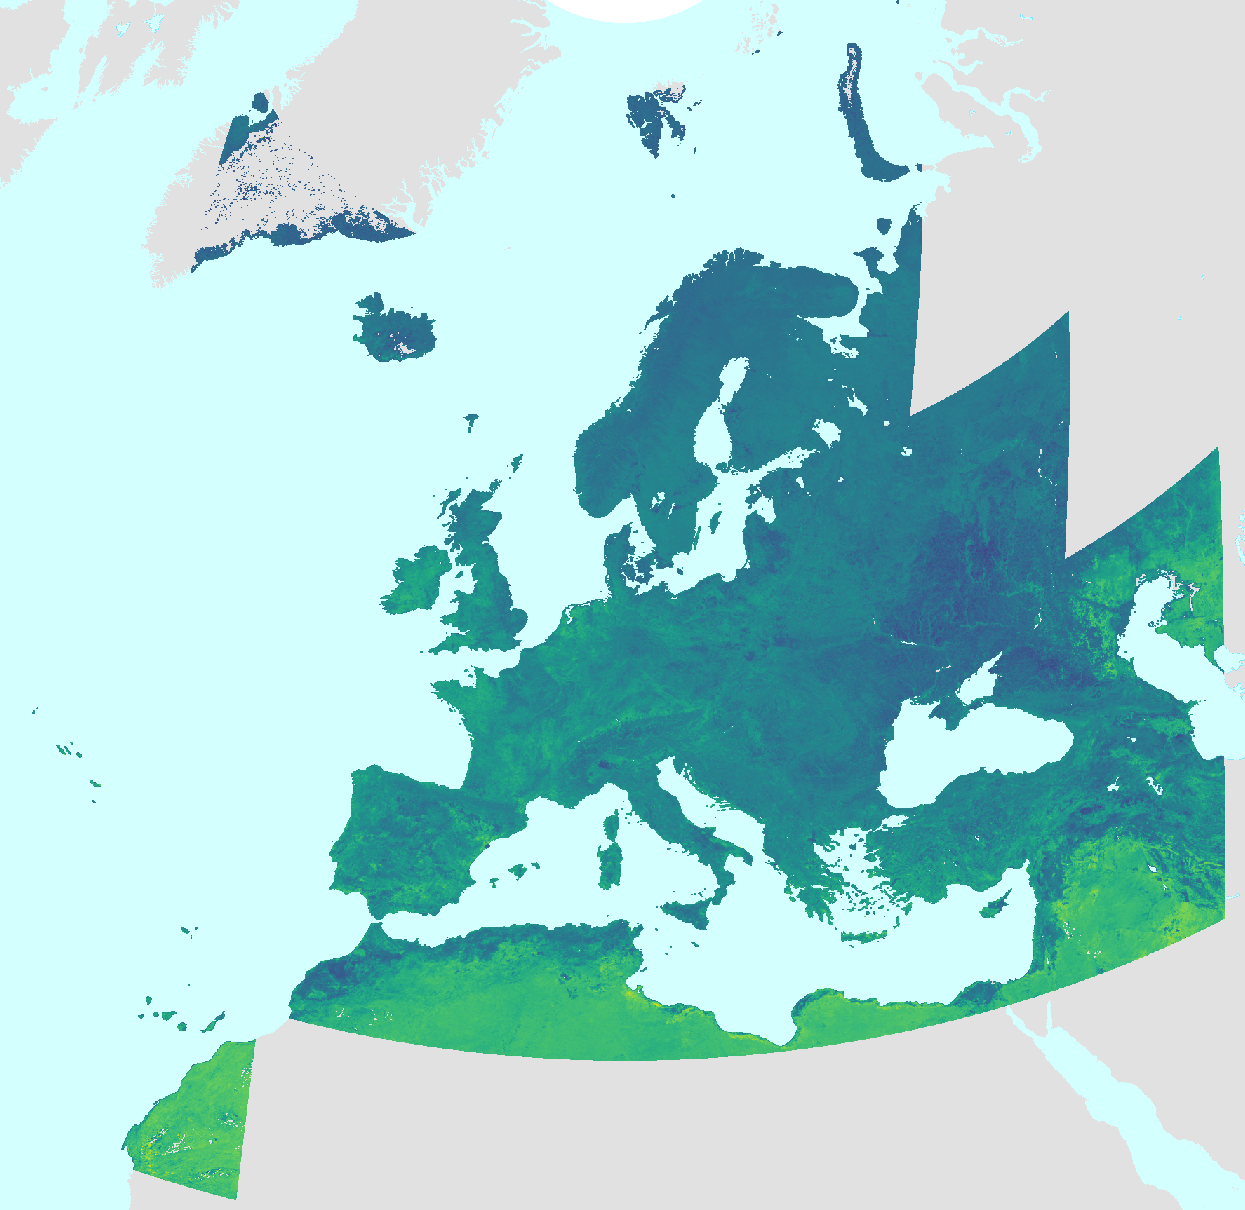
The season length (LENGTH), one of the Vegetation Phenology and Productivity (VPP) parameters, is a product of the pan-European High Resolution Vegetation Phenology and Productivity (MR-VPP) component of the Copernicus Land Monitoring Service (CLMS). The LENGTH is the number of days between the start and end dates of the vegetation growing season in the time profile of the Plant Phenology Index (PPI). The Plant Phenology Index (PPI) is a physically based vegetation index, developed for improving the monitoring of the vegetation growth cycle. The PPI index values, withwith daily inputs, are first used in a function fitting to derive the PPI Seasonal Trajectories. From these Seasonal Trajectories, a suite of 13 Vegetation Phenology and Productivity (VPP) parameters are then computed and provided, for up to two seasons each year. The LENGTH is one of the 13 parameters. The LENGTH time series dataset is made available as raster files with 392 x 392m resolution, in ETRS89-LAEA projection corresponding to the MCD43 tiling grid. IMPORTANT: The full access to open and free data for this resource will be made available upon request.
-
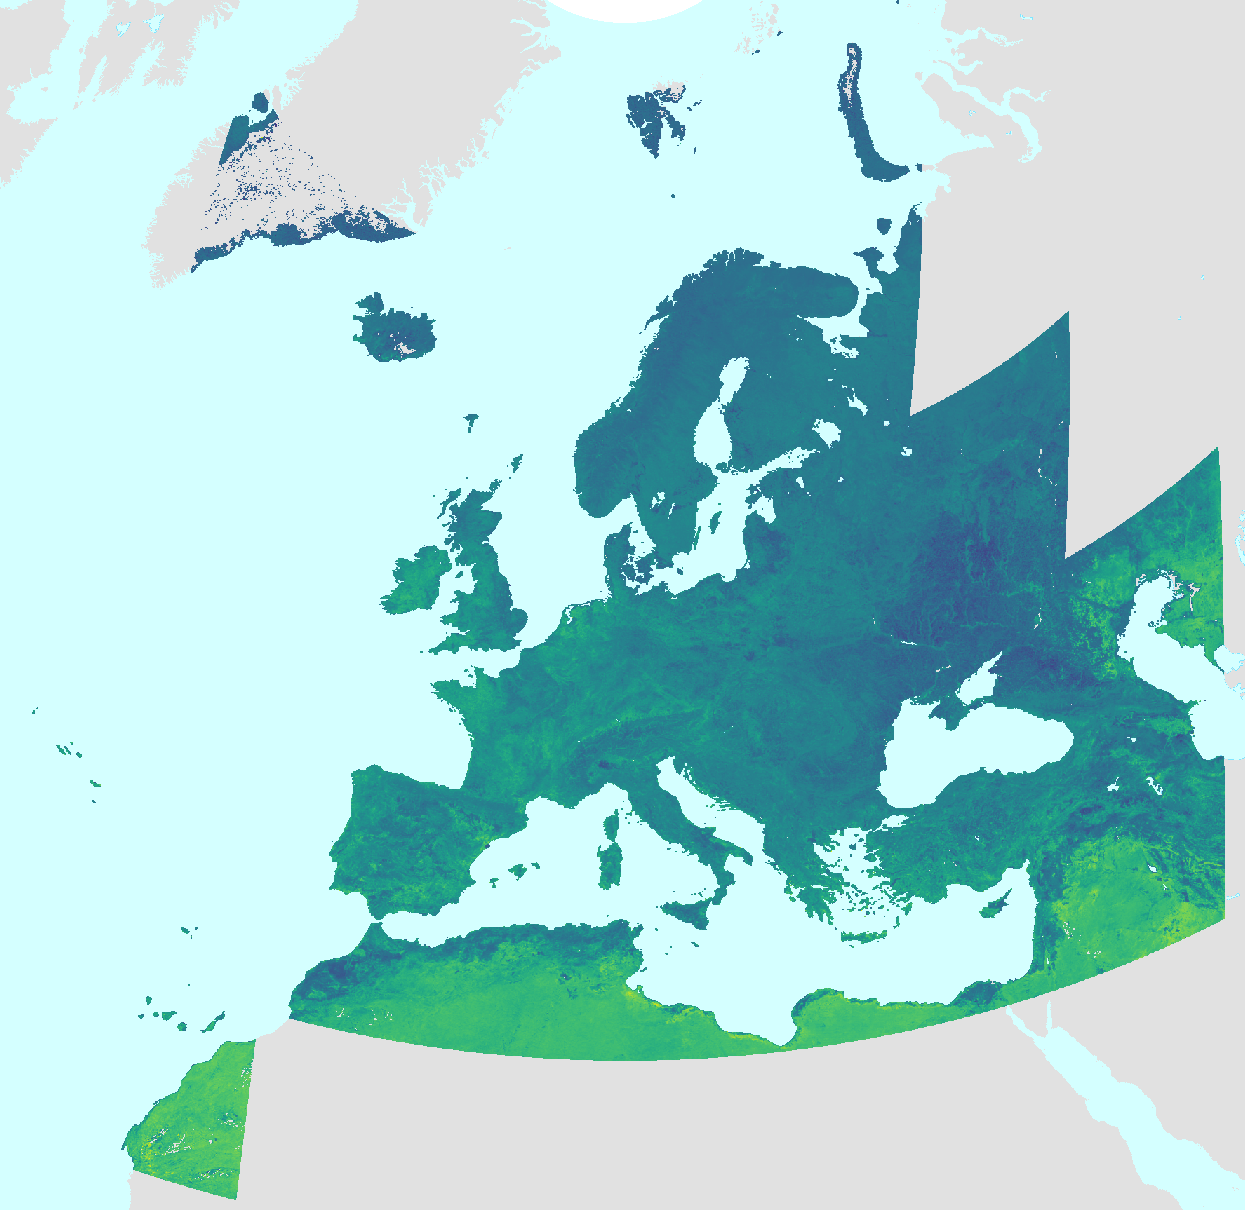
The slope of the green-down period (RSLOPE), one of the Vegetation Phenology and Productivity (VPP) parameters, is a product of the pan-European Medium Resolution Vegetation Phenology and Productivity (MR-VPP) component of the Copernicus Land Monitoring Service (CLMS). The RSLOPE expresses the rate of change in the values of the Plant Phenology Index (PPI) at the day when the vegetation growing season ends. The Plant Phenology Index (PPI) is a physically based vegetation index, developed for improving the monitoring of the vegetation growth cycle. The PPI index values, withwith daily inputs, are first used in a function fitting to derive the PPI Seasonal Trajectories. From these Seasonal Trajectories, a suite of 13 Vegetation Phenology and Productivity (VPP) parameters are then computed and provided, for up to two seasons each year. The RSLOPE is one of the 13 parameters. The RSLOPE time series dataset is made available as raster files with 392 x 392m resolution, in ETRS89-LAEA projection corresponding to the MCD43 tiling grid. IMPORTANT: The full access to open and free data for this resource will be made available upon request.
-

The total productivity (TPROD), one of the Vegetation Phenology and Productivity (VPP) parameters, is a product of the pan-European High Resolution Vegetation Phenology and Productivity (MR-VPP) component of the Copernicus Land Monitoring Service (CLMS). The TPROD, or large integral, is the growing season integral computed as the sum of all daily Plant Phenology Index values between the dates of the season start (SOSD) and end (EOSD). The Plant Phenology Index (PPI) is a physically based vegetation index, developed for improving the monitoring of the vegetation growth cycle. The PPI index values with daily inputs, are first used in a function fitting to derive the PPI Seasonal Trajectories. From these Seasonal Trajectories, a suite of 13 Vegetation Phenology and Productivity (VPP) parameters are then computed and provided, for up to two seasons each year. The TPROD is one of the 13 parameters. The TPROD time series dataset is made available as raster files with 392 x 392m resolution, in ETRS89-LAEA projection corresponding to the MCD43 tiling grid. IMPORTANT: The full access to open and free data for this resource will be made available upon request.
-
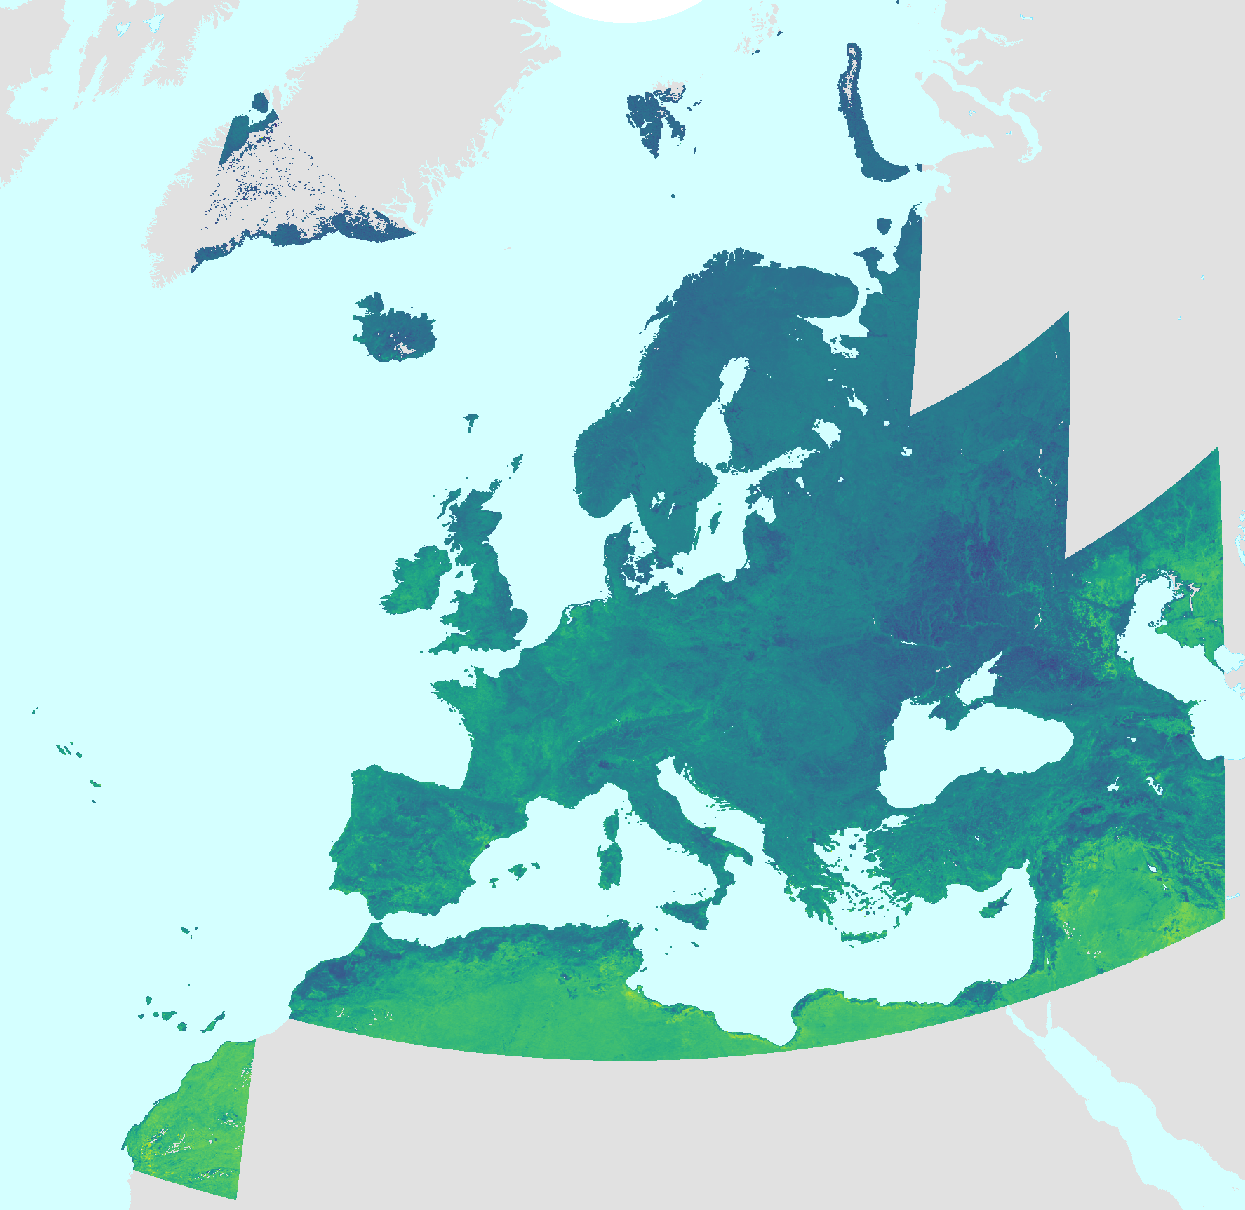
The slope of the green-up period (LSLOPE), one of the Vegetation Phenology and Productivity (VPP) parameters, is a product of the pan-European Medium Resolution Vegetation Phenology and Productivity (MR-VPP) component of the Copernicus Land Monitoring Service (CLMS). The LSLOPE expresses the rate of change in the values of the Plant Phenology Index (PPI) at the day when the vegetation growing season starts. The Plant Phenology Index (PPI) is a physically based vegetation index, developed for improving the monitoring of the vegetation growth cycle. The PPI index values, withwith daily inputs, are first used in a function fitting to derive the PPI Seasonal Trajectories. From these Seasonal Trajectories, a suite of 13 Vegetation Phenology and Productivity (VPP) parameters are then computed and provided, for up to two seasons each year. The LSLOPE is one of the 13 parameters. The LSLOPE time series dataset is made available as raster files with 392 x 392m resolution, in ETRS89-LAEA projection corresponding to the MCD43 tiling grid. IMPORTANT: The full access to open and free data for this resource will be made available upon request.
-
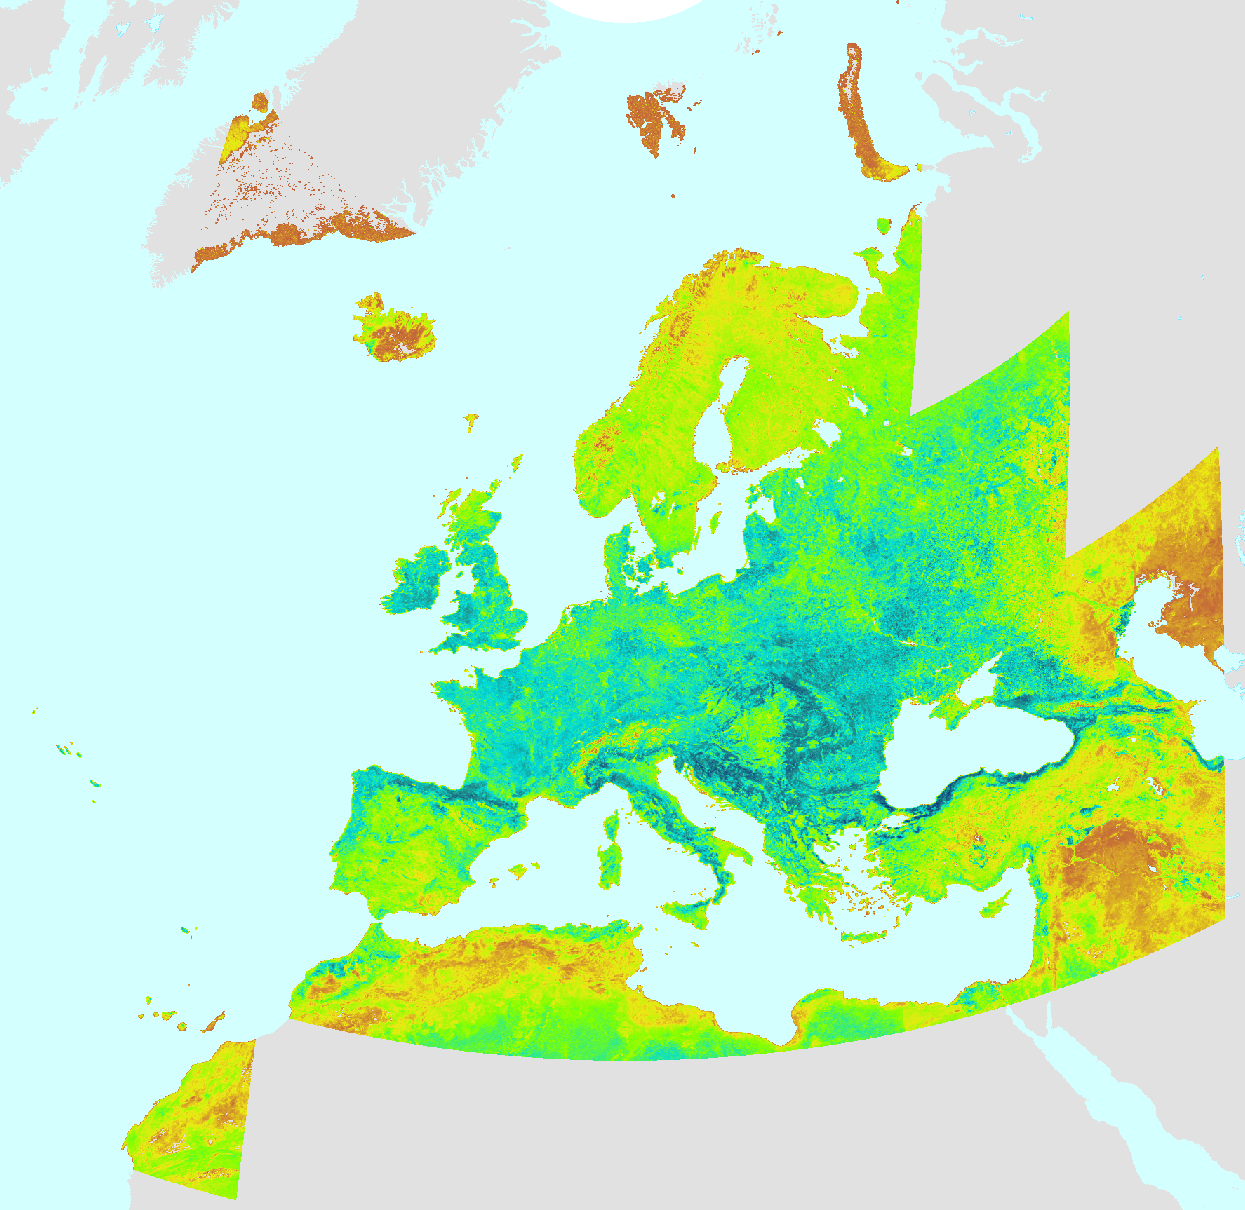
The season maximum value (MAXV) for the fitted function during the season, one of the Vegetation Phenology and Productivity (VPP) parameters, is a product of the pan-European Medium Resolution Vegetation Phenology and Productivity (MR-VPP) component of the Copernicus Land Monitoring Service (CLMS). The MAXV for the fitted function during the season expresses the highest value of the season but may occur on a different date than the season maximum date (MAXD). The Plant Phenology Index (PPI) is a physically based vegetation index, developed for improving the monitoring of the vegetation growth cycle. The PPI index values, The PPI index values, with daily inputs, are first used in a function fitting to derive the PPI Seasonal Trajectories. From these Seasonal Trajectories, a suite of 13 Vegetation Phenology and Productivity (VPP) parameters are then computed and provided, for up to two seasons each year. The MAXV is one of the 13 parameters. The MAXV time series dataset is made available as raster files with 392 x 392m resolution, in ETRS89-LAEA projection corresponding to the MCD43 tiling grid. IMPORTANT: The full access to open and free data for this resource will be made available upon request.
-
Medium Resolution Vegetation Phenology and Productivity: Season maximum date 2000-2025 (raster 392m)
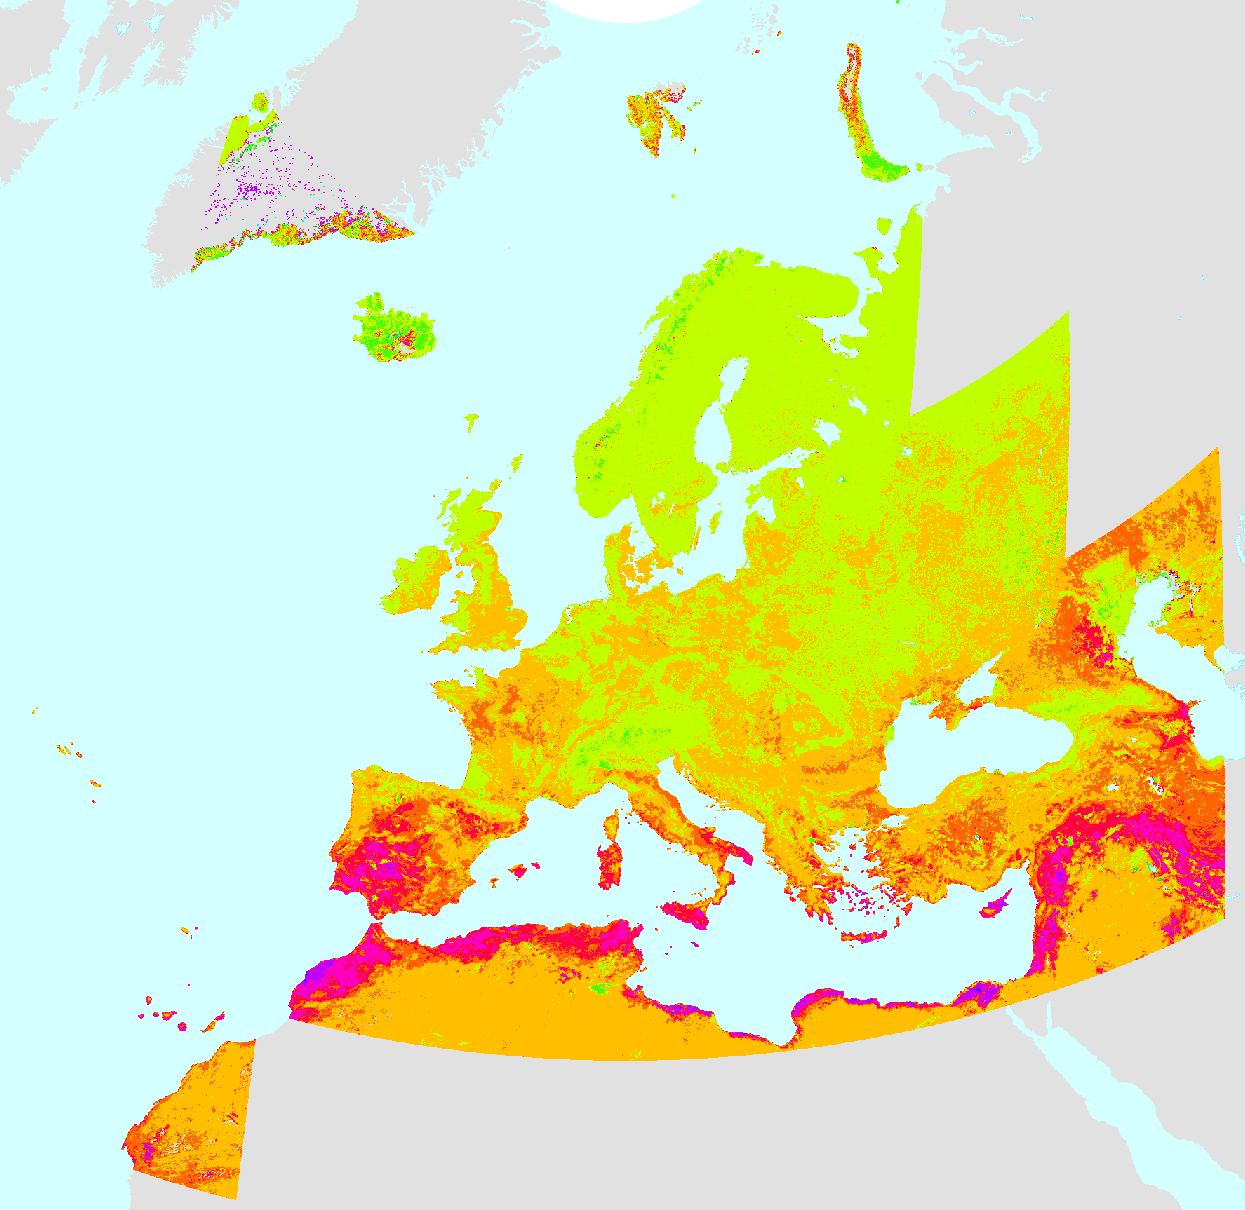
The season maximum date (MAXD), one of the Vegetation Phenology and Productivity (VPP) parameters, is a product of the pan-European Medium Resolution Vegetation Phenology and Productivity (MR-VPP) component of the Copernicus Land Monitoring Service (CLMS). MAXD is the date (day of year) when vegetation reaches its maximum greenness or productivity during a growing season. The Plant Phenology Index (PPI) is a physically based vegetation index, developed for improving the monitoring of the vegetation growth cycle. The PPI index values, The PPI index values, withwith daily inputs, are first used in a function fitting to derive the PPI Seasonal Trajectories. From these Seasonal Trajectories, a suite of 13 Vegetation Phenology and Productivity (VPP) parameters are then computed and provided, for up to two seasons each year. The SOSD is one of the 13 parameters. The MAXD time series dataset is made available as raster files with 392 x 392m resolution, in ETRS89-LAEA projection corresponding to the MCD43 tiling grid. IMPORTANT: The full access to open and free data for this resource will be made available upon request.
-
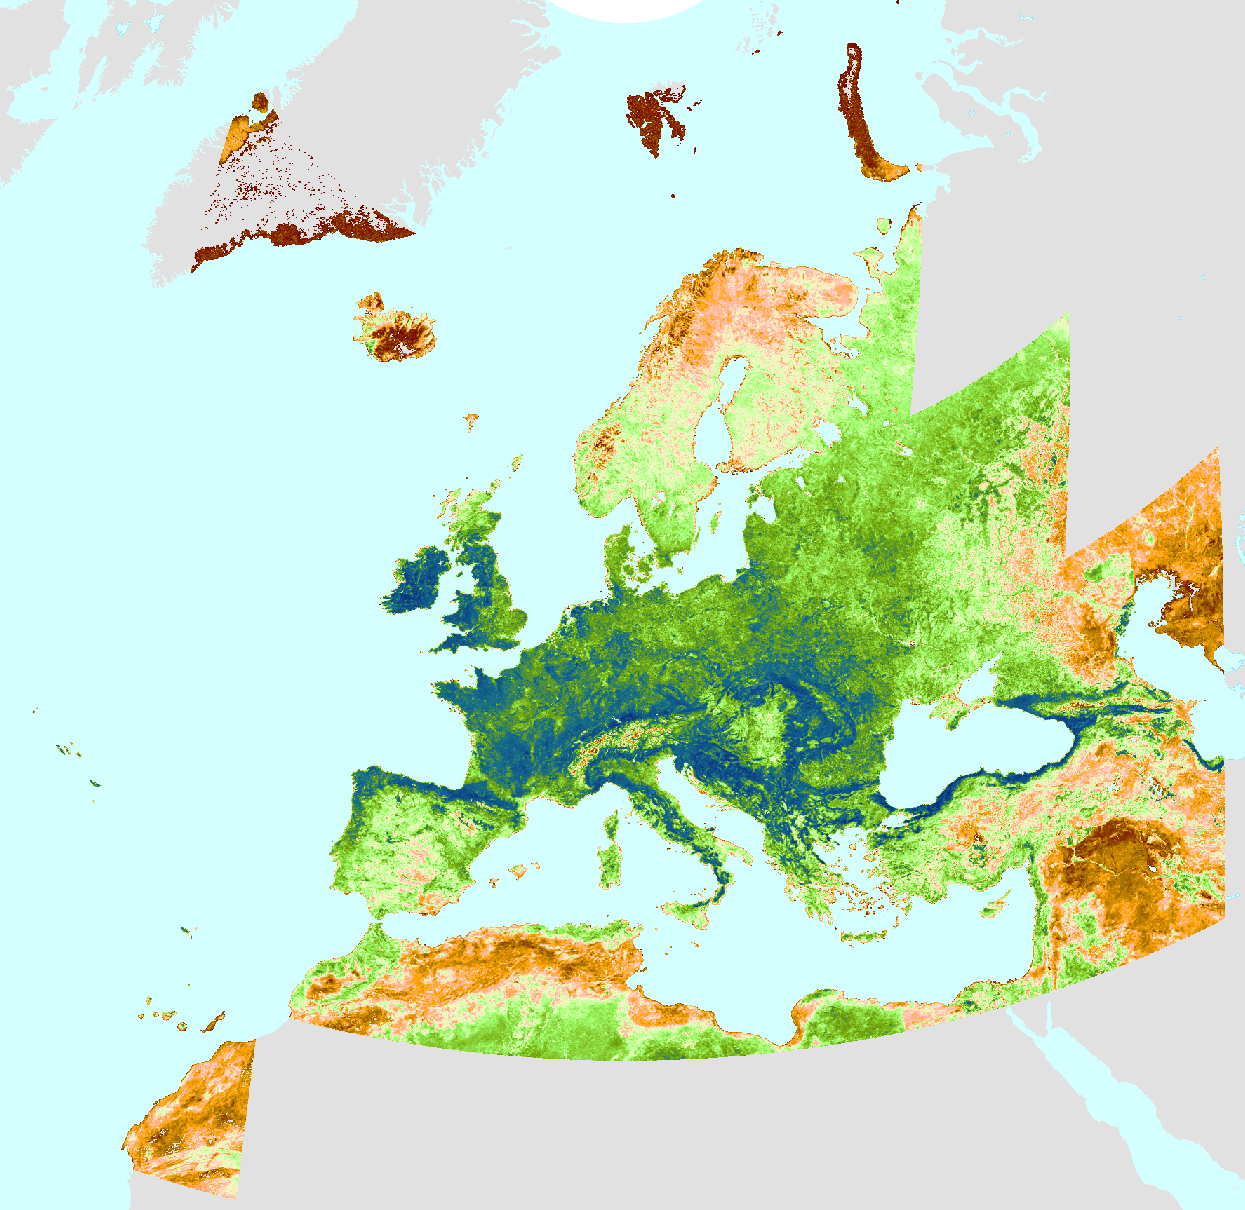
The seasonal productivity (SPROD), one of the Vegetation Phenology and Productivity (VPP) parameters, is a product of the pan-European Medium Resolution Vegetation Phenology and Productivity (MR-VPP) component of the Copernicus Land Monitoring Service (CLMS). The SPROD defined as the cumulative sum of daily deviations from the base level between the start and end of the growing season. The Plant Phenology Index (PPI) is a physically based vegetation index, developed for improving the monitoring of the vegetation growth cycle. The PPI index values, withwith daily inputs, are first used in a function fitting to derive the PPI Seasonal Trajectories. From these Seasonal Trajectories, a suite of 13 Vegetation Phenology and Productivity (VPP) parameters are then computed and provided, for up to two seasons each year. The SPROD is one of the 13 parameters. The SPROD time series dataset is made available as raster files with 392 x 392m resolution, in ETRS89-LAEA projection corresponding to the MCD43 tiling grid. IMPORTANT: The full access to open and free data for this resource will be made available upon request.
-
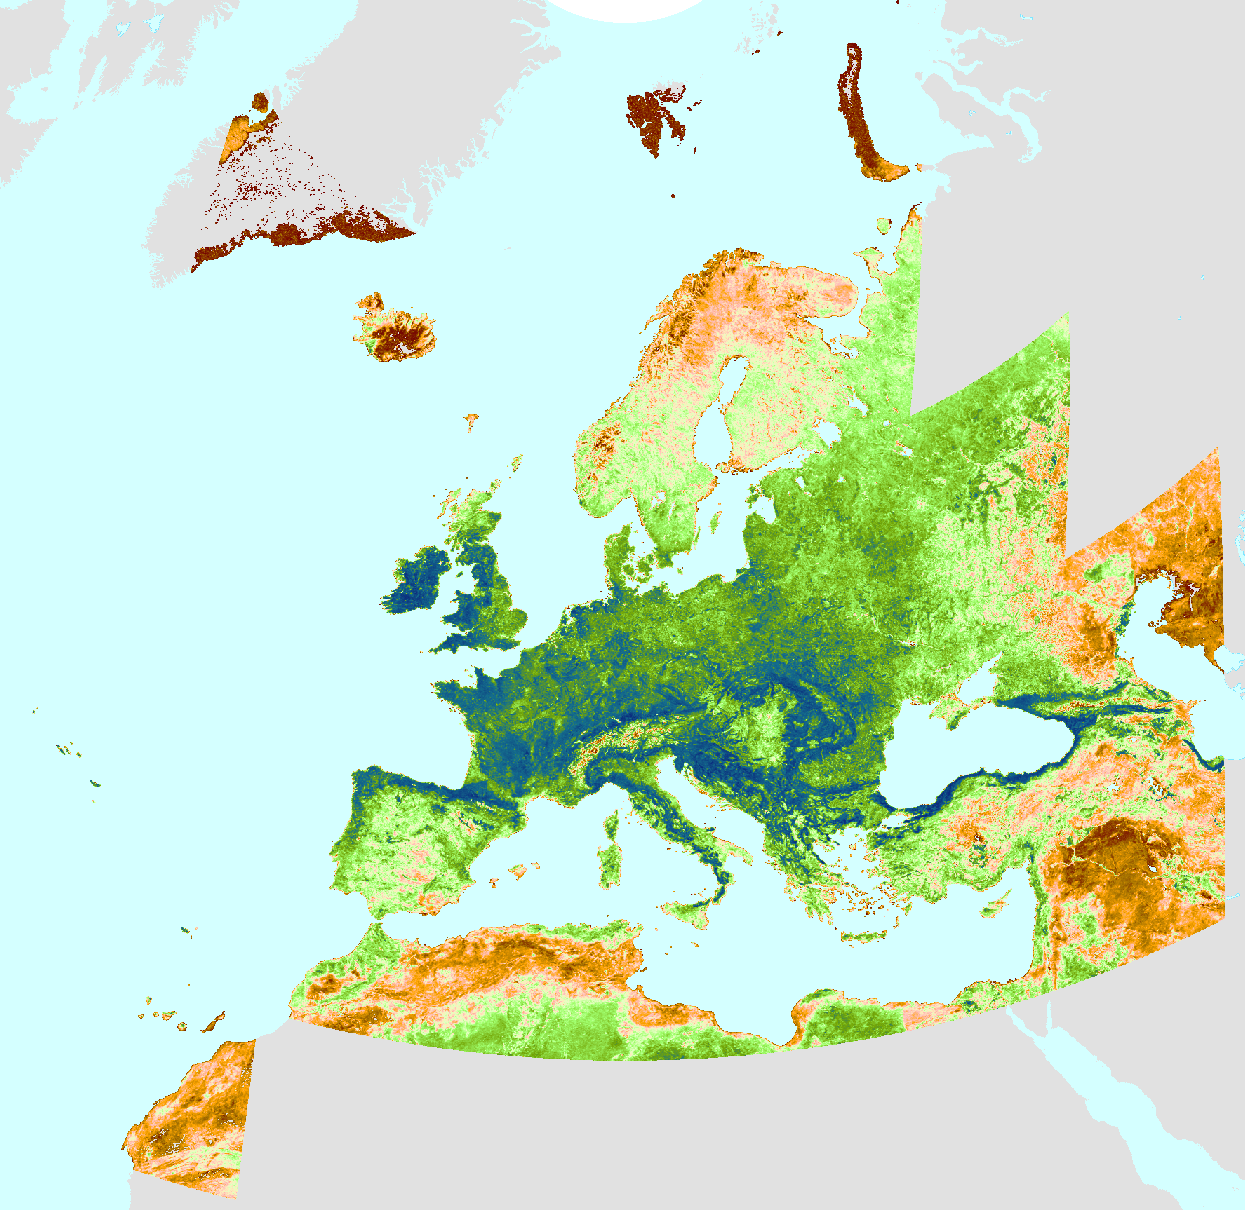
This metadata refers to the Plant Phenology Index (PPI) time series that is a near real-time (NRT) dataset of the pan-European Medium Resolution Vegetation Phenology and Productivity (MR-VPP) product. The MR-VPP is a component of the Copernicus Land Monitoring Service (CLMS). The Plant Phenology Index (PPI) is a physically based vegetation index for improved monitoring of plant phenology, that is developed from a simplified solution to the radiative transfer equation by Jin and Eklundh (2014). PPI has a linear relationship with green leaf area index, a strong correlation with gross primary productivity, and is capable of disentangling remotely sensed plant phenology from snow seasonality. The PPI time series dataset is made available as raster files with 392 x 392m resolution, in ETRS89-LAEA projection corresponding to the MCD43 tiling grid. The dataset is generated with daily inputs, but provided with 5-day PPI outputs, along with quality flags. IMPORTANT: The full access to open and free data for this resource will be made available upon request.