Orthoimagery
Type of resources
Available actions
Topics
Keywords
Contact for the resource
Provided by
Years
Formats
Update frequencies
status
Service types
Scale
Resolution
-
Orthoimagery - Annex 1
-

[IS] Loftmyndirnar, sem bandaríski herinn safnaði á árunum 1945-1946, eru svokallaðar AMS myndir (American Mapping Service). Afrit af filmum AMS myndanna er að finna í loftmyndasafni Náttúrufræðistofnunar. Árið 2024 voru filmurnar skannaðar af fyrirtækinu Wehrli & Co (í Bandaríkjunum) með á 20 míkróna punktstærð og 8-bita dýpt. Staðsetning myndanna var gerð handvirkt. Hægt er að sjá upphaf og endi fluglína með því að skoða hvernig myndirnar tengjast hver annarri. Auk þess eru upplýsingar (handskrifaðar) á hverja fluglínu, svo sem dagsetning, flughæð og brennivídd linsu. Með því að skoða hverja fluglínu og bera myndirnar innan fluglínunnar saman við mósaík af myndum (Maxar mósaík) var búinn til vektor þar sem miðja fyrstu og síðustu myndanna var staðsett. Ef margar myndanna voru mjög skýjaðar var þeirri fluglínu skipt niður í marga hluta og skýjuðu myndirnar fjarlægðar. Nokkrum eigindum var bætt við fitjurnar, svo sem dagsetningu myndatöku, myndanúmeri við upphaf og enda fluglínu, brennivídd linsu og flughæð. Að lokum var framkvæmd brúun (e. interpolation) til að ákvarða staðsetningu mynda innan hverrar fluglínu. Þetta byggist á staðsetningu fyrstu og síðustu myndar fluglínunnar og er gengið út frá því að allar myndirnar hafi verið teknar með reglulegu millibili. Áætluð nákvæmni staðsetningar er ± 2 km. Heimild: Náttúrufræðistofnun. Loftmyndir AMS 1945 - 1946. Dagsetning myndar. loftmyndasja.gis.is. [Loftmynd]. [EN]: The aerial photographs collected by the US military in 1945-1946 are the so-called American Mapping Service (AMS) images. A copy of the films of the AMS images is available at the archive of aerial photographs of the National Land Survey of Iceland. In 2024, these films were scanned by the company Wehrli & co (in US), at a scanning resolution of 20 microns and 8-bits. The location of these images was extracted by manual and visual inspection of the scanned images. The start and end of a flightline can be seen visually by identifying which images are connected with each other. Besides this, the beginning and the end of each flightlines have hand-written a series of information of the flightline, such as the date, flight height and focal length. By visually inspecting each flightline, and comparing the images within a flightline with a generic mosaic of images (Maxar mosaic), we digitized a vector with the location of the first and last center of the images of each flightline with georeferenced coordinates. In some cases, if the flightline contained multiple images only containing clouds, the cloudy images were discarded and the flightline was split into multiple segments. We wrote several attributes into these features, such as the date of acquisition, image number of the start and end of the flightline, focal length and flight height. Once this process was finished, the location of the images within each flightline was linearly interpolated based on the location of the first and last image of the flightline, assuming that all the images were taken at a regular interval. The expected accuracy of the geolocation is ± 2 km. Citation: Natural Science Institute of Iceland [Náttúrufræðistofnun]. Aerial photographs AMS 1945 - 1946 [Loftmyndir AMS 1945 - 1946]. Imagery date. loftmyndasja.gis.is. [Aerial Imagery].
-

[IS] Loftmyndir, sem bandaríski herinn tók á árunum 1956-1961, eru svokallaðar DMA myndir (Defense Mapping Agency). Afrit af filmum DMA myndanna er að finna í loftmyndasafni Náttúrufræðistofnunar (áður Landmælinga Íslands). Árið 2024 voru filmurnar skannaðar af fyrirtækinu Wehrli & Co (í Bandaríkjunum) með 20 míkróna punktstærð og 8-bita dýpt. Staðsetning myndanna var unnin út frá níu kortum í mælikvarðanum 1:250.000. Fluglínur voru upphaflega handteiknaðar á kortin, kortin voru hnitsett og seinna var fluglínunum settar á vektorform, þar sem fyrstu og síðustu myndanúmer hverrar fluglínu voru skráð sem eigindir. Í kjölfariðið var gagnagrunnurinn endurskoðaður með því að rýna skönnuðu myndirnar. Auka upplýsingum var bætt við eigindatöfluna, svo sem dagsetningar ljósmyndanna, brennivídd og flughæð. Fluglínurnar voru einnig flokkaðar eftir staðsetningu og nálægum dagsetningum í eigindinni „svæði“. Hverri fluglínu var umbreytt í punkta, þar sem gert var ráð fyrir að punktarnir væru miðja fyrstu og síðustu mynda fluglínunnar. Staðsetning miðju allra hinna myndanna meðfram viðkomandi fluglínu var línulega áætluð, miðað við að allar myndirnar væru teknar með reglulegu millibili. Áætluð nákvæmni staðsetningar er ± 2 km. Heimild: Náttúrufræðistofnun. Loftmyndir DMA1956 - 1961. Dagsetning myndar. loftmyndasja.gis.is. [Loftmynd]. [EN] The aerial photographs collected by the US military in 1956-1961 are the so-called Defense Mapping Agency (DMA) images. A copy of the films of the DMA images is available at the archive of aerial photographs of the National Land Survey of Iceland. In 2024, these films were scanned by the company Wehrli & co (in US), at a scanning resolution of 20 microns and 8-bits. The location of these images was extracted by a series of nine maps in 1:250.000 which had hand-drawn the flightlines relative to these images. These maps were georeferenced and the flightlines were digitized into vectors, writing the first and last image numbers of each flightline as attributes. Once this was finished, a revision of the database was made, by inspecting the scanned images. Extra information was added into the table, such as the date of the photographs, the focal length and flight height. The flightlines were also grouped by location and nearby dates, into the attribute "area". Finally, each flightine was converted into points, assuming these points to be the first and last center of the images of the flightline. The location of the center of all the remaining images along a flightline were linearly interpolated, assuming that all the images were taken at regular intervals. The expected accuracy of the geolocation is ± 2 km. Citation: Natural Science Institute of Iceland [Náttúrufræðistofnun]. Aerial photographs DMA 1956 - 1961 [Loftmyndir DMA 1956-1961]. Imagery date. loftmyndasja.gis.is. [Aerial Imagery].
-
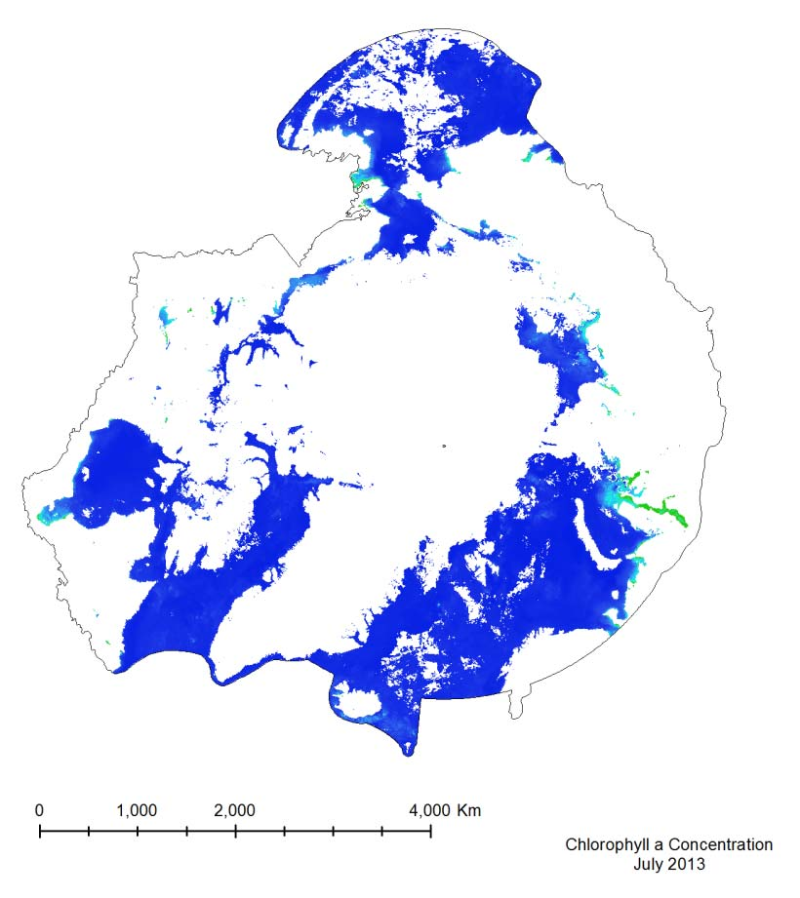
The MODIS marine chlorophyll a product provided, similar to SST, is a 4 km global monthly composite based on smaller resolution daily imagery compiled by NASA. The imagery is reliant on clear ocean (free of clouds and ice) so only months from March to October have been provided, as the chlorophyll levels in the Arctic diminish during the winter months, when sea ice is prevalent. The marine chlorophyll a is measured in mg/m3
-
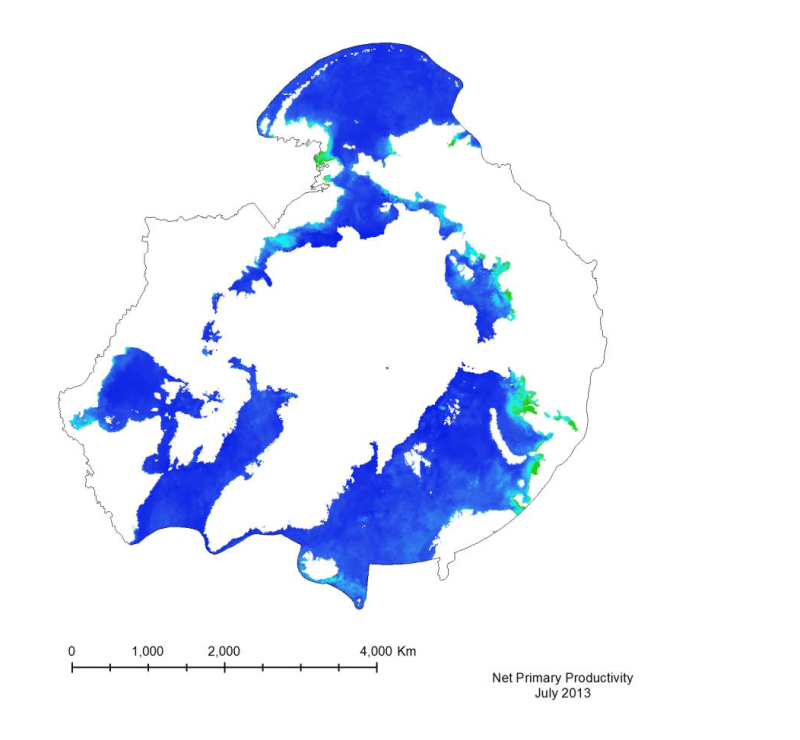
Marine primary productivity is not available from the NASA Ocean Color website. Currently the best product available for marine primary productivity is available through Oregon State University’s Ocean Productivity Project. A monthly global Net Primary Productivity product at 9 km spatial resolution has been selected for this analysis. The algorithm used to create the primary productivity is a Vertically Generalized Production Model (VGPM) created by Behrenfeld and Falkowski (1997). It is a “chlorophyll-based” model that estimates net primary production from chlorophyll using a temperature-dependent description of chlorophyll photosynthetic efficiency (O’Malley 2010). Inputs to the function are chlorophyll, available light, and photosynthetic efficiency.
-
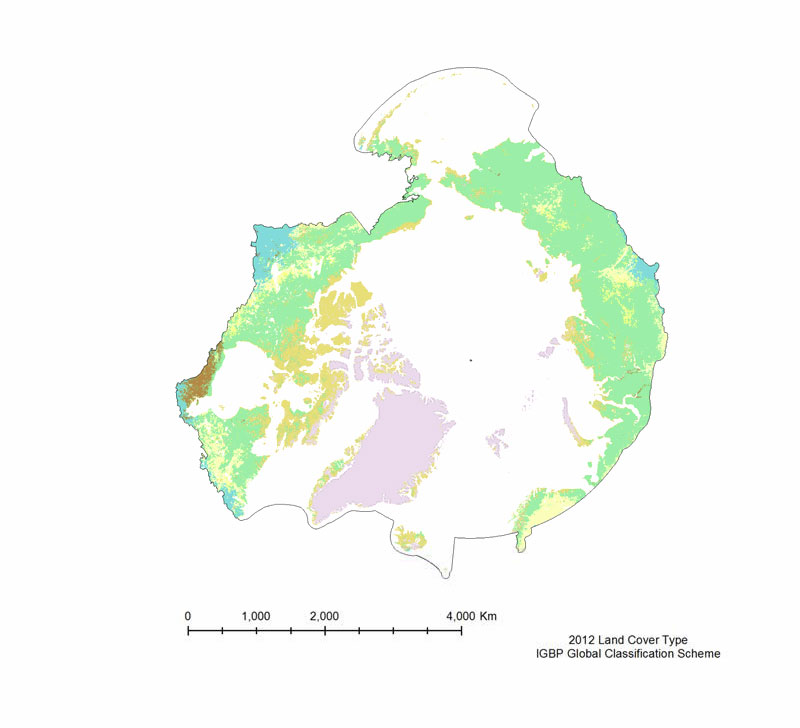
The MODIS Land Cover Type product is created yearly using three landclassification schemes; the International Geosphere Biosphere Programme (IGBP)classification scheme, the Univertiy of Maryland (UMD) classification scheme, and aMODIS-derived Leaf Area Index /Fraction of Photosynthetically Active Radiation(LAI/fPAR) classification scheme (Table 3). The International Geosphere Biosphere Programme (IGBP) identifies seventeenland cover classes, including eleven natural vegetation classes, three non-vegetated landclasses, and three developed land classes. The product provided is derived using the samealgorithm as the 500 m Land Cover Type (MOD12Q1), but is on a 0.05° Climate Model Grid(CMG), that has been clipped to the pan-Arctic extent. The UMD classification scheme issimilar to the IGBP classification scheme, but it excludes the Permanent wetlands,Cropland/Natural vegetation mosaic, and the Snow and ice classes. The LAI/fPARclassification scheme is the smallest of the three, and focuses on forest structure; it only haseleven classes. All three land cover classification schemes are provided, but the IGBPclassification scheme is the most amenable to the Pan-Arctic region.
-
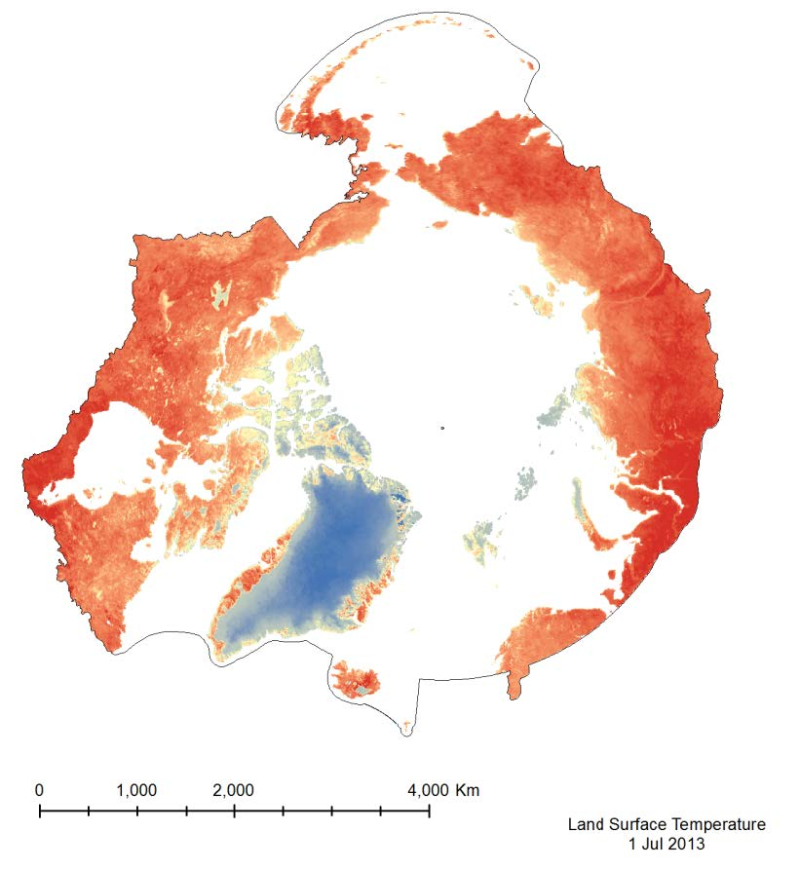
The MODIS Land Surface Temperature (LST) product provided is a monthlycomposite configured on a 0.05° Climate Model Grid (CMG). It includes both daytime andnighttime surface temperatures, taken at 11 um and 4 um (night). This product has beenscaled. To convert the raster values to a Kelvin temperature scale, multiply by a factor of 0.02.
-

IS: Loftmyndasjáin er vefsjá með sögulegum loftmyndum og er byggð á loftmyndasafni Náttúrufræðistofnunar sem nær rúmlega 80 ár aftur í tímann. Vefsjáin var hönnuð hjá Landmælingum Íslands. Loftmyndunum sem finna má í vefsjánni (https://www.lmi.is/is/landupplysingar/fjarkonnun/loftmyndasafn) hefur verið safnað úr flugvél, þær skannaðar og breytt í kort. Loftmyndasjáin nýtist við kennslu, rannsóknir og sögu auk þess að svala almennri forvitni. Aðgangur að vefsjánni er öllum opinn og án gjaldtöku. Heimild: Náttúrufræðistofnun. Loftmyndasjá. Dagsetning myndar. loftmyndasja.gis.is. [Loftmynd]. EN: The Loftmyndasjá is a webviewer with historical aerial imagery from the Natural Science Institute of Iceland's historical imagery archive (https://www.lmi.is/is/landupplysingar/fjarkonnun/loftmyndasafn) . The viewer covers imagery from the past 80 years, and was designed at the Land Survey of Iceland (now Natural Science Institute of Iceland). The imagery found in the Loftmyndasjá has been collected from airplanes, scanned into digital format, and turned into map layers. The web viewer is open and free to all. Citation: Natural Science Institute of Iceland [Náttúrufræðistofnun]. Historical Imagery Map [Loftmyndasjá]. Imagery date. loftmyndasja.gis.is. [Aerial Imagery].
-
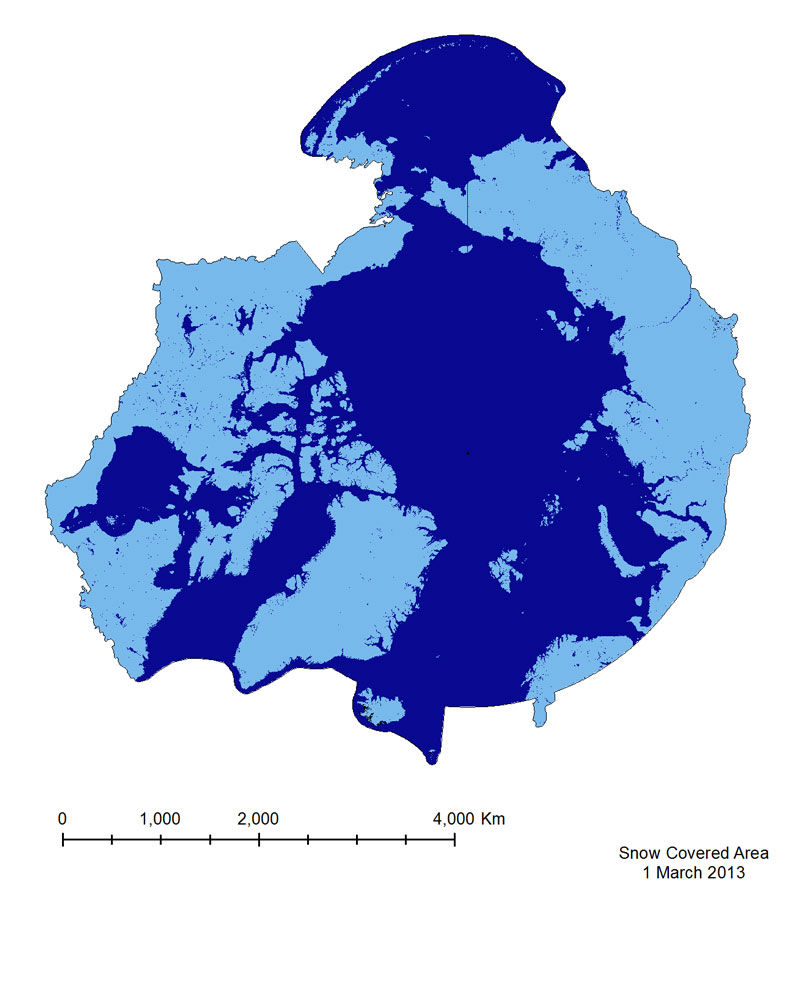
The Snow Covered Area product is based on a Normalized Difference Snow Index(NDSI), which is similar to NDVI, but exploits different bands in the equation (Equation 3),namely Green (Band 4) and Short Wavelength Near-infrared (SWNIR, Band 6). It isimportant to note that the Band 6 sensor on MODIS Aqua malfunctioned shortly after launch,so Snow Covered Area from the Aqua sensor is calculated using Bands 3 and 7. This mayintroduce errors in identifying snow in vegetated areas, as the use of Band 7 results in falsesnow detection. For this reason the MODIS Terra product has been provided for the CAFF-system.
-

The pan-European High Resolution (HR) Image Mosaic 2015 provides up to two cloud-free HR optical coverage 2 of EEA39 countries including all islands of those countries plus French Overseas Departments (DOMs) acquired within predefined windows corresponding to the vegetation season in 2014-2015. Images are derived from the following satellite sensors: Resourcesat-1/2 SPOT-5 Sentinel-2 MSI The mosaic primarily is used as input data in the production of various Copernicus Land Monitoring Service (CLMS) datasets and services, such as land cover maps and high resolution layers on land cover characteristic and can be also useful for CLMS users for visualizations and classifications on land. The input imagery for the creation of the mosaic is provided by ESA. Due to license restrictions, HR Image Mosaic 2015 is only available as a web service (WMS), and not for data download.
 Arctic SDI catalogue