 Arctic SDI catalogue
Annually
Type of resources
Available actions
Topics
Keywords
Contact for the resource
Provided by
Years
Formats
Resolution
-
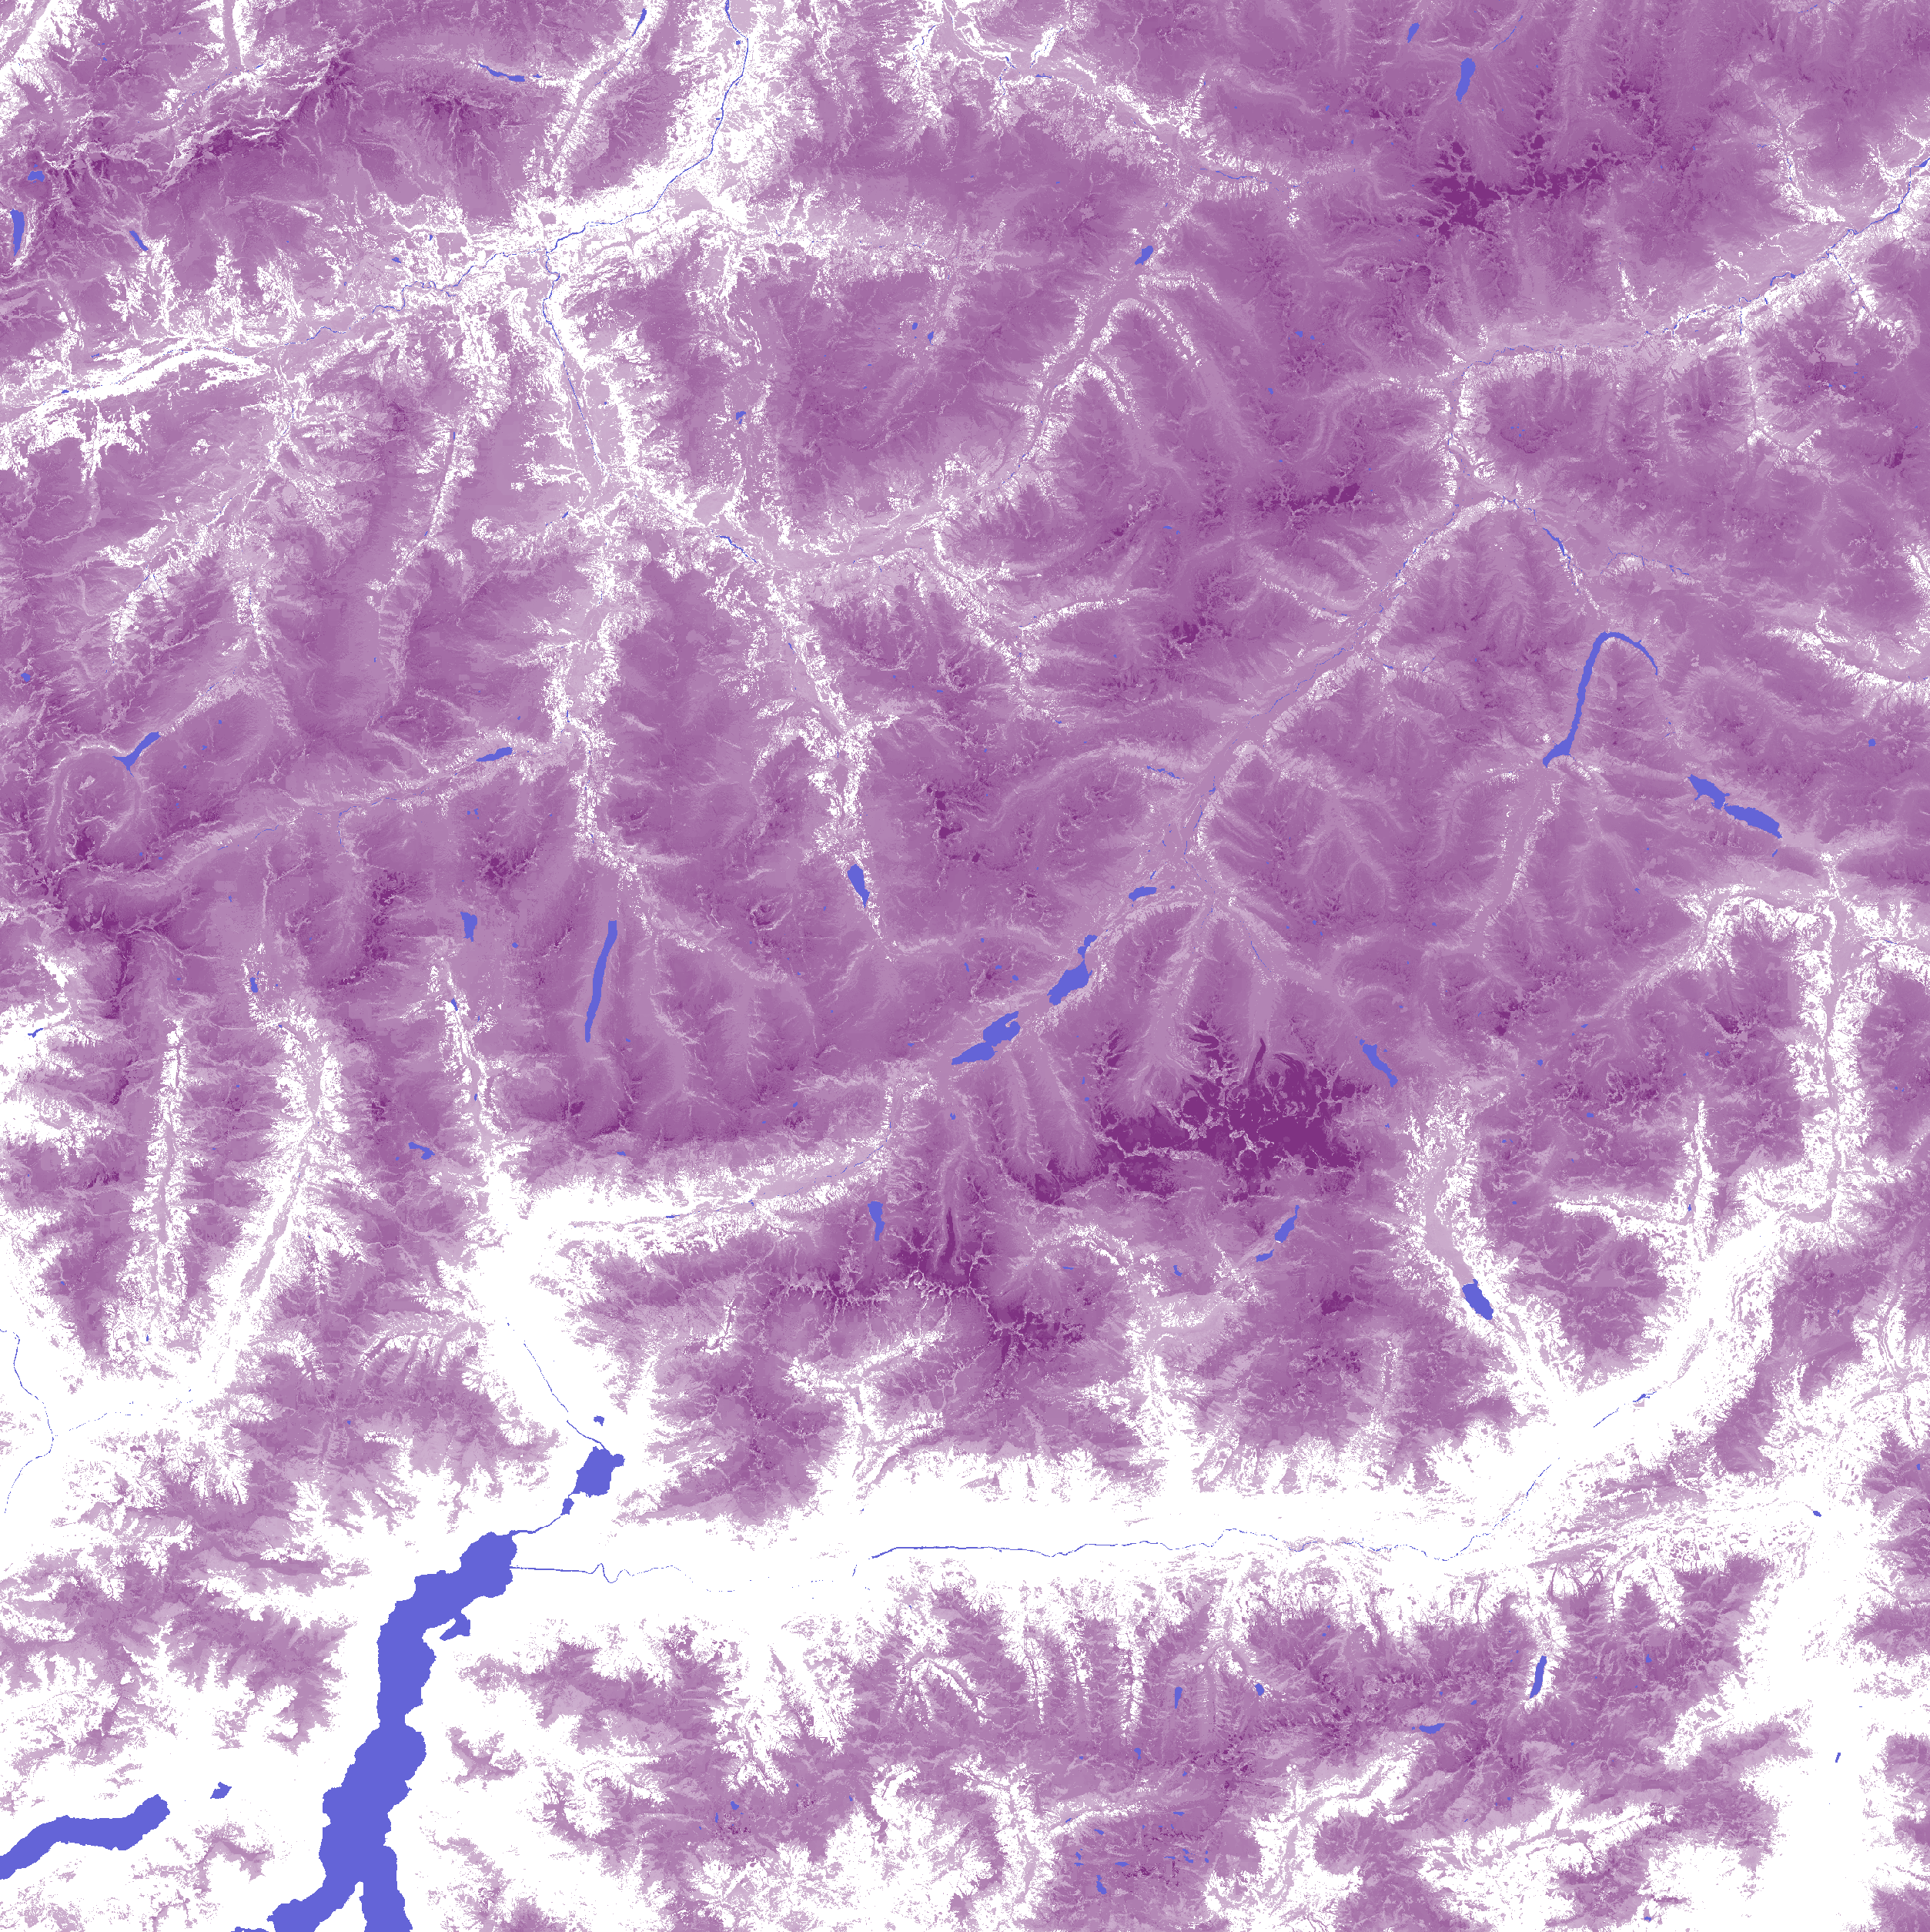
The Copernicus Persistent Snow Area (PSA) product is generated annually for the entire EEA38 and the United Kingdom, based on the Fractional Snow Cover (FSC) information. It provides the extent of the persistent snow cover, i.e. the area where snow is present throughout the hydrological year with a spatial resolution of 20 m x 20 m. This metadata refers to the PSA product distributed in raster files as tiles aligned with Sentinel-2 (UTM/WGS84) at 20 m x 20 m GSD. It is also available in another projection as tiles aligned with the Pan-European High-Resolution Layers in the European 20 m x 20 m grid (ETRS89 LAEA - EPSG: 3035). It is typically released on an annual basis with a release date in October, after the end of the hydrological year. Each product is composed of two separate files corresponding to the different layers of the product, and another metadata file. PSA is one of the products of the pan-European High-Resolution Snow & Ice service (HR-S&I), which are provided at high spatial resolution (20 m x 20 m and 60 m x 60 m), from the Sentinel-2 and Sentinel-1 constellations data from September 1, 2016 to September 1, 2024.
-

The Copernicus Persistent Snow Area (PSA) product is generated annually for the entire EEA38 and the United Kingdom, based on the Fractional Snow Cover (FSC) information. It provides the extent of the persistent snow cover, i.e. the area where snow is present throughout the hydrological year with a spatial resolution of 20 m x 20 m. This metadata refers to the PSA product distributed in raster files as tiles aligned with the Pan-European High-Resolution Layers in the European 20 m x 20 m grid (ETRS89 LAEA - EPSG: 3035). It is also available in another projection as tiles aligned with Sentinel-2 (UTM/WGS84) at 20 m x 20 m GSD. It is typically released on an annual basis with a release date in October, after the end of the hydrological year. Each product is composed of two separate GeoTIFF files corresponding to the different layers of the product, and another metadata file of the product. The first layer provides the PSA (with 'no data' pixels in case of cloud conditions for all observations over the period of computation) whereas the second layer provides the QC (Quality Control, with the confidence level on the PSA layer). PSA is one of the products of the pan-European High-Resolution Snow & Ice service (HR-S&I), which are provided at high spatial resolution (20 m x 20 m and 60 m x 60 m), from the Sentinel-2 and Sentinel-1 constellations data from September 1, 2016 to September 1, 2024.
-

The Sentinel-2 Snow Phenology (SP S2) product is generated once a year at European scale, based on Fractional Snow Cover (FSC) products calculated from Sentinel-2 optical data. This product describes the snow season in terms of temporality as it provides, within an hydrological year and for each pixel, the number of days with snow cover, as well as the first and the last day of the longest observed snow period. It has a spatial resolution of 20 m x 20 m, as does the input FSC product. The SP S2 product is distributed in raster files covering an area of 110 km by 110 km with a pixel size of 20 m by 20 m in UTM/WGS84 projection, which corresponds to the Sentinel-2 input L1C product tile. Each product is composed of separate files corresponding to the different layers of the product, and another metadata file." The product is also available in another projection as tiles aligned with the Pan-European High-Resolution Layers in the European grid (ETRS89 LAEA - EPSG: 3035) at 20 m x 20 m and 100 m x 100 m. SP S2 is one of the products of the pan-European High-Resolution Water Snow & Ice portfolio (HR-WSI), which are provided at high spatial resolution from the Sentinel-2 and Sentinel-1 constellations data from September 1, 2016 onwards.
-

The Sentinel-1 and Sentinel-2 Snow Phenology (SP S1+S2) product is generated once a year over high-mountain areas at European scale, based on daily cumulative Gap-Filled Fractional Snow Cover (GFSC) products calculated from Sentinel-2 optical and Sentinel-1 radar data. This product describes the snow season in terms of temporality as it provides, for each pixel, the number of days with snow cover, as well as the first and the last day of the longest observed snow period. It has a spatial resolution of 100 m x 100 m. Each product is composed of separate files corresponding to the different layers of the product, and another metadata file. The product is also available in another projection as tiles aligned with Sentinel-2 (UTM/WGS84) at 60 m x 60 m. SP S1+S2 is one of the products of the pan-European High-Resolution Water Snow & Ice portfolio (HR-WSI), which are provided at high spatial resolution from the Sentinel-2 and Sentinel-1 constellations data from September 1, 2016 onwards. t.
-

This is the metadata covering the Sentinel-1 and Sentinel-2 Snow Phenology (SPS1S2) product. It is generated once a year over high-mountain areas at European scale, based on daily cumulative Gap-Filled Fractional Snow Cover (GFSC) products calculated from Sentinel-2 optical and Sentinel-1 radar data. This product describes the snow season in terms of temporality as it provides, for each pixel, the number of days with snow cover, as well as the first and the last day of the longest observed snow period. It has a spatial resolution of 60 m x 60 m, as does the input GFSC product. Each product is composed of separate files corresponding to the different layers of the product, and another metadata file." The product is also available in another projection as tiles aligned with the Pan-European High-Resolution Layers in the European grid (ETRS89 LAEA - EPSG: 3035) at 60 m x 60 m and 100 m x 100 m. SP S2+S2 is one of the products of the pan-European High-Resolution Water Snow & Ice portfolio (HR-WSI), which are provided at high spatial resolution from the Sentinel-2 and Sentinel-1 constellations data from September 1, 2016 onwards.
-
The Sentinel-2 Snow Phenology (SP S2) product is generated once a year at European scale, based on Fractional Snow Cover (FSC) products calculated from Sentinel-2 optical data. This product describes the snow season in terms of temporality as it provides, within an hydrological year and for each pixel, the number of days with snow cover, as well as the first and the last day of the longest observed snow period. It has a spatial resolution of 100 m x 100 m. Each product is composed of separate files corresponding to the different layers of the product, and another metadata file." The product is also available in another projection as tiles aligned with Sentinel-2 (UTM/WGS84) at 20 m x 20 m. SP S2 is one of the products of the pan-European High-Resolution Water Snow & Ice portfolio (HR-WSI), which are provided at high spatial resolution from the Sentinel-2 and Sentinel-1 constellations data from September 1, 2016 onwards.
-

The Season Maximum Value (MAXV), one of the Vegetation Phenology and Productivity (VPP) parameters, is a product of the pan-European High Resolution Vegetation Phenology and Productivity (HR-VPP) component of the Copernicus Land Monitoring Service (CLMS). The Season Maximum Value (MAXV) provides the maximum (peak) value that the Plant Phenology Index (PPI) reaches during the vegetation growing season. The Plant Phenology Index (PPI) is a physically based vegetation index, developed for improving the monitoring of the vegetation growth cycle. The PPI index values, with 5-day satellite revisit cycle, are first used in a function fitting to derive the PPI Seasonal Trajectories, which is a filtered time series with regular 10-day time step. From these Seasonal Trajectories, a suite of 13 Vegetation Phenology and Productivity (VPP) parameters are then computed and provided, for up to two seasons each year. The Season Maximum Value is one of the 13 parameters. The full list is available in the table 3 of the Product User Manual in the below link section. A complementary quality indicator (QFLAG) provides a confidence level, that is described in table 4 of the same manual. The MAXV dataset is made available as raster files with 10 x 10m resolutionand 100 x 100m resolutions, in ETRS89-LAEA projection corresponding to the HRL grid, for those tiles that cover the EEA38 countries and the United Kingdom and for two seasons in each year from 2017 onwards. It is updated in the first quarter of each year.
-
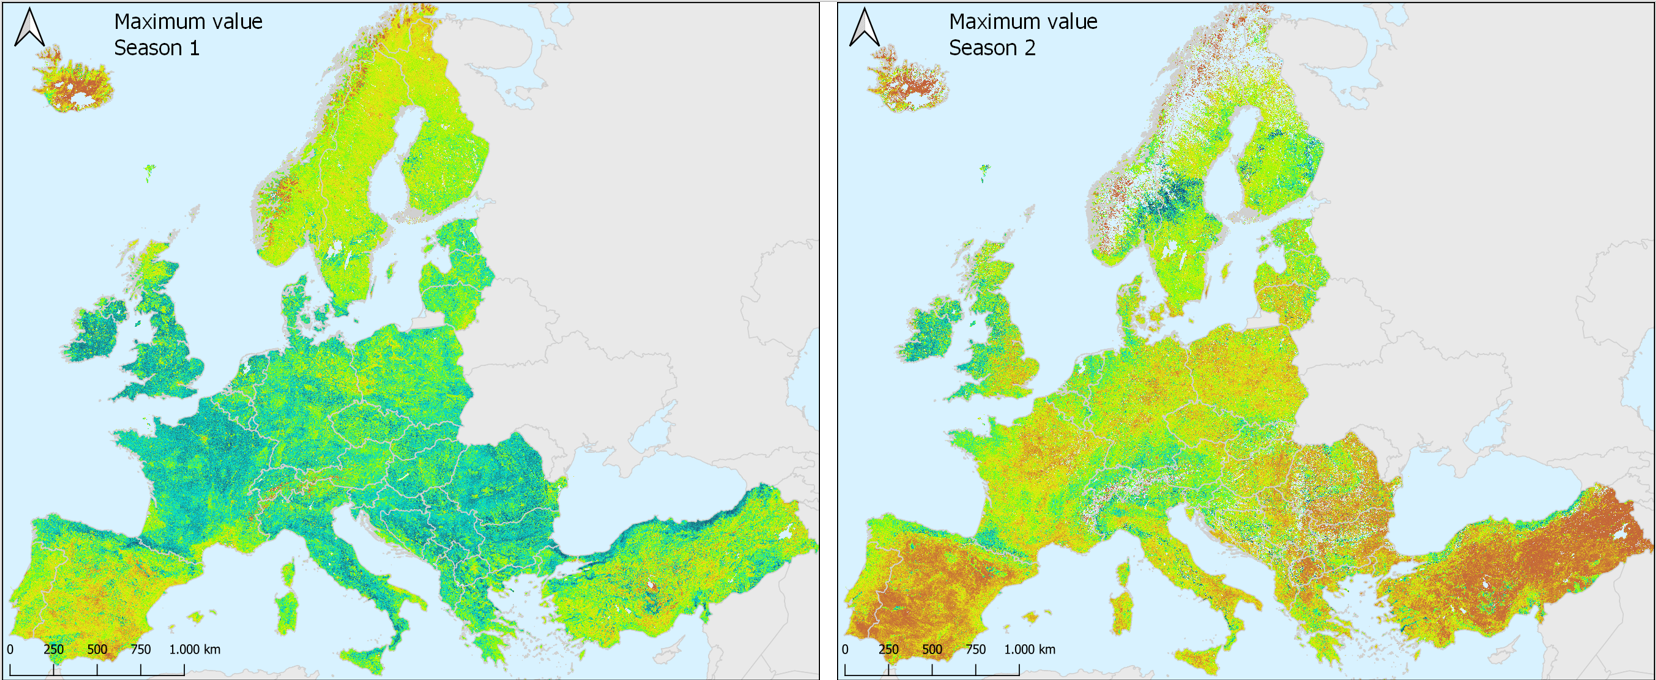
The Season Maximum Value (MAXV), one of the Vegetation Phenology and Productivity (VPP) parameters, is a product of the pan-European High Resolution Vegetation Phenology and Productivity (HR-VPP) component of the Copernicus Land Monitoring Service (CLMS). The Season Maximum Value (MAXV) provides the maximum (peak) value that the Plant Phenology Index (PPI) reaches during the vegetation growing season. The Plant Phenology Index (PPI) is a physically based vegetation index, developed for improving the monitoring of the vegetation growth cycle. The PPI index values, with 5-day satellite revisit cycle, are first used in a function fitting to derive the PPI Seasonal Trajectories, which is a filtered time series with regular 10-day time step. From these Seasonal Trajectories, a suite of 13 Vegetation Phenology and Productivity (VPP) parameters are then computed and provided, for up to two seasons each year. The Season Maximum Value is one of the 13 parameters. A complementary quality indicator (QFLAG) provides a confidence level, that is described in table 4 of the same manual. The MAXV dataset is made available as raster files with 10 x 10m resolution, in UTM/WGS84 projection corresponding to the Sentinel-2 tiling grid, for those tiles that cover the EEA38 countries and the United Kingdom and for two seasons in each year from 2017 onwards. It is updated in the first quarter of each year.
-
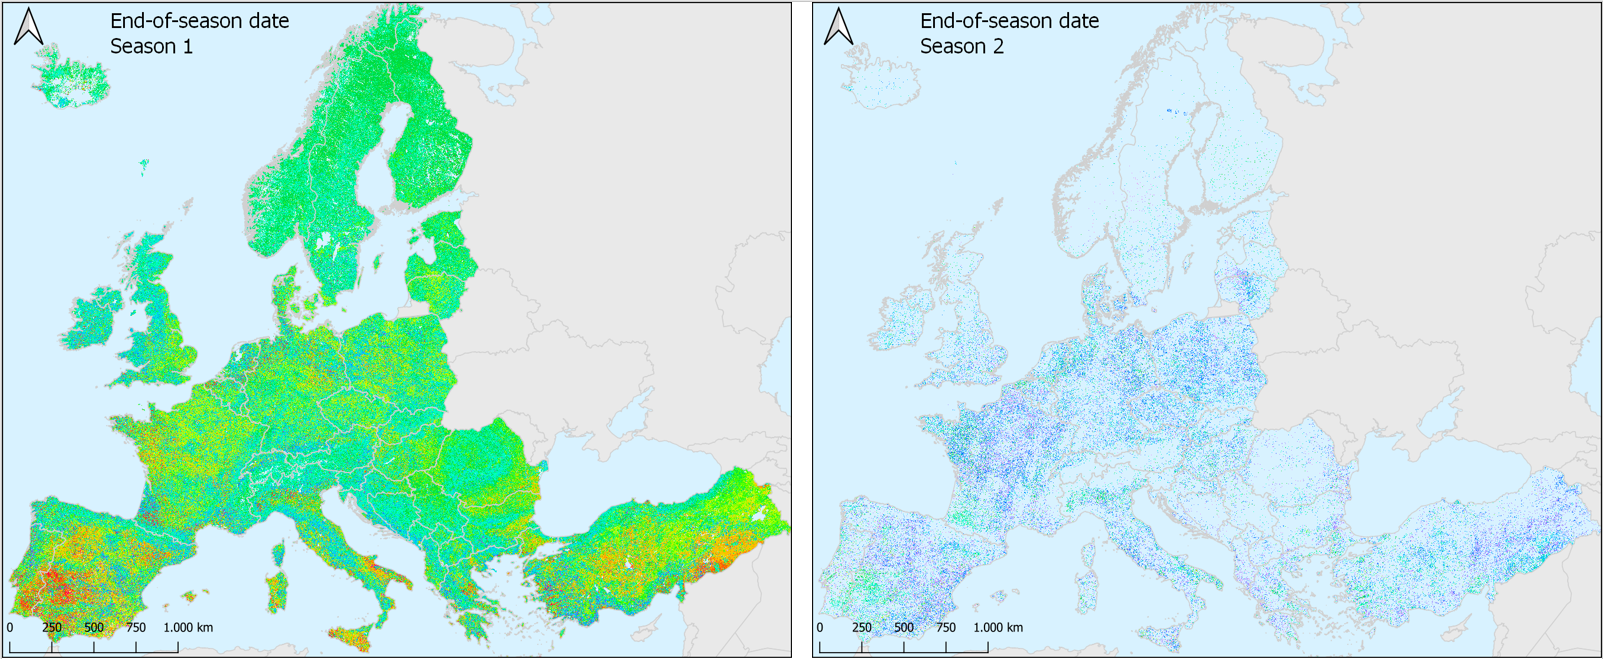
The End-of-Season Date (EOSD), one of the Vegetation Phenology and Productivity (VPP) parameters, is a product of the pan-European High Resolution Vegetation Phenology and Productivity (HR-VPP) component of the Copernicus Land Monitoring Service (CLMS). The End-of-Season Date (EOSD) marks the date when the vegetation growing season ends in the time profile of the Plant Phenology Index (PPI). The end-of-season occurs, by definition, when the PPI value reaches 15% of the season amplitude during the green-down period. The Plant Phenology Index (PPI) is a physically based vegetation index, developed for improving the monitoring of the vegetation growth cycle. The PPI index values, with 5-day satellite revisit cycle, are first used in a function fitting to derive the PPI Seasonal Trajectories, which is a filtered time series with regular 10-day time step. From these Seasonal Trajectories, a suite of 13 Vegetation Phenology and Productivity (VPP) parameters are then computed and provided, for up to two seasons each year. The End-of-Season Date is one of the 13 parameters. A complementary quality indicator (QFLAG) provides a confidence level, that is described in table 4 of the same manual. The EOSD dataset is made available as raster files with 10 x 10m resolution, in UTM/WGS84 projection corresponding to the Sentinel-2 tiling grid, for those tiles that cover the EEA38 countries and the United Kingdom and for two seasons in each year from 2017 onwards. It is updated in the first quarter of each year.
-
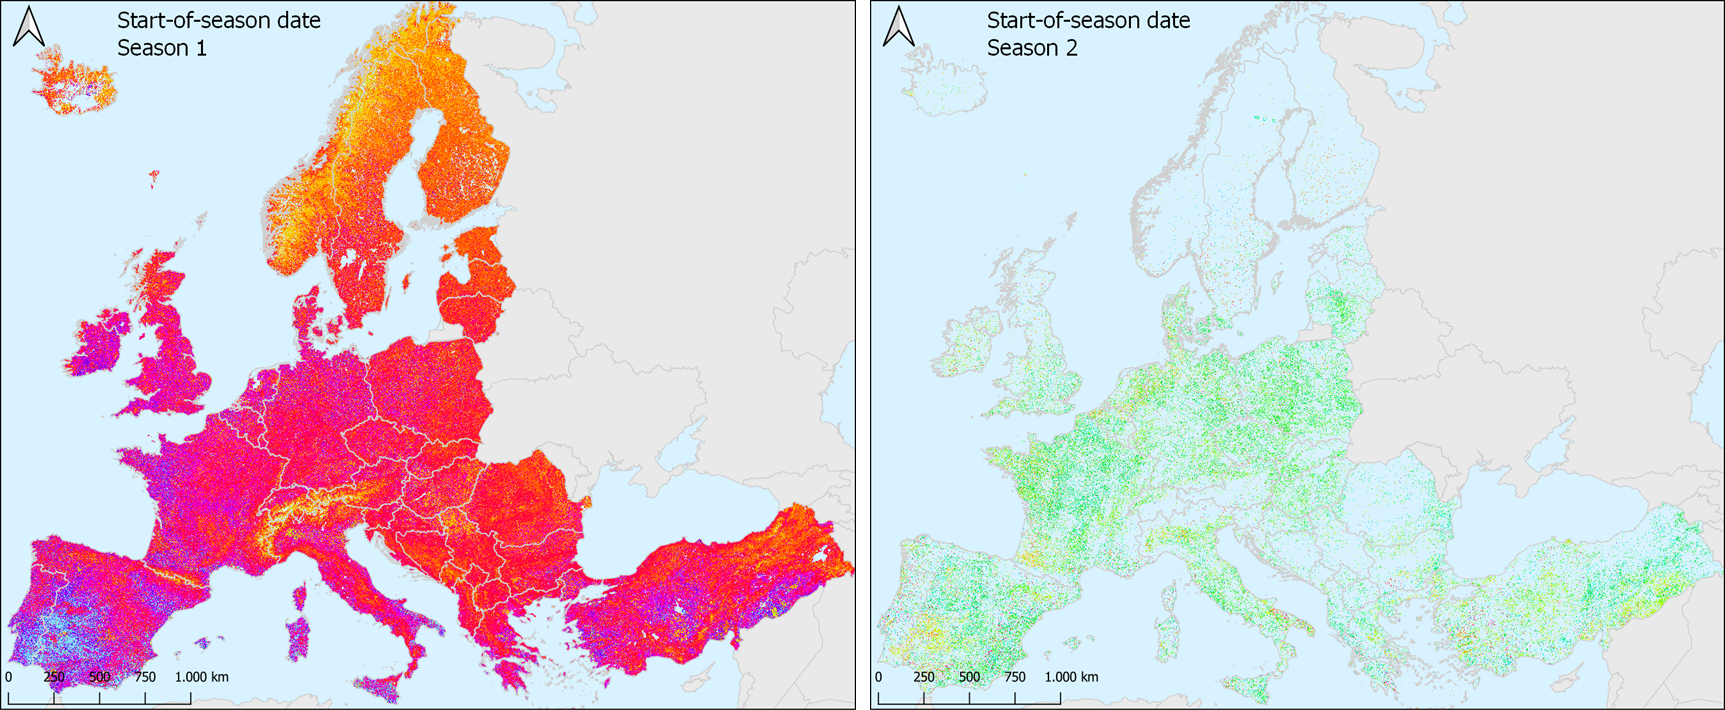
The Start-of-Season Date (SOSD), one of the Vegetation Phenology and Productivity (VPP) parameters, is a product of the pan-European High Resolution Vegetation Phenology and Productivity (HR-VPP) component of the Copernicus Land Monitoring Service (CLMS). The Start-of-Season Date (SOSD) marks the date when the vegetation growing season starts in the time profile of the Plant Phenology Index (PPI). The start-of-season occurs, by definition, when the PPI value reaches 25% of the season amplitude during the green-up period. The Plant Phenology Index (PPI) is a physically based vegetation index, developed for improving the monitoring of the vegetation growth cycle. The PPI index values, with 5-day satellite revisit cycle, are first used in a function fitting to derive the PPI Seasonal Trajectories, which is a filtered time series with regular 10-day time step. From these Seasonal Trajectories, a suite of 13 Vegetation Phenology and Productivity (VPP) parameters are then computed and provided, for up to two seasons each year. The Start-of-Season Date is one of the 13 parameters. The full list is available in the table 3 of the Product User Manual in the below link section. A complementary quality indicator (QFLAG) provides a confidence level, that is described in table 4 of the same manual. The SOSD dataset is made available as raster files with 10 x 10m and 100 x 100m resolutions, in ETRS89-LAEA projection corresponding to the HRL grid, for those tiles that cover the EEA38 countries and the United Kingdom and for two seasons in each year from 2017 onwards. It is updated in the first quarter of each year.