Biomasse
Type of resources
Available actions
Keywords
Contact for the resource
Provided by
Years
Formats
Representation types
Update frequencies
status
Service types
-

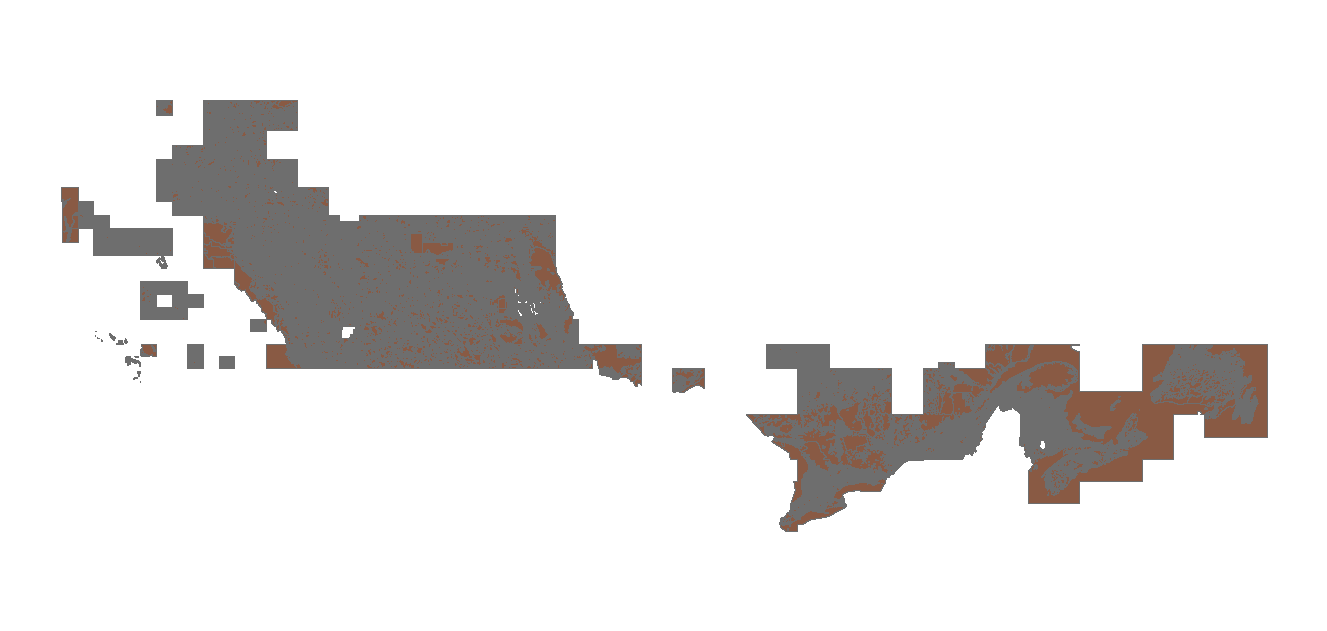
The “Biomass Agriculture Inventory Median Values” dataset is a table that contains the median agricultural residue yield and crop production for each Biomass Report Framework cell. It provides the median annual value for the years 1985-2016. The table includes straw or stover information for barley, wheat, flax, oats and corn, and crop information for barley, wheat, flax, oats, corn, canola and soybean. This dataset also includes information about the type of tillage used in the area and demand for straw used for cattle bedding and feed. These values are derived from Statistics Canada data. Additionally, the dataset includes the amount of agricultural residue calculated as necessary to remain on the field to prevent soil degradation. The risk of soil degradation is directly related to the type of tillage in use as well as the landscape attributes of the area.
-

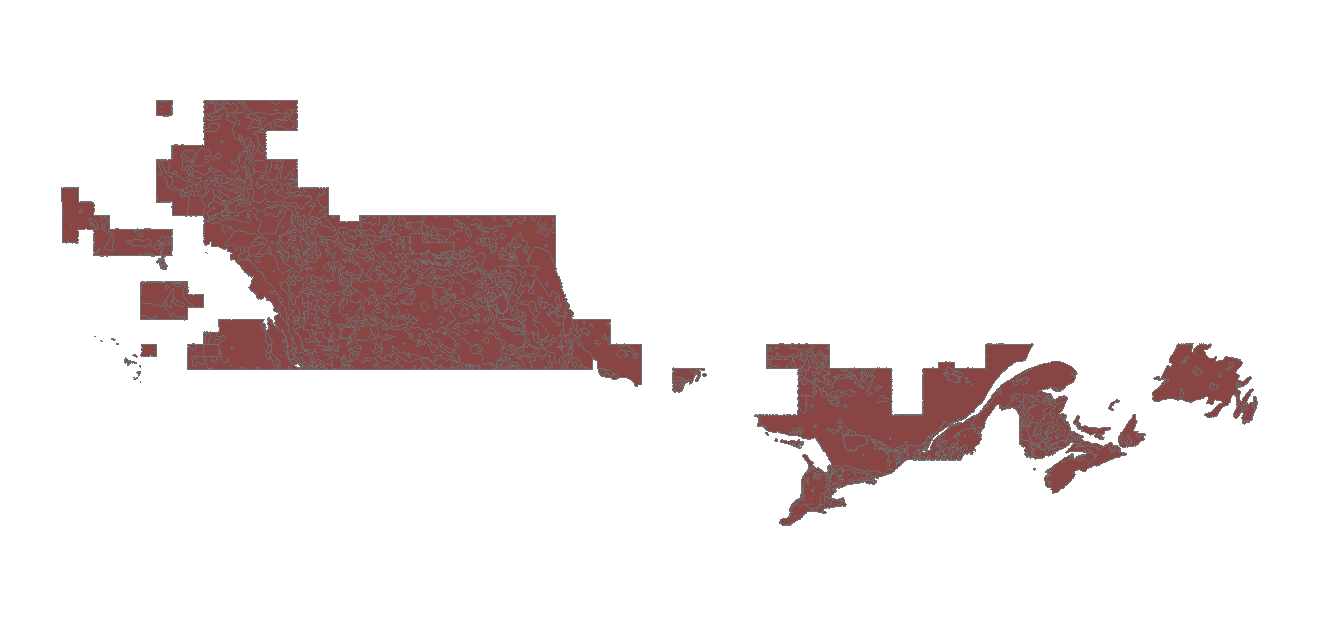
The “Biomass Agriculture Inventory 1-in-20 Probability” dataset is a table that contains the estimated 1-in-20 year low for agricultural residue yield and crop production for each Biomass Report Framework. It provides the fifth percentile values for the years 1985-2016. The table includes straw or stover information for barley, wheat, flax, oats and corn, and crop information for barley, wheat, flax, oats, corn, canola and soybean. This dataset also includes information about the type of tillage used in the area and demand for straw used for cattle bedding and feed. These values are derived from Statistics Canada data. Additionally, the dataset includes the amount of agricultural residue calculated as necessary to remain on the field to prevent soil degradation. Soil degradation is determined by the type of tillage in use as well as the landscape type of the area.
-

“The “Biomass Report Framework” dataset is a fishnet polygon fabric used as a common spatial reporting framework for BIMAT that covers the extent of Canada.
-

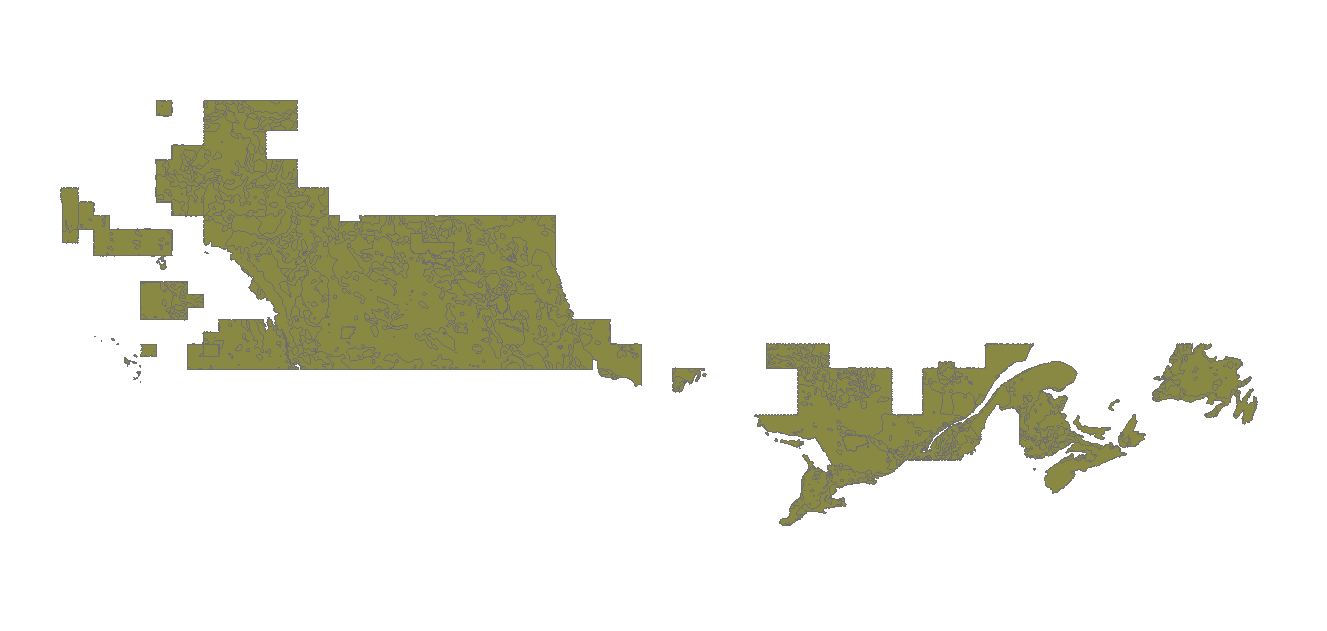
“Biomass Inventory Mapping and Analysis – Business Data” provides a number of datasets related to the yield and production of residues from the agricultural and forestry industry, agricultural crops, and municipal solid wastes across Canada. The datasets contain agricultural residue production information (i.e., straw or stover) for barley, wheat, flax, oats and corn, and crop production information for barley, wheat, flax, oats, corn, canola and soybean. They also include information about amounts of straw required for cattle bedding and feeding, the type of tillage used in an area, and the amount of residue needed for soil conservation purposes. Datasets in the series provide the yield, production and other information for the median year and 1-in-10 year and 1-in-20 year lows. The forestry inventory dataset provides information about the location and quantity of residues from the forestry industry, as well as urban wood waste and potential sites and productivity of plantations of fast-growing trees that are grown as feedstock. Forestry residues include material left at the roadside after harvesting and excess and waste materials from mills. The municipal solid waste inventory dataset provides information about the approximate location and quantity of different types of municipal solid wastes, such as organics (including food and yard), paper and total. A transportation network dataset and datasets that are used to calculate cost to harvest and transport biomass are also included in this series.
-

The Canada Land Inventory (CLI), 1:250,000, Land Capability for Agriculture dataset illustrates the varying potential of a specific area for agricultural production. Classes of land capability for agriculture are based on mineral soils grouped according to their potential and limitations for agricultural use. The classes indicate the degree of limitation imposed by the soil in its use for mechanized agriculture. The subclasses indicate the kinds of limitations that individually or in combination with others, are affecting agricultural land use. Characteristics of the soil as determined by soil surveys.
-

Fisheries landings and effort mapping of the inshore lobster fishery on the DFO Maritimes Region statistical grid (2012-2014). This report describes an analysis of Maritimes Region inshore lobster logbook data reported at a grid level, including Bay of Fundy Grey Zone data reported at the coordinate level. Annual and composite (2012–2014) grid maps were produced for landings, number of license-days fished, number of trap hauls, and the same series standardized by grid area, as well as maps of catch weight per number of trap hauls as an index of catch per unit effort (CPUE). Spatial differences in fishing pressure, landings, and CPUE are indicated, and potential mapping applications are outlined. Mapping the distribution and intensity of inshore lobster fishing activity has management applications for spatial planning and related decision support. The lack of region-wide latitude and longitude coordinates for lobster effort and landings limits the utility of commercial logbook data for marine spatial planning purposes.
-

DFO’s Oceans and Coastal Management Division (OCMD) in the Maritimes Region has updated its fisheries landings maps for 2010–2014. These maps will be used for decision making in coastal and oceans management, including mitigating human use conflicts, informing environmental emergency response operations and protocols, informing Marine Stewardship Council certification processes, planning marine protected area networks, assessing ecological risks, and monitoring compliance and threats in coral and sponge closures and Marine Protected Areas. Fisheries maps were created to identify important fishing areas using aggregate landed weight (kg) per 2 x 2-minute grid cell for selected species/gear types. This dataset has been filtered to comply with the Government of Canada's privacy policy. Privacy assessments were conducted to identify NAFO unit areas containing data with less than five vessel IDs, license IDs and fisher IDs. If this threshold was not met, catch weight locations were withheld from these unit areas to protect the identity or activity of individual vessels or companies. Maps were created for the following species/gear types: 1. Atlantic Halibut 2. Bluefin Tuna 3. Bottom Longline Groundfish 4. Bottom Trawl Groundfish 5. Cod 6. Cod, Haddock, Pollock 7. Cusk 8. Dogfish 9. Flatfish 10. Gillnet Groundfish 11. Greenland Halibut 12. Groundfish 13. Groundfish (quarterly composites Q1, Q2, Q3, Q4) 14. Hagfish 15. Herring 16. Large Pelagics 17. Mackerel 18. Monkfish 19. Offshore Clam 20. Offshore Lobster 21. Grey Zone Lobster 22. Other Crab 23. Other Tuna 24. Pollock 25. Porbeagle, Mako and Blue Shark 26. Red Hake 27. Redfish 28. Scallop 29. Scallop (quarterly composites Q1, Q2, Q3, Q4) 30. Sculpin 31. Sea Urchin 32. Shrimp 33. Silver Hake 34. Skate 35. Snow Crab 36. Squid 37. Swordfish 38. White Hake 39. Wolffish
-

The Canada Land Inventory (CLI), 1:000,000, Land Capability for Agriculture dataset illustrates the varying potential of a specific area for agricultural production. Classes of land capability for agriculture are based on mineral soils grouped according to their potential and limitations for agricultural use. The classes indicate the degree of limitation imposed by the soil in its use for mechanized agriculture. The subclasses indicate the kinds of limitations that individually or in combination with others, are affecting agricultural land use. Characteristics of the soil as determined by soil surveys.
-

The Canada Land Inventory (CLI), 1:000,000, Land Limitation for Agriculture dataset illustrates the varying potential of a specific area for agricultural production. Classes of land capability for agriculture are based on mineral soils grouped according to their potential and limitations for agricultural use. The classes indicate the degree of limitation imposed by the soil in its use for mechanized agriculture. The subclasses indicate the kinds of limitations that individually or in combination with others, are affecting agricultural land use. Characteristics of the soil as determined by soil surveys.
-
This publication contains vector data (shapefile) of the post-harvest forest residues in Canada for the bioenergy/bioproducts sector in oven-dry tonnes per year (ODT/yr) over the next 20 years. The maps were produced using different remote sensing products. We used forest attribute data at 250 m MODIS for the years 2001 and 2011 (Beaudoin et al. 2014 and 2018) combined with forest cover changes for the years 1985 to 2015 contained in the CanLaD dataset at 30 m Landsat(Guindon et al. 2017 and 2018). Results of available biomass (in the form of harvest residues) were reported at the 10 km x 10 km scale, while the map of mature forests in Canada was prepared at the forest management unit (FMU) level. Briefly, our methodology consisted of three steps: 1- create a map of mature forests for the year 2011, based on 2001-2010 average cut volumes within FMUs; 2- develop an annual cut rate from the area harvested within FMUs from 1985 to 2015 and; 3- define the amount of biomass in the form of forest residues available for the bioenergy sector. The biomass of branches and leaves of forest attribute data was used as a proxy to define the biomass of forest residues available. Nationally, the average biomass of forest residues available after harvest is 26 ± 16 ODT/ha, while the total annual availability for all managed forests in Canada was 21 million ODT/yr. A scientific article gives additional details on the methodology: Barrette J, Paré D, Manka F, Guindon L, Bernier P, Titus B. 2018. Forecasting the spatial distribution of logging residues across the Canadian managed forest. Can. J. For. Res. 48: http://www.nrcresearchpress.com/doi/10.1139/cjfr-2018-0080 Reference for this dataset: Barrette J, Paré D, Manka F, Guindon L, Bernier P, Titus B. 2018. Maps forecasting the availability of logging residues in Canada. Natural Resources Canada, Canadian Forest Service, Laurentian Forestry Centre, Quebec, Canada. https://doi.org/10.23687/5072c495-240c-42a3-ad55-c942ab37c32a
 Arctic SDI catalogue