Environmental impact
Type of resources
Available actions
Topics
Keywords
Contact for the resource
Provided by
Years
Formats
Representation types
Update frequencies
status
Service types
-

This database aggregates basic information on orphaned and abandoned mine sites from participating Canadian jurisdictions, including their name, location, jurisdiciton, and the commodity that was mined. It was originally created in 2012 through the National Orphaned/Abandoned Mines Initiative and has undergone several updates since that time. Data on sites in each jurisdiction is owned and maintained by that jurisdiction. The database includes links to the corresponding records in that jursidiction. While the database includes common informaiton about all sites, there may be discrepancies in the types of data provided about sites in different jurisdictions and data from some jurisdictions may be updated more frequently than others.
-

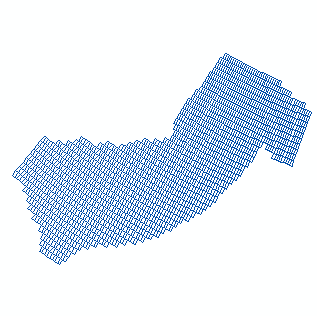
In 2009, Fisheries and Oceans Canada published the Policy on Managing the Impacts of Fishing on Sensitive Benthic Areas. To support the implementation of this policy, a Canadian Science Advisory Secretariat (CSAS) process was initiated to: assess the distribution of fishing effort in Canada’s Atlantic and Eastern Arctic waters from 2005-2014, evaluate the overlap between fishing effort and Significant Benthic Areas (SiBAs), and identify areas of potential conservation concern. Although Research Document 2018/15 (Koen-Alonso et al. 2018), detailing this work, has not been updated since publication, the methodology outlined within it is still used to generate updated fishing effort layers as new data becomes available. This record illustrates cumulative fishing effort in Canada’s Atlantic and Eastern Arctic waters from 2005-2023, and is based on commercial logbook and vessel monitoring system (VMS) data. Fishing effort has been standardized into percentiles, whereby the top 20th percentile of intensity (cell values ≥20) represent cells containing the most intense fishing activities.
-

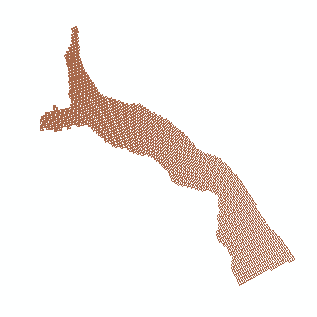
The Beaufort Sea and Mackenzie Delta dataset comes from the Petroleum and Environmental Management Tool (PEMT). The online tool was decommissioned in 2019 and the data was transferred to Open Data in order to preserve it. The PEMT was originally developed in 2009 to help guide development in the Canadian Arctic by Indian and Northern Affairs Canada (INAC). The online tool mapped the sensitivities of a variety of Arctic features, ranging from whales to traditional harvesting, across the Arctic. The tool was intended to aid government, oil and gas companies, Aboriginal groups, resource managers and public stakeholders in better understanding the geographic distribution of areas which are sensitive for environmental and socio-economic reasons. The study area and analytical resolution was defined using the oil and gas leasing grid within the Beaufort Sea. The study area has been the scene of oil and gas exploration activity since 1957. Oil was first discovered at Atkinson Point in 1969 and major gas fields in the early 1970s. Such finds spurred the proposal of the Mackenzie Valley Pipeline in 1974 and the addition of exploration and investment offshore. Exploration and drilling continued both onshore and offshore until the mid-1970s with the release of the Berger Report, which recommended a 10-year moratorium on the construction of the pipeline. After the release of the Berger Report, the pace of onshore activity declined but offshore exploration escalated in the 1980s. Offshore exploration was facilitated with innovative operating techniques and new offshore platforms that extended the ability to operate in the short open-water season and ice. With the minor exception of the small onshore gas field at Ikhil, no oil or gas has been commercially produced in the area. DISCLAIMER: Please refer to the PEMT Disclaimer document or the Resource Constraints - Use Limitation in the Additional Information section below. Note: This is one of the 3 (three) datasets included in the PEMT application which includes the High Arctic and Eastern Arctic datasets.
-

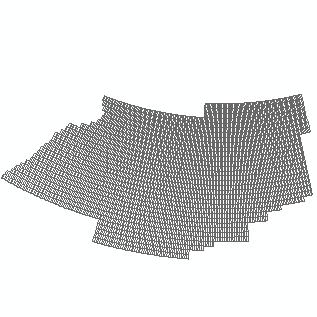
The High Arctic dataset comes from the Petroleum and Environmental Management Tool (PEMT). The online tool was decommissioned in 2019 and the data was transferred to Open Data in order to preserve it. The PEMT was originally developed in 2009 to help guide development in the Canadian Arctic by Indian and Northern Affairs Canada (INAC). The online tool mapped the sensitivities of a variety of Arctic features, ranging from whales to traditional harvesting, across the Arctic. The tool was intended to aid government, oil and gas companies, Aboriginal groups, resource managers and public stakeholders in better understanding the geographic distribution of areas which are sensitive for environmental and socio-economic reasons. The study area is located in the High Arctic Archipelago and contains both marine and terrestrial components. The boundaries of the study area are based on the NOGB leasing grids applied in the High Arctic, under which exploration, significant discovery and production licenses may be issued. The Sverdrup Basin (and Lancaster Sound) has the highest known oil and gas potential of the sedimentary basins of the Arctic Islands (Nunavut Planning Commission 2000) and it is expected that there is oil and gas potential on Melville Island and Bathurst Island (Sivummut Economic Development Strategy Group 2003). To date, no gas has been produced, and 321,470 m³ of oil has been produced from the Bent Horn oil field (Morrell et al. 1995). DISCLAIMER: Please refer to the PEMT Disclaimer document or the Resource Constraints - Use Limitation in the Additional Information section below. Note: This is one of the 3 (three) datasets included in the PEMT application which includes the Beaufort Sea and Mackenzie Delta and Eastern Arctic datasets.
-
This entry provides access to spatial layers that feature in the Canadian Science Advisory Secretariat (CSAS) Science Advice Report titled ‘Delineation of Significant Areas of Coldwater Corals and Sponge-Dominated Communities in Canada's Atlantic and Eastern Arctic Marine Waters and their Overlap with Fishing Activity’ and CSAS Research Document titled ‘Analysis of the overlap between fishing effort and Significant Benthic Areas in Canada's Atlantic and Eastern Arctic marine waters’. These spatial layers show cumulative fishing effort in Canada’s Atlantic and Eastern Arctic waters for the years 2005-2014. Production of the spatial layers was based on vessel monitoring system (VMS) and commercial logbook data sources. Fishing effort is provided in standardized spatial layers for various fisheries groupings: all fisheries combined, aggregations of gear type, and fisheries classes as defined in the CSAS reports. Cette ressource donne accès aux les couches spatiales du document de recherche du SCCS intitulé ' Délimitation des zones importantes de communautés dominées par les coraux et les éponges d'eau froide dans les eaux marines du Canada atlantique et de l'est de l'Arctique et chevauchement avec les activités de pêche’ et ‘Analyse du recoupement entre l'effort de pêche et les zones benthiques importantes dans les eaux marines canadiennes de l'Atlantique et de l'Arctique de l'Est’. Ces couches spatiales montrent l’effort de pêche cumulatif dans les eaux de l’Atlantique et de l’est de l’Arctique canadien pour 2005 à 2014. La production des couches spatiales était fondée sur le Système de surveillance des navires (SSN) et des sources de données des journaux de bord commerciaux. L’effort de pêche est présenté sous forme de couches spatiales normalisées pour divers regroupements de pêches : toutes les pêches combinées, agrégations de types d’engins et catégories de pêches, telles qu’elles sont définies dans les documents de recherche.
-

The Eastern Arctic dataset comes from the Petroleum and Environmental Management Tool (PEMT). The online tool was decommissioned in 2019 and the data was transferred to Open Data in order to preserve it. The PEMT was originally developed in 2009 to help guide development in the Canadian Arctic by Indian and Northern Affairs Canada (INAC). The online tool mapped the sensitivities of a variety of Arctic features, ranging from whales to traditional harvesting, across the Arctic. The tool was intended to aid government, oil and gas companies, Aboriginal groups, resource managers and public stakeholders in better understanding the geographic distribution of areas which are sensitive for environmental and socio-economic reasons. The study area is located east of Baffin Island, Nunavut and encompasses marine habitat in Baffin Bay and Davis Strait. The boundaries of the study area are based on NOGB leasing grids applied in the Eastern Arctic, under which exploration and production licenses may be issued. Although portions of the study area hold high oil and gas potential and several small oil fields and substantial reserves of gas have been found since the 1960s in the north Baffin region, exploration for oil and gas has been limited to seismic operations and geological field work. DISCLAIMER: Please refer to the PEMT Disclaimer document or the Resource Constraints - Use Limitation in the Additional Information section below. Note: This is one of the 3 (three) datasets included in the PEMT application which includes the Beaufort Sea and Mackenzie Delta and High Arctic datasets.
-

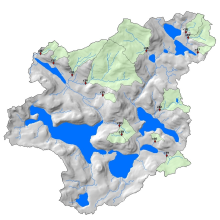
This dataset contains annual mean stream water flow/discharge data derived from daily means for headwater streams draining forested hillslopes measured at stream catchments C31, C32, C33, C34, C35, C37, C38, C39, C42, C46, C47, C49, and C50 in the Turkey Lakes Watershed, approximately 60 km northwest of Sault Ste. Marie, Ontario, Canada. This data set is recorded as annual mean flow by calendar year (January-December in litres per second), annual mean flow by water year (October to September in litres per second), and annual number of zero flow days by water year. Daily mean flows that were used to derive this data set were recorded from 1981-2012 by the Great Lakes Forestry Centre, and are reported for 1981-2011 due to some inaccuracies throughout the 2012 data. Hydrological gauging stations employ "flow-control" 120 degree V-notch weirs (catchments 31, 33, 34, 37, 39, 42, 46, and 47), 90 degree V-notch weirs (catchments 32, 35, and 49), and 60 degrees V-notch weirs (catchment 38) to facilitate monitoring of stream discharge. Water "stage" or depth within the structure (e.g. in the pool behind the weir notch) is automatically and continuously recorded by chart recorders (Leupold & Stevens A-71 SE Water Level Recorder) from 1981-2003. Capacitance rods (Trutrack WT-HR 1000) installed in stilling wells replaced the chart recorders over the period of 2002 to 2003 and were used until 2012. The capacitance rods logged data at 1 hour intervals for the majority of their use and then averaged to a daily rate. Manual stage measurements have been taken intermittently when synoptic water chemistry samples were taken throughout the years. Stage data are then converted to a continuous record of flow using the relationship between stage and discharge measurements.
-

This dataset contains average concentrations of water chemistry collected from stream catchments C31, C32, C33, C34, C35, C37, C38, C39, C42, C46, C47, C49, and C50 in the Turkey Lakes Watershed, approximately 60 km northwest of Sault Ste. Marie, Ontario, Canada. These are average concentrations recorded from 1981-2018 in milligrams per litre (mg/L) of major ions (Ca, Mg, K, Na, SO4, Cl, NO3-N, NH4-N) and some nutrients (TP, TN) collected by the Great Lakes Forestry Centre. Samples are collected according to variable schedules such that frequency generally increased with increasing stream flow, (sampling period was shortest during spring runoff, 1-3 days, and longest during winter, 2-3 weeks). Sampling was accomplished by rinsing an appropriately cleaned 2-litre, polyethylene bottle at least 3 times with stream water followed by immersion to collect the final sample. Care was taken to not disturb the stream sediments throughout the sampling procedure. pH and conductivity testing is completed right after sampling. Other chemical analyses are completed by the Great Lakes Forestry Centre in Sault Ste. Marie within 2 weeks of collection. Sample integrity was maintained through storage in the dark at 4 degrees Celsius and analyzed at room temperature.
 Arctic SDI catalogue