 Arctic SDI catalogue
Observation/Measurement
Type of resources
Available actions
Topics
Keywords
Contact for the resource
Provided by
Formats
Representation types
Update frequencies
status
-
The objectives of the fish component of the integrated oil sands monitoring program are to provide the necessary data/information to address key questions related to both environmental health of fish populations and fish health issues that can be used to inform human use and consumption. The questions underlying the fish monitoring design are related to the status and health of wild fish populations in the Lower Athabasca River including and in an expanded geographical extent. Data is being collected to provide a baseline against which future changes in fish populations will be evaluated, and compared to data from historical studies to assess change over time to the current state. Data is also being collected in areas of new oil sands development, to develop baseline data for future site-specific comparisons, contribute to an expanded geographic basis of the overall monitoring plan, and contribute to an improved ability to examine cumulative effects.
-

The surface water quality (WQ) program, as part of the Joint Canada/Alberta Implementation Plan, is designed to improve the ability to detect change and predict effects in relation to point and non‐point sources. A mass‐balance approach has been used for assessing the quantity, movement, and cycling of materials in the watershed. Applying this approach required a sampling program which included quantification of the sources, transport, flux, and fate of materials and contaminants. The Surface WQ monitoring sampling includes, in part, collection of; - event (freshet and rain) based WQ samples in tributaries ranging from daily to bi-weekly, - WQ samples in the Athabasca River using cross-channel transect methods at specified Phase 1 sites, - enhanced (additional parameters) WQ sampling at M9, M12, and M11A and at 5 new interconnecting channel stations within the Expanded Geographical Area (EGA), - ground water samples in specific high priority tributaries, and - auto-monitoring (near real-time) on a subset of parameters at sites in the EGA
-

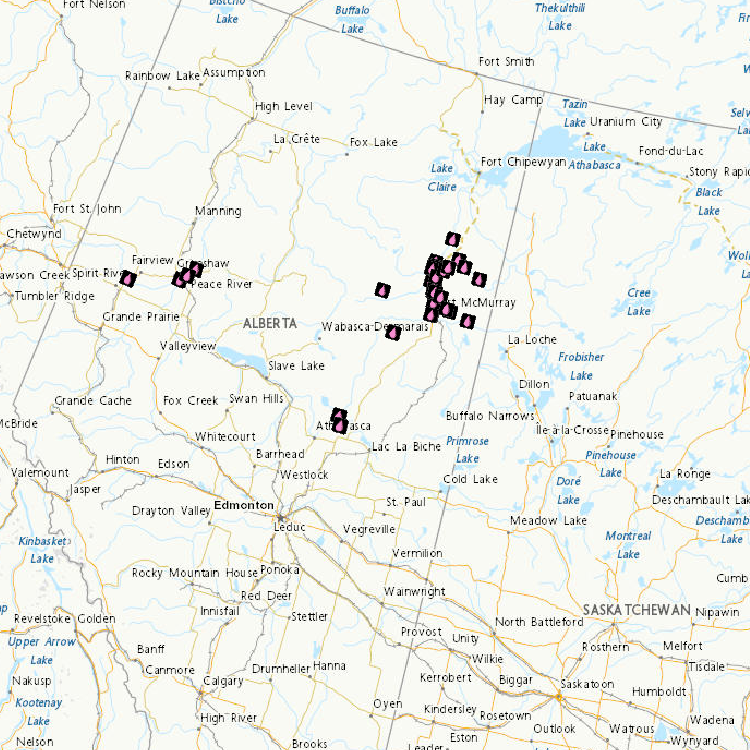
Benthic invertebrates monitoring includes both lotic (rivers/streams) and lentic (wetlands) ecosystems. Aquatic biomonitoring provides a direct measure of change in biotic populations and communities in relation to benchmark or reference conditions and can help identify the ecological effects of cumulative stressors. Used together with the water chemical and physical monitoring components, this program uses an integrated approach to assess whether ecological affects are occurring in response to OS developments. Sampling can include the collection of invertebrates, algal biomass, water chemistry, and appropriate supporting habitat information and is conducted during periods of high abundance and diversity of macroinvertebrates. Sampling focuses on near-shore gravel and sand habitats on the Athabasca River, erosional habitats on major tributaries and in wadable areas in deltaic wetlands within the Expanded Geographical Area. As of October 2012, over 80 locations have been visited.
-
The Canadian Environmental Sustainability Indicators (CESI) program provides data and information to track Canada's performance on key environmental sustainability issues. The Water quality in Canadian rivers indicators provide a measure of the ability of river water across Canada to support plants and animals. At each monitoring site, water quality data are compared to water quality guidelines to create a rating for the site. If measured water quality is below the guidelines, it can maintain a healthy ecosystem. Water quality at a monitoring site is considered excellent when substances in a river are very rarely measured above their guidelines. Conversely, water quality is rated poor when measurements are usually above their guidelines, sometimes by a wide margin. These indicators provide information about the state of surface water quality and its change through time, to support water resource management. Information is provided to Canadians in a number of formats including: static and interactive maps, charts and graphs, HTML and CSV data tables and downloadable reports. See the supplementary documentation for the data sources and details on how the data were collected and how the indicator was calculated. Canadian Environmental Sustainability Indicators - Home page: https://www.canada.ca/environmental-indicators
-

Tree swallow (Tachycineta bicolor) nest boxes are installed in oil sands area and in reference locations to monitor contaminant levels and impacts on tree swallow nestlings. The exposure to tree swallow nestlings to air-borne oil sands-related contaminants such as polycyclic aromatic hydrocarbons (PAHs) is assessed using passive air samplers. Measures of avian health are examined in relation to location of sampling and contaminants measured.
-
Water level and discharge data are available from Water Survey of Canada’s Hydrometric Network. The Water Survey of Canada (WSC) is the national authority responsible for the collection, interpretation and dissemination of standardized water resource data and information in Canada. In partnership with the provinces, territories and other agencies, WSC operates over 2500 active hydrometric gauges across the country, maintains an archive of historical information for over 7600 stations and provides access to near real-time (water level and stream flow) provisional data at over 1700 locations in Canada.
-

The health of individual amphibians, amphibian populations, and their wetland habitats are monitored in the oil sands region and at reference locations. Contaminants assessments are done at all sites. Amphibians developing near oil sands activities may be exposed to concentrations of oil sands-related contaminants, through air emissions as well as water contamination. The focus of field investigations is to evaluate the health of wild amphibian populations at varying distances from oil sands operations. Wood frog (Lithobates sylvaticus) populations are being studied in Alberta, Saskatchewan and the Northwest Territories in order to examine the relationship of proximity to oil sands activities and to prevalence of infectious diseases, malformation rates, endocrine and stress responses, genotoxicity, and concentrations of heavy metals, naphthenic acids and polycyclic aromatic hydrocarbons.
-

Waterfowl and mammals harvested and trapped at various locations in the oil sands region and in reference locations are assessed for contaminant burdens and toxicology. Wildlife samples are obtained from local hunters and trappers. Tissue samples are analysed for concentrations of oil sands-related contaminants (heavy metals, polycyclic aromatic hydrocarbons, and naphthenic acids). Dead and moribund birds collected from tailing ponds are also evaluated for levels and effects of contaminants.
-

Plant health assessments and vegetation surveys are undertaken at both terrestrial and wetland sites in the oil sands region and in reference areas. Plant monitoring is being conducted for biodiversity and contaminants, and because plants are important both as wildlife habitat and as traditional-use species. Plant and soil samples are collected at monitoring sites near and at varying distances from oil sands operations. Plant tissues are being examined for levels of naphthenic acids (NAs), polycyclic aromatic hydrocarbons (PAHs) and heavy metals. Plant indicator species include Vaccinium spp. (blueberry), Ledum groenlandicum (Labrador tea), Arctostaphyllos uva-ursi (common bearberry), and Cornus canadensis (bunchberry). Soil samples from riparian banks and boreal forest locations are also collected for greenhouse studies. These experiments evaluate the uptake, distribution, and toxicity of the contaminants in plant tissue.
-
Assess the importance of atmospheric deposition of contaminants as a contributor to ecological impacts of oil sands development and identify sources. • Use snowpack measurements sampled across a gridwork to develop maps of winter-time atmospheric contaminant loadings for the region ~100 km from the major upgrading facilities • Assess long-term trends in winter-time atmospheric deposition • Determine the potential impact of wintertime snowpack mercury loads on tributary river water mercury concentrations (Spring Freshet) using Geographic Information System and hydrological modelling approaches • Compare snowpack loadings to those obtained from precipitation monitoring and compare spatial patterns to PAC air measurements obtained from passive sampling network All data are subjects of a publication containing method details, full QA/QC, interpretations and conclusions. Citations: A. Dastoor, A. Ryjkov, G. Kos, J. Zhang, J.L. Kirk, M. Parsons, A. Steffen. 2021. Impact of Athabasca oil sands operations on mercury levels in air and deposition. Atmospheric Chemistry and Physics 21, 12783-12807. L. Chibwe, D.C.G. Muir, Y. Gopalapillai, D. Shang, F. Yang, J.L. Kirk, C. Manzano, B. Atkinson, X. Wang, C. Teixeira. 2021. Long-term spatial and temporal trends, and source apportionment of polycyclic aromatic compounds in the Athabasca Oil Sands Region. Environmental Pollution 268A, 115351. J. Culp, I. Droppo, P. di Cenzo, A. Alexander-Trusiak, D. Baird, S. Beltaos, G. Bickerton, B. Bonsal, R. Brua, P. Chambers, Y. Dibike, N. Glozier, J.L. Kirk, L. Levesque, M. McMaster, D.C.G. Muir, J. Parrott, D. Peters, K. Pippy, J. Roy. 2021. Ecological effects and causal synthesis of oil sands activity impacts on river ecosystems: water synthesis review. Environmental Reviews 29. Doi: https://doi.org/10.1139/er-2020-0082. Y. Gopalapillai, J. L. Kirk, M.S. Landis, D.C.G. Muir, C.A. Cooke, C.A., A. Gleason, A. Ho, E. Kelly, D. Schindler, X. Wang, G. Lawson. 2019. Source analysis of pollutant elements in winter air deposition in the Athabasca oil sands region: A Temporal and Spatial Study. ACS Earth and Space Chemistry 38, 1656-1668. W. Wasiuta, J.L. Kirk, P.A. Chambers, A.C. Alexander, F.R. Wyatt, R.C. Rooney, C.A. Cooke. 2019. Accumulating mercury and methylmercury burdens in watersheds impacted by oil sands pollution. Environmental Science & Technology 53, 12856-12864. C. Manzano, D. Muir, J. L. Kirk, C. Teixeira, M. Siu, X. Wang, J.P. Charland, D. Schindler, E. Kelly. 2016. Temporal variation in the deposition of polycyclic aromatic compounds in snow in the Athabasca Oil Sands area of Alberta. Environmental Monitoring and Assessment 188, 542. and J.L. Kirk, D. Muir, A. Gleason, X, Wang, R. Frank, I. Lehnherr, F. Wrona. 2014. Atmospheric deposition of mercury and methyl mercury to landscapes and waterbodies of the Athabasca oil sands region. Environmental Science & Technology 48, 73747383.