 Arctic SDI catalogue
Plante
Type of resources
Categories
Available actions
Topics
Keywords
Contact for the resource
Provided by
Formats
Representation types
Update frequencies
status
-

This database contains observations of [exotic invasive species] (https://www.quebec.ca/agriculture-environnement-et-ressources-naturelles/faune/gestion-faune-habitats-fauniques/gestion-especes-exotiques-envahissantes/propos-especes) () (EEE) floristics collected by the Ministry of the Environment, the Fight against Climate Change, Wildlife and Parks (MELCCFP). This is data on the [main harmful floristic EEE] (https://www.quebec.ca/agriculture-environnement-et-ressources-naturelles/faune/gestion-faune-habitats-fauniques/gestion-especes-exotiques-envahissantes-animales/liste-especes#c306329) for biodiversity and the environment in Quebec and data on which to monitor. These species colonize terrestrial, humid and aquatic environments. The majority of them are established in Quebec while, for others, it is not certain that they are currently in a position to establish successfully in the Quebec climate (occasional observation: the species has been observed on some occasions, but there is no proof that individuals survive and reproduce independently in order to form a population). The data comes from several sources such as: * [Sentinel] (https://www.quebec.ca/agriculture-environnement-et-ressources-naturelles/faune/gestion-faune-habitats-fauniques/gestion-especes-exotiques-envahissantes-animales/signaler-especes#c241546) — MELCCFP tool for reporting EEA citizens; * iNaturalist — citizen science tool and naturalist social network; * Organizations that have carried out detection and inventory work. The update frequency of the various sources varies. Data on EEE are useful for getting a better picture of their distribution in Quebec and for guiding control actions (prevention, detection, control).**This third party metadata element was translated using an automated translation tool (Amazon Translate).**
-
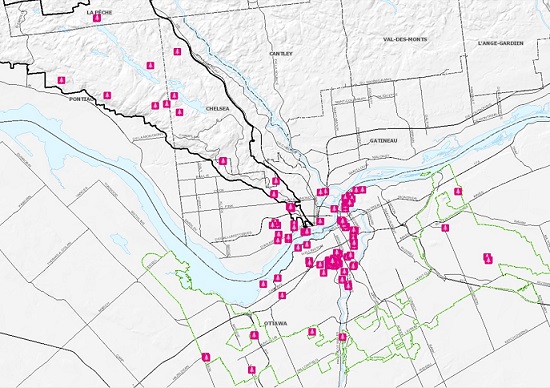
In celebration of the tremendous diversity of tree species that tell the story of our culture and history, the NCC released in September 2020 a compilation of close to 170 remarkable trees across Canada’s Capital region entitled A Living Legacy: Remarkable Trees of Canada’s Capital. An interactive map and downloadable book are available for free on the NCC’s website and will allow the public to discover distinctive features of these trees, revealing a story of the beauty of our natural heritage through the rich diversity of species thriving within Canada’s Capital. This compilation features trees according to their commonalities, which can include their physical relationship with the land, the fact that they were a source of food for Indigenous peoples, or for their contribution to the forest industry. https://ncc-ccn.gc.ca/remarkable-trees https://ncc-ccn.maps.arcgis.com/apps/MapJournal/index.html?appid=a9ba98fb7e8b4c2ba9be337235b95291
-
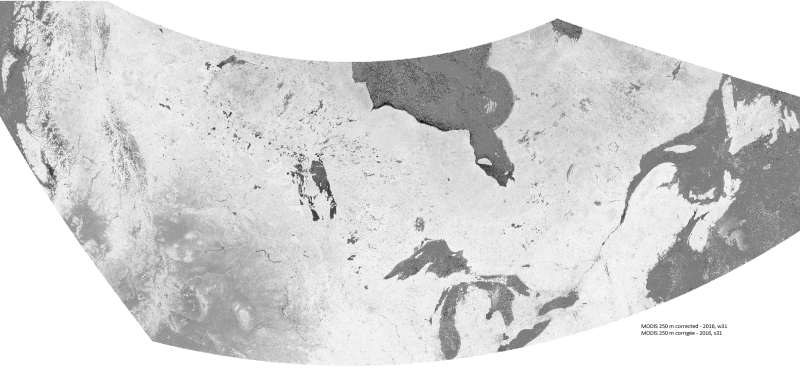
The cloud-corrected NDVI data extracted from historical MODIS satellite images at 250 metre resolution provides reliable, objective, and timely information on the state of vegetation throughout Canada and the northern United States. The methodology applied to the images has remained the same as for the program formerly known as the Crop Condition Assessment Program (CCAP). Since the 2000 growing season, Statistics Canada has been processing and compiling MODerate-resolution Imaging Spectoradiometer (MODIS) data (250 metre resolution). The Multi-Spectral Instrument (MSI) captures two spectral bands (red and infrared) that have proven to be extremely useful to produce the Normalized Difference Vegetation Index (NDVI) utilized for vegetation monitoring. The original NDVI image composites were produced by Agriculture and Agri-Food Canada (link to original data in the resources section). Additional computations were completed by Statistics Canada to remove the effects of residual clouds and to calculate and extract the NDVI by geographic region. This dataset provides access to the MODIS images from 2000 to present in GeoTIFF format and covers the crop area during the growing season (Julian weeks 15 to 37; mid-April to mid-September). It also provides access to a database that contains the statistical NDVI by geographic regions (Townships, Census Consolidated Subdivisions (CCS), Census Divisions (CD) and Census Agricultural Regions (CAR)) and agricultural masks (Agriculture (AGR), Crop (CROP) and Pasture (PAS)).
-
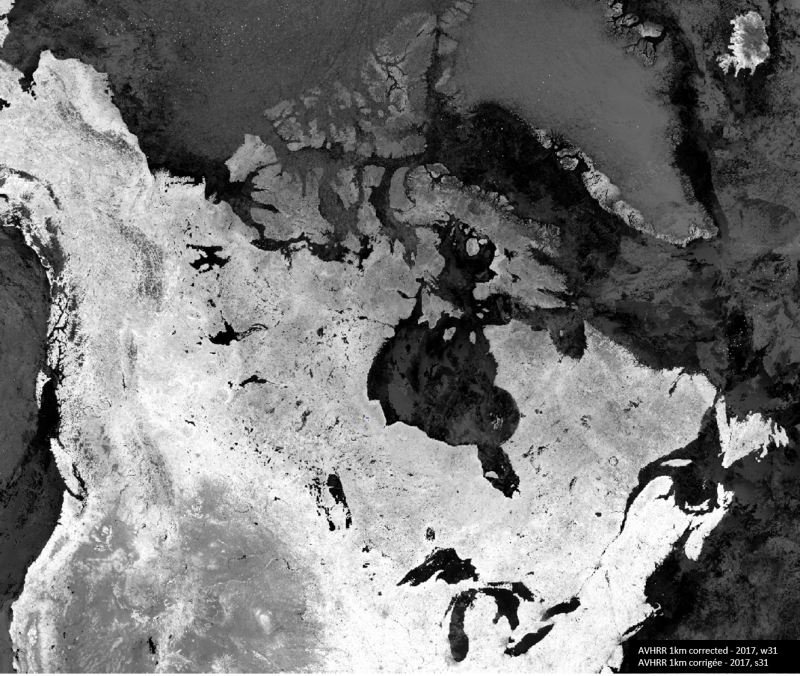
The cloud-corrected representation of the NDVI using historical AVHRR and VIIRS satellite images at 1 kilometre resolution provides reliable, objective and timely information on the state of vegetation throughout Canada and the northern United States. The methodology applied to the images has remained the same as for the program formerly known as the Crop Condition Assessment Program (CCAP). Since 1987, the National Oceanic and Atmospheric Administration (NOAA) series of satellites carrying the Advanced Very High-Resolution Radiometer (AVHRR) records images of the entire Earth's surface twice a day at 1kilometre resolution. This sensor captures two spectral bands (red and infrared) that have proven to be extremely useful for vegetation monitoring to produce the Normalized Difference Vegetation Index (NDVI). NDVI image composites on crop condition were produced by GeoManitoba until the end of the 2020 growing season. In 2021, Statistics Canada started producing the weekly composites using an application developed by Dr. Rasim Latifovic from National Resources Canada. Since 2022, due to the aging AVHRR sensor affecting the quality of the weekly composites, the team has transitioned to the NOAA-20 - Visible Infrared Imaging Radiometer Suite (VIIRS) satellite. VIIRS is a new-generation satellite with spectral characteristics comparable to those of its predecessor. To keep the NDVI values stable and continuous throughout the time series, the VIIRS composite values are normalized to obtain comparable NDVI values. Additional computations were performed by Statistics Canada for Julian weeks 15 to 41 to remove residual clouds from the NDVI composites and statistical extractions by geographic regions using three different types of agricultural masks. This dataset gives access to AVHRR images from 1987 to mid-2022 and VIIRS images from mid-2022 to present in GeoTIFF format and covers the agricultural land during the growing season of the field crops in Canada (Julian weeks 15 to 41). It also provides access to a database that contains the statistical NDVI by geographic regions (Townships, Census Consolidated Subdivisions (CCS), Census Divisions (CD) and Census Agricultural Regions (CAR)) and agricultural masks (Agriculture (AGR), Crop (CROP) and Pasture (PAS)).
-

Canada's National Forest Inventory ground plots are a stratified random sample of select Canadian terrestrial ecozones. Ground plots are remeasured periodically. Data from ground plots include field measurements, compiled attributes and descriptions made at a point inside or adjacent to a photo plot. Ground plot data include individual large-tree and small-tree measurements, shrub tallies, understory vegetation sampling, vegetation cover, stump assessments, woody debris data, surface substrates, site descriptions and soil measurements.
-
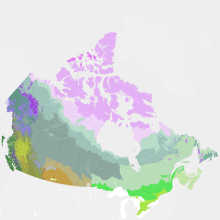
"Vegetation Zones of Canada: a Biogeoclimatic Perspective" maps Canadian geography in relation to gradients of regional climate, as expressed by potential vegetation on zonal sites. Compared to previous similar national-scale products, "Vegetation Zones of Canada" benefits from the work of provincial and territorial ecological classification programs over the last 30+ years, incorporating this regional knowledge of ecologically significant climatic gradients into a harmonized national map. This new map, reflecting vegetation and soils adapted to climates prior to approximately 1960, can serve as a broad-scale (approximately 1:5 M to 1:10 M) geospatial reference for monitoring and modeling effects of climate changes on Canadian ecosystems. "Vegetation Zones of Canada: a Biogeoclimatic Perspective" employs a two-level hierarchical legend. Level 1 vegetation zones reflect the global-scale latitudinal gradient of annual net radiation, as well as the effects of high elevation and west to east climatic and biogeographic variation across Canada. Within the level 1 vegetation zones, level 2 zones distinguish finer scale variation in zonal vegetation, especially in response to elevational and arctic climatic gradients, climate-related floristics and physiognomic diversity in the Great Plains, and maritime climatic influences on the east and west coasts. Thirty-three level 2 vegetation zones are recognized: High Arctic Sparse Tundra Mid-Arctic Dwarf Shrub Tundra Low Arctic Shrub Tundra Subarctic Alpine Tundra Western Boreal Alpine Tundra Cordilleran Alpine Tundra Pacific Alpine Tundra Eastern Alpine Tundra Subarctic Woodland-Tundra Northern Boreal Woodland Northwestern Boreal Forest West-Central Boreal Forest Eastern Boreal Forest Atlantic Maritime Heathland Pacific Maritime Rainforest Pacific Dry Forest Pacific Montane Forest Cordilleran Subboreal Forest Cordilleran Montane Forest Cordilleran Rainforest Cordilleran Dry Forest Eastern Temperate Mixed Forest Eastern Temperate Deciduous Forest Acadian Temperate Forest Rocky Mountains Foothills Parkland Great Plains Parkland Intermontane Shrub-Steppe Rocky Mountains Foothills Fescue Grassland Great Plains Fescue Grassland Great Plains Mixedgrass Grassland Central Tallgrass Grassland Cypress Hills Glaciers Please cite this dataset as: Baldwin, K.; Allen, L.; Basquill, S.; Chapman, K.; Downing, D.; Flynn, N.; MacKenzie, W.; Major, M.; Meades, W.; Meidinger, D.; Morneau, C.; Saucier, J-P.; Thorpe, J.; Uhlig, P. 2019. Vegetation Zones of Canada: a Biogeoclimatic Perspective. [Map] Scale 1:5,000,000. Natural Resources Canada, Canadian Forest Service. Great Lake Forestry Center, Sault Ste. Marie, ON, Canada.
-

This 4th edition Plant Hardiness Zones map shows updated zones related to perennial plant survival in Canada. The map is based on a formula using seven climate variables that influence plant survival: 1. Monthly mean of the daily minimum temperatures of the coldest month. 2. Mean frost-free period above 0°C in days. 3. Amount of rainfall from June to November. 4. Monthly mean of the daily maximum temperatures of the warmest month. 5. A winter harshness index related to rainfall in January. 6. Mean maximum snow depth. 7. Maximum wind gust in 30 year period. The original map was developed by Agriculture and Agri-Food Canada in the early 1960s based on average climate values from 1930 to 1960. This new map uses 1991 to 2020 averages. The map shown to the left of this map shows an alternative plant hardiness zone approach using just one climate variable: average extreme minimum temperature for the period 1991 to 2020. This was originally developed by scientists at the United States Department of Agriculture (see https://www.usna.usda.gov/science/plant-hardiness-zone-map/). The development of these maps was made possible through a collaborative effort by scientists at Natural Resources Canada’s Canadian Forest Service, Environment Canada, and Agriculture and Agri-Food Canada. A paper describing the research, “Updated plant hardiness zones for Canada and assessment of change over time”, can be found in Scientific Reports, Vol. 15(1), 22774 ( https://doi.org/10.1038/s41598-025-00931-5).These maps were produced by the Canada Centre for Mapping and Earth Observation, Natural Resources Canada. To view an interactive version of this map and for more information on plant hardiness zones in Canada, please go to: https://www.planthardiness.gc.ca.